People love to argue about SQL and Python. Which is better? Which one should I use for 'insert data analytics task here'? Which one should I get tattooed on my forehead?
We opt for the “por que no los dos?” approach — Hex lets you use Python and SQL interchangeably in the same environment, and we are completely agnostic as to which tasks you use each language for. We’re pretty confident that this polyglot approach is a more efficient way to do data work!
But this week we've decided to pick favorites, with a bunch of posts on using SQL in Hex— and only SQL. We want to emphasize that you can build amazing data applications in Hex using just SQL. In fact, we think Hex is still the best tool for data work even if you're only using SQL.
For more, see SQL Notebooks > SQL Runners.
From Query to ???
Traditional SQL workflows fall short throughout the entire analytics lifecycle on organization, versioning, and collaboration (see SQL Notebooks > SQL Runners). But even once you've polished your queries and got some rock-solid insights, you still just have a bunch of text, and maybe a simple chart or two. Probably in a browser tab, or a local SQL IDE window.
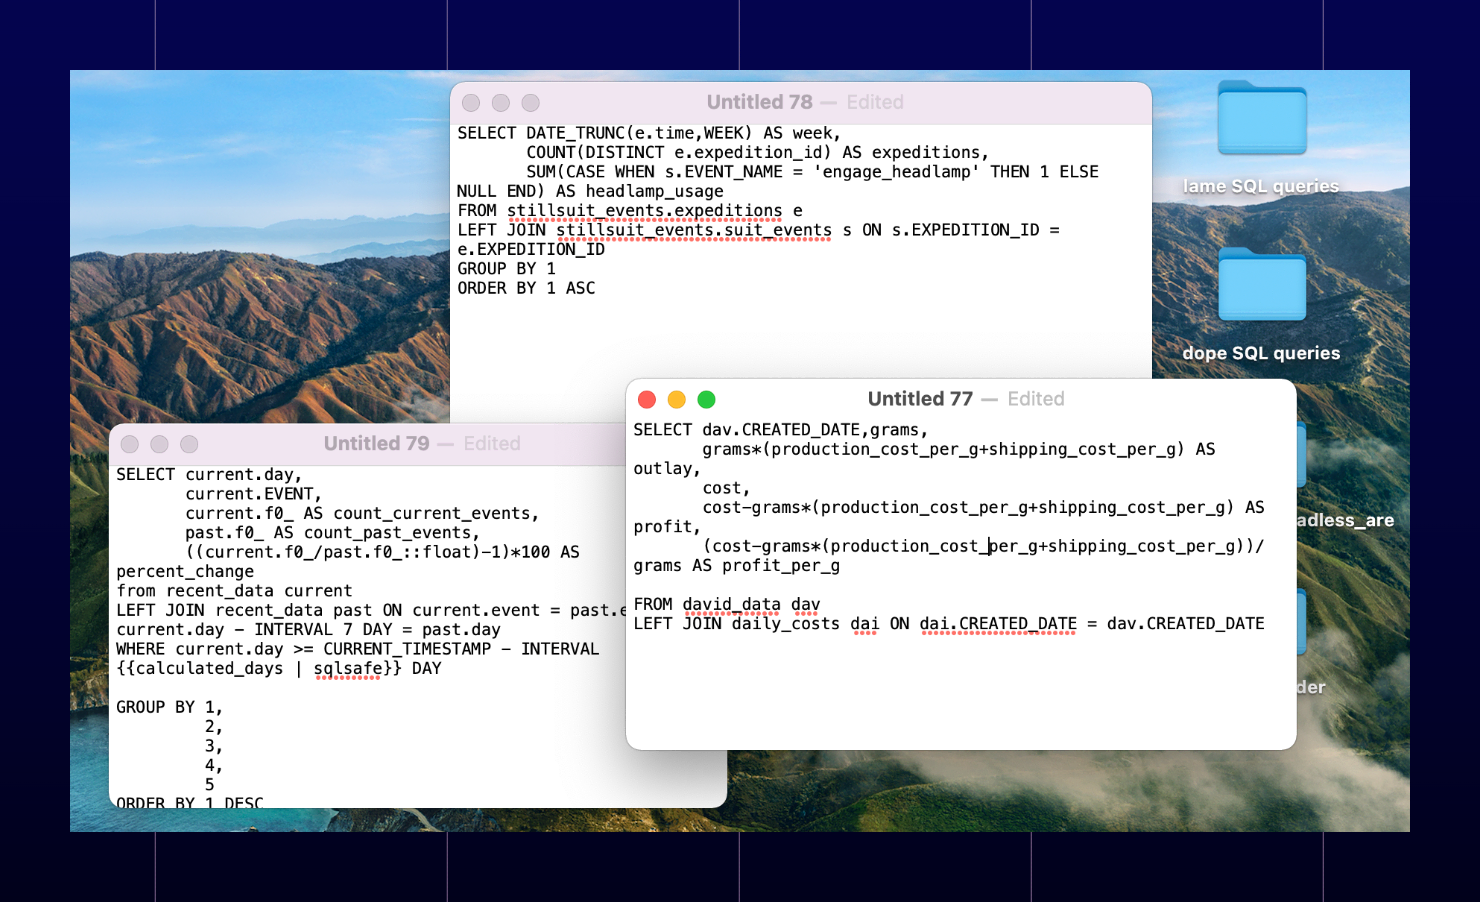
It's easy to point-and-click dashboards together in a BI tool, but how do you take a series of ad-hoc SQL queries and turn them into something that tells a context-rich story and is shareable with anyone? Spoiler: you probably end up just quickly pasting screenshots into a google doc, sacrificing reproducibility and interactivity (see noscreenshots.club).
Data apps are the best, but they're hard to build
Data applications are all the rage these days because of their flexibility and easy interactivity, but they're tough for SQL-only analysts to build. Streamlit, "the fastest way to build and share data apps", uses Python. Shiny works great for R users. There's myriad tools available for folks comfortable writing Javascript. But for those doing work in SQL, there's no easy way to just take a bunch of queries and turn them into something flexible, interactive, and shareable with one click.
And even for data practitioners that are comfortable with Python, or R, or JS and beyond, if the analytics part of a task only requires SQL, then it's still a pain to have to wrap queries in Python or HTML templates just to serve them up to users.
How does Hex make it better?
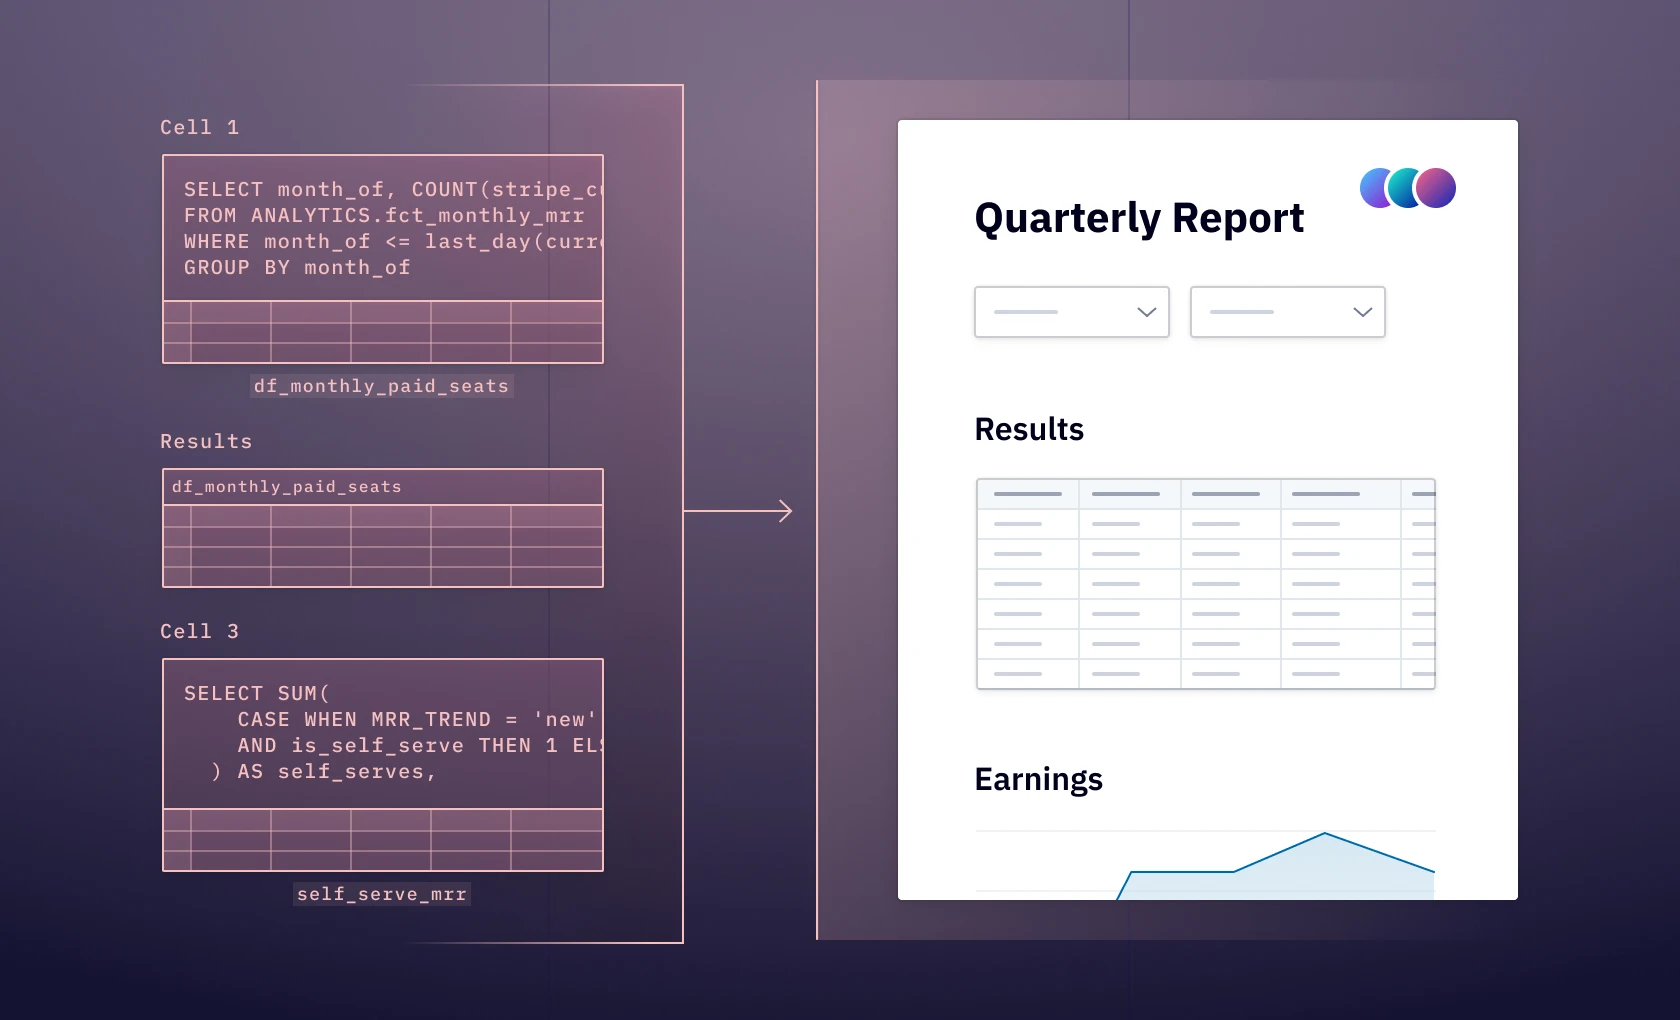
Hex lets you go directly from raw SQL queries to publishable app, with literally one click. You can construct beautiful no-code charts, parameterize queries with user input, and intermix data & rich text, all in the same workspace where you were prototyping and collaborating on SQL.
Below is an embedded example of a SQL data application that I made in Hex in just over 10 minutes, truly writing no code besides SQL. It has rich text that's parameterized with values from queries, tabular displays of data, a time-series chart, and an interactive input.
Any stakeholder with a web browser can view, interact with, and even comment on this app— no Python environment or special knowledge required. Any changes made to the backend SQL can be instantly updated with one click.
Check out the behind-the-scenes Logic View to see the SQL powering this app. It's self-documenting, neatly organized, and easy to understand.
How it's made: Data App Edition
The ability to build a rich and interactive data application using just SQL queries tremendously speeds up time-to-value for ad-hoc analyses and stakeholder requests.
Don't believe me? Here’s a one-take video of me building the app you see embedded above, taking just over 10 minutes (with lots of ums and hmms), using no code besides good old SQL.
Some of the key features
There are some crucial quality of life improvements that Hex adds to make building data apps with SQL as easy as possible.
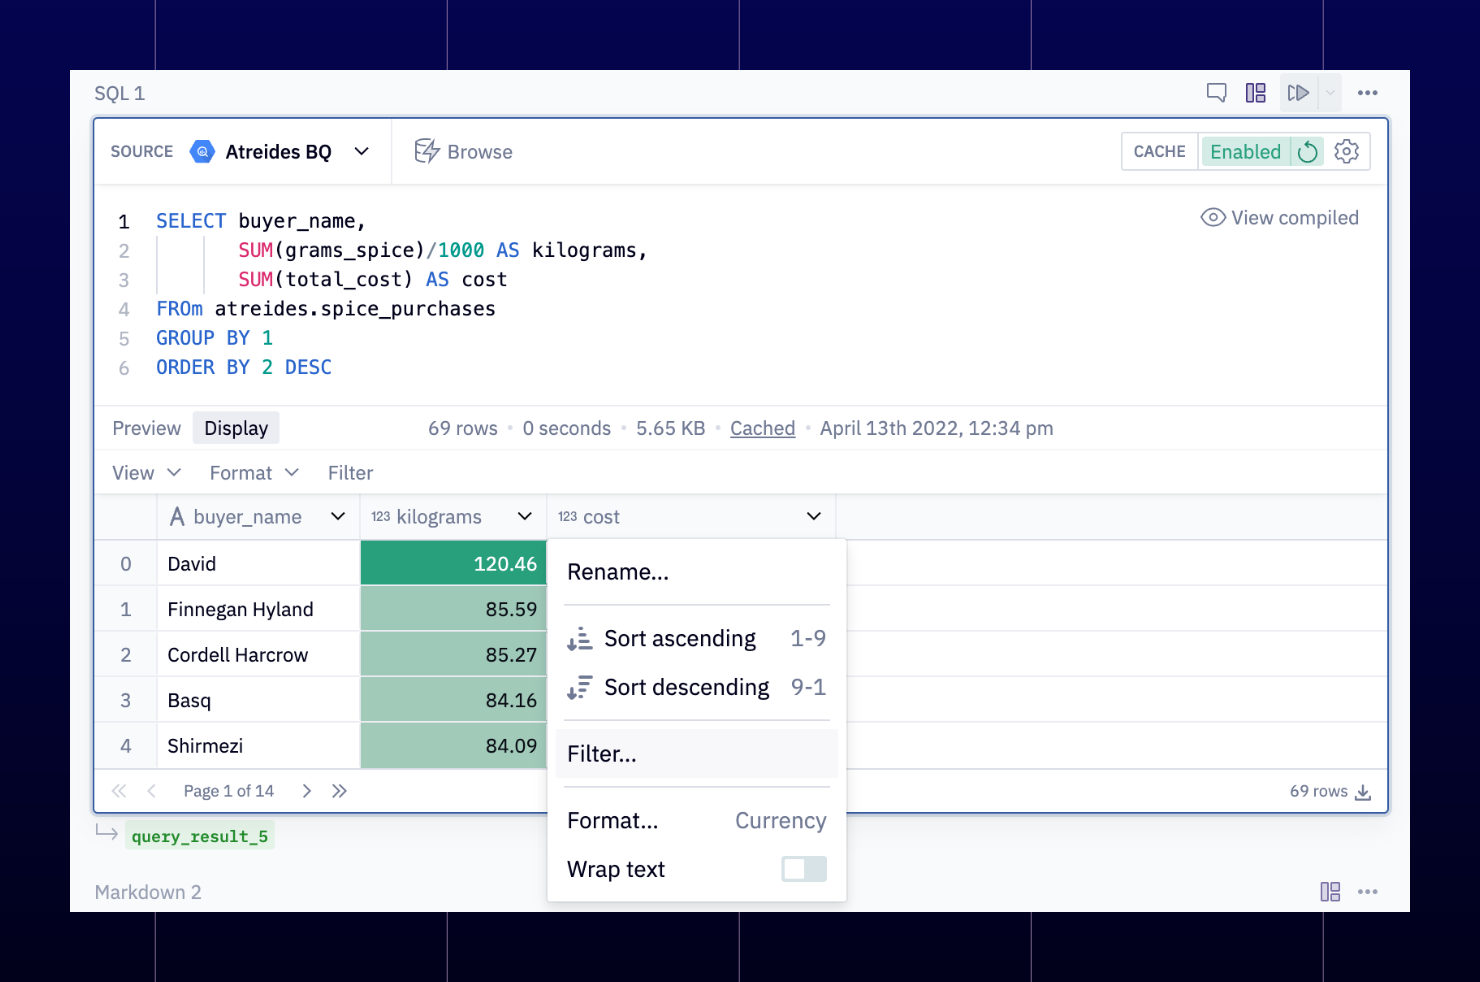
SQL Display Tables: Every SQL query in Hex powers a rich tabular display that allows for formatting, reordering, and filtering. You can prepare raw results for consumption, directly from the query output.
Query Caching: SQL queries can be cached to provide a snappier application interface. Set a query to refresh "On Scheduled Run" to always serve cached results, or allow queries to run once on first load and then use cached results. This means you can productionize long-running queries without forcing end users to wait for data to return.
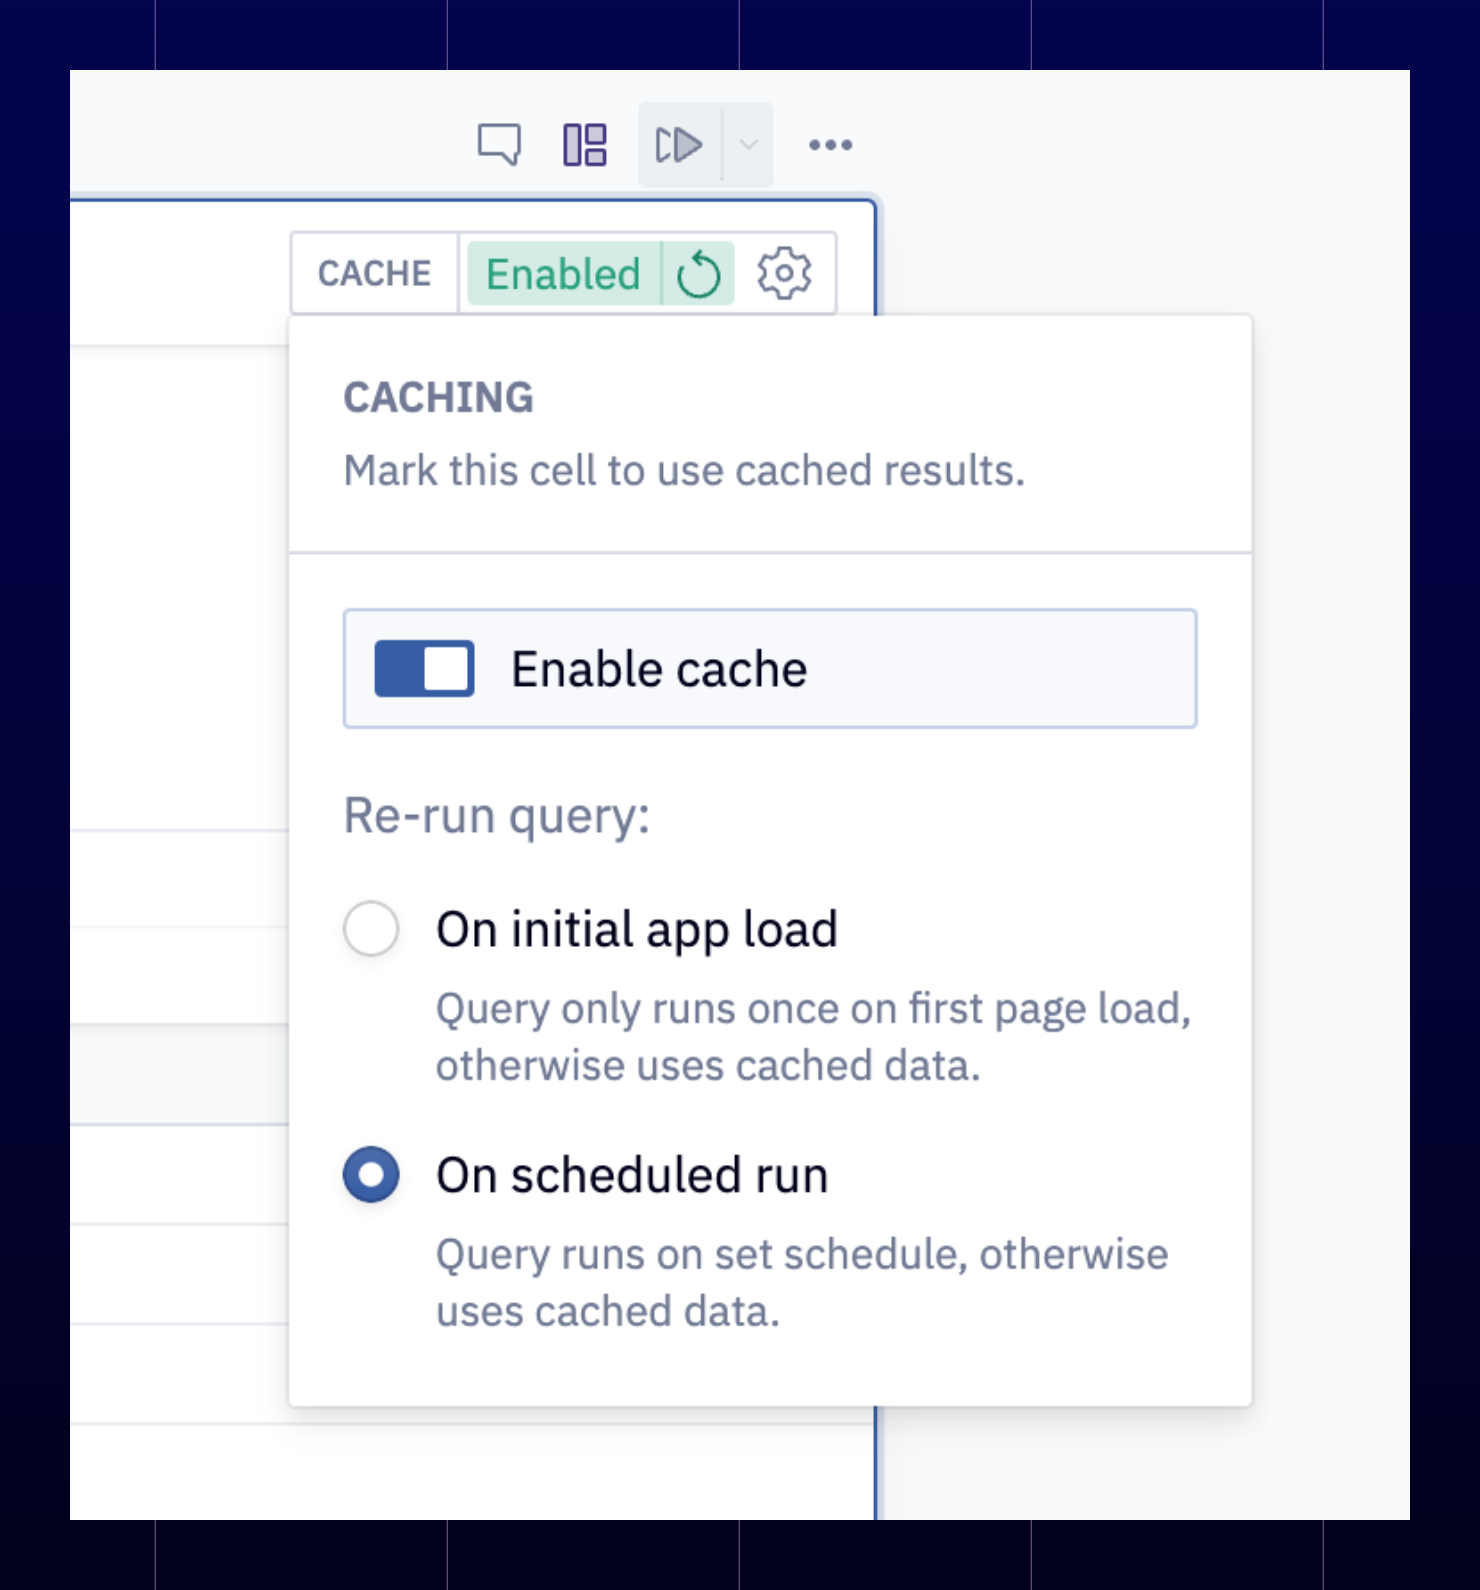
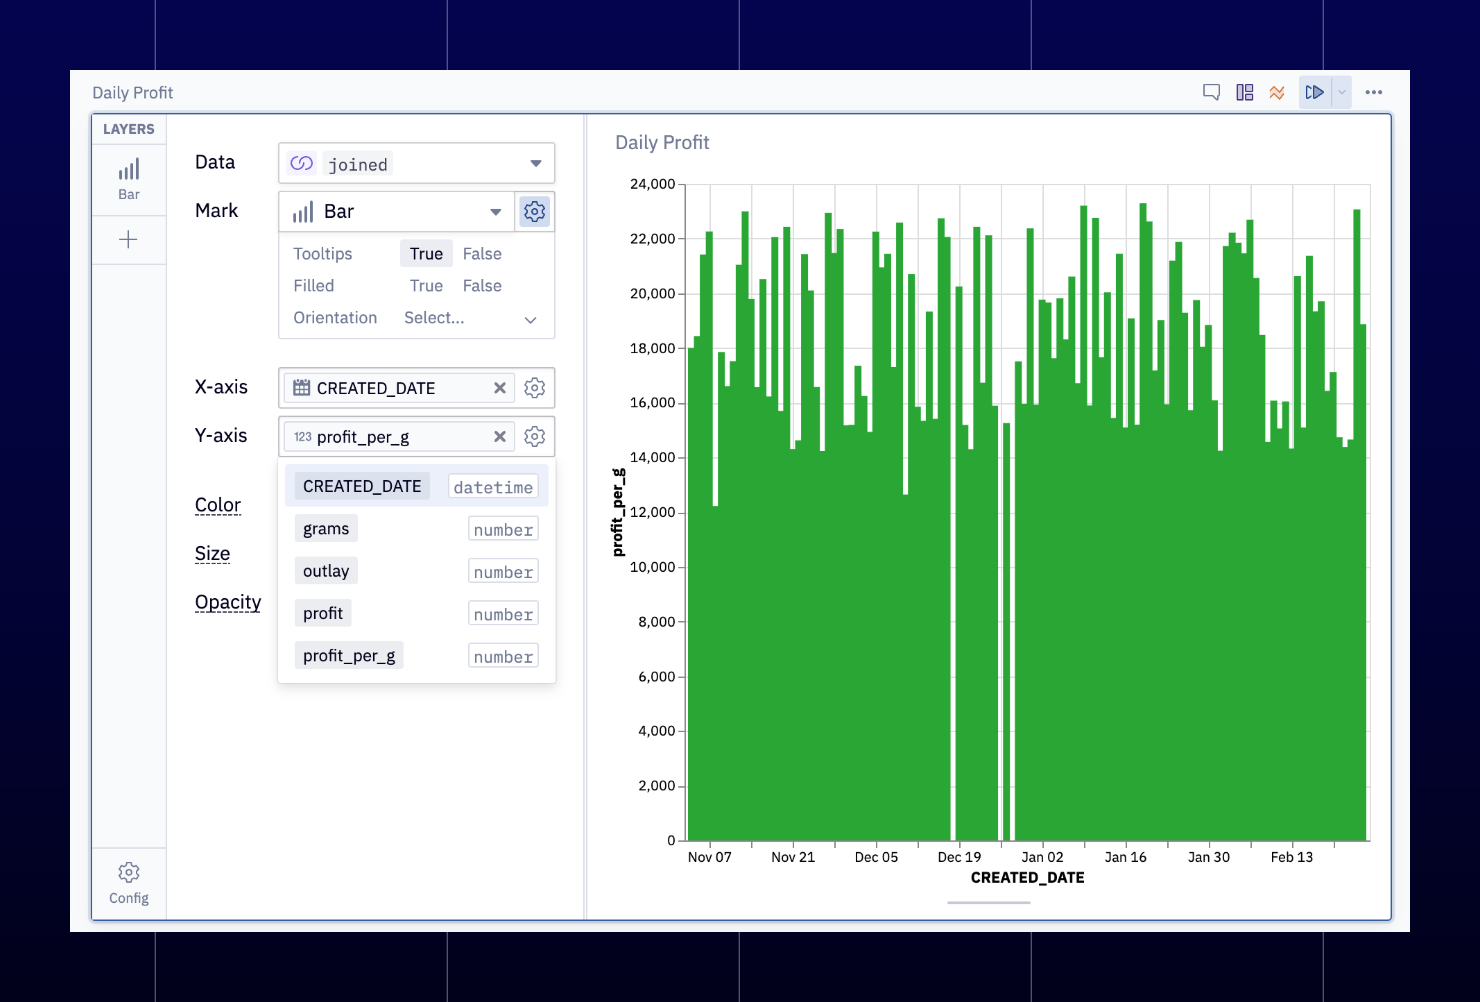
Chart Cells: Chart Cells let you turn the output of any SQL query into a beautiful, interactive visualization. Add layers, aggregate data, customize colors, and more— all without writing any code.
App Builder: The App Builder autogenerates an app layout based on your app that's often ready to publish. Tweaking things is as easy as dragging, dropping, and resizing. When you're satisfied, you can publish the app and make it accessible to anyone.
I use Hex for SQL only workflows all the time, and these features make it feel like a first-class SQL editor, runner, and app builder all in one. Best of all, my work is always just a few clicks away from being shared, consumed, and commented on.