Churn Prediction

Izzy Miller
Hex is the most powerful development environment for prototyping and deploying predictive models. With direct SQL access to your data warehouse, a polyglot environment ...
How to build: Churn Prediction
Imagine you're a data scientist working at a telecom company, and you start creating a dashboard project that shows all of the new and canceled subscriptions from within the past few months. You notice that there's been a dip in revenue, and you start investigating the possible reasons for this change. You see that the churn rate has been slowly increasing with every passing month.
What do you do? You can produce a simple metrics dashboard highlighting this increasing churn for product managers and execs, giving them the data they need to decide.
But such a dashboard won’t give them a true understanding of what is causing churn. Instead, you can build a churn model into the dashboard, giving them the retrospective data of who has churned and the ability to predict who will churn and take decisions from there.
Modeling is a core function of a data analyst. Here, we’re going to go through how you construct a churn model then how you can present this data in a way that allows any analyst or end-user to work with this data to predict future churn.
Creating the Model
Python is the ideal language for machine learning due to its simplicity and flexibility and an extensive array of libraries and frameworks that cater to various aspects of data science and machine learning.
We will put many of those libraries to use in this model. Here are our import statements at the start of our notebook:
import pandas as pd
import numpy as np
import seaborn as sns
import matplotlib.pyplot as plt
import sklearn
from imblearn.over_sampling import SMOTE
import json
from sklearn.cluster import KMeans
from sklearn.metrics.pairwise import cosine_similarity
from sklearn.model_selection import train_test_split
import sklearn.linear_model as linearModels
import sklearn.ensemble as ensembleModels
from sklearn.preprocessing import StandardScaler
from sklearn.decomposition import PCA
from sklearn.metrics import confusion_matrix, accuracy_score, precision_score, recall_score, roc_auc_score, classification_report
First, we’re importing some common data science libraries:
pandasis used for data manipulation and analysis. It offers data structures like DataFrames, which make it easy to handle structured data.numpyis a library for numerical computing in Python. It provides support for arrays, matrices, and a large collection of high-level mathematical functions.seabornandmatplotlib.pyplotare used for data visualization. Seaborn is built on top of matplotlib and provides a high-level interface for drawing attractive and informative statistical graphics.
Then we are importing Scikit-learn (sklearn) for the actual Machine Learning:
sklearn(or scikit-learn) is a widely used library for machine learning. It includes various tools for model fitting, data preprocessing, model selection, and evaluation.- Specific functions and sub-modules are imported for different purposes:
KMeansfor clustering analysis.cosine_similarityto compute similarity between samples.train_test_splitto split datasets into training and testing sets.linearModelsandensembleModelsfor different types of regression and ensemble methods.StandardScalerfor feature scaling.PCAfor principal component analysis (dimensionality reduction).- Various metrics like
confusion_matrix,accuracy_score,precision_score,recall_score,roc_auc_score,classification_reportfor model evaluation.
We also want to import SMOTE for handling class imbalance. SMOTE, or Synthetic Minority Over-sampling Technique, is a popular method used in machine learning to address class imbalance in datasets. Class imbalance occurs when the number of instances of one class significantly outnumbers the instances of another class, which can lead to biased or poor performance of machine learning models.
The key benefits of SMOTE are:
- Improved model performance. By balancing the class distribution, models are less likely to be biased towards the majority class.
- Avoiding overfitting. Unlike simple oversampling, which duplicates minority class samples and can lead to overfitting, SMOTE creates new, synthetic samples, providing more generalization.
- Versatility. SMOTE can be applied in various domains where class imbalance is a problem, such as fraud detection, medical diagnosis, and risk assessment.
Finally, we want to importjson for JSON serialization and deserialization.
Before we get into the actual modeling, we want to do a little bit of preprocessing. Using a Hex SQL cell, we can load our data using SQL directly rather than going through a SQL connector with Python:
select * from "DEMO_DATA"."DEMOS"."TELECOM_CHURN"This query is asking the database to return all columns of data from the TELECOM_CHURN table, which is located within the DEMOS schema of the DEMO_DATA database.
Then we want to separate out or target variable in the dataset, churn, from the possible features:
feature_names = [col for col in data.columns if col != 'Churn']feature_names will be a list containing all column names from the DataFrame data, except for the column 'Churn'.
Now, we can train our machine learning model. We’re going to use a Random Forest Classifier. A Random Forest Classifier is an ensemble learning method that operates by constructing multiple decision trees during training and outputting the class that is the mode of the classes (classification) of the individual trees.
Random Forest Classifiers are known for high accuracy, ability to run efficiently on large datasets, and capability to handle thousands of input variables without variable deletion. Random Forest is particularly effective due to its method of averaging multiple deep decision trees, trained on different parts of the same training set, to reduce the risk of overfitting.
Here’s our training code:
print("Training in progress...", end = " ")
model = ensembleModels.RandomForestClassifier(
    random_state=222
)

upsampler = SMOTE(random_state = 111)

# To scale our data
scaler = StandardScaler()

# Extract the training features
features_names = [col for col in data.columns if col != 'Churn']
features = data[feature_names]

# Scale training features
scaled_features = scaler.fit_transform(features)

# extract the target
target = data['Churn'].to_numpy()

# upsample the minority class in the dataset
r_features, r_target = upsampler.fit_resample(scaled_features, target)

# create an upsampled dataset
up = pd.DataFrame(r_features, columns = feature_names)
up['Churn'] = r_target

# split into train set and test set
x_train, x_test, y_train, y_test = train_test_split(
    r_features, r_target, train_size=0.8, random_state=444
)

# Train the model
model.fit(x_train, y_train)
print('Finished!')
Sure, I can explain this code. It appears to be a Python script for training a machine learning model, specifically using Random Forest classifier. The script involves data preprocessing, feature scaling, handling class imbalance with SMOTE, and finally training the model.
First, we initialize a Random Forest classifier from the sklearn ensembleModelsmodule. This is initialized with a random_state parameter for reproducibility of results.
We then initialize SMOTE for upsampling, again with a random_state, to balance class distribution in the dataset by creating synthetic samples. It's important to note that SMOTE should be applied only to the training data and not to the test data, as the goal is to create a model that generalizes well to new, unseen data.
Additionally, SMOTE may not always be the best approach, especially in cases where the minority class is not well represented or is very distinct from the majority class. In such scenarios, other techniques like advanced sampling methods or cost-sensitive learning might be more appropriate.
Then we set up a scaler using StandardScaler to standardize features by removing the mean and scaling to unit variance, then extract our features and apply the scaler to the features, scaling them accordingly.
The upsampling with SMOTE to the scaled features and target, balances the class distribution. With the upsampled features and target, we then create new DataFrames to use.
With the preprocessing done, let’s train our model. First, we need to split the upsampled dataset into training and testing sets, with 80% of the data used for training.
x_train, x_test, y_train, y_test = train_test_split(
    r_features, r_target, train_size=0.8, random_state=444
)
Then train the Random Forest classifier on the training data.
With the model trained, we want to evaluate the performance of our machine learning model. To do that, we take the the predictions outputs from model.predict and calculate the accuracy, precision, and recall from the model:
predictions = model.predict(x_test)
accuracy = round(accuracy_score(y_test, predictions), 3)
precision = round(precision_score(y_test, predictions), 3)
recall = round(recall_score(y_test, predictions), 3)- Accuracy:
accuracy_score(y_test, predictions)computes the accuracy of the model, which is the proportion of correct predictions out of all predictions made. Accuracy is a good measure when the class distributions are similar. - Precision:
precision_score(y_test, predictions)calculates the precision of the model. Precision is the ratio of correctly predicted positive observations to the total predicted positive observations. It answers the question: "Of all the instances labeled as positive by the model, how many actually were positive?" Precision is critical in situations where false positives are more costly than false negatives. - Recall:
recall_score(y_test, predictions)measures the recall of the model. Recall (also known as sensitivity) is the ratio of correctly predicted positive observations to the all observations in actual class. It answers the question: "Of all the actual positive instances, how many did the model correctly identify?" Recall is important when the cost of false negatives is high.
We can visualize these metrics using single-value cells:
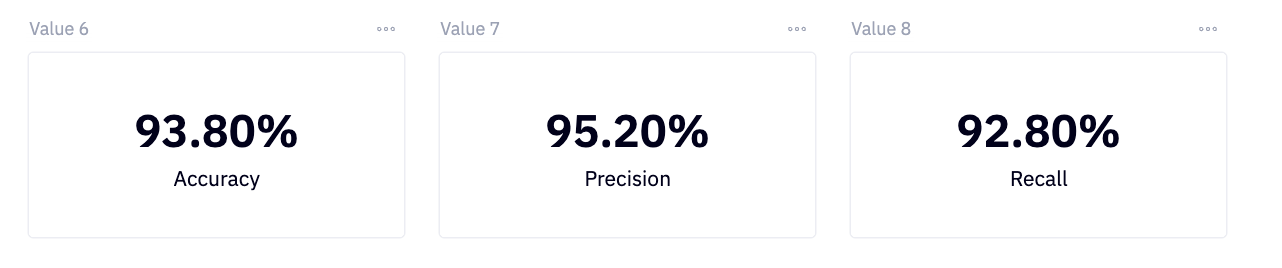
Looks like our model is working well.
These metrics make sense for churn modeling, but the choice of metric depends on the specific requirements and context of the problem being addressed.
Next, we extract the important features from our model:
importances = pd.DataFrame(list(zip(features.columns, model.feature_importances_)), columns = ['feature', 'importance'])The resulting DataFrame, importances, has a row for each feature of the model, with the feature name and its corresponding importance. This is useful for interpreting the model, as it allows you to see which features are most influential in making predictions. Features with higher importance scores are generally more significant in the model's decision-making process. Again, let’s visualize these, this time using a bar chart:
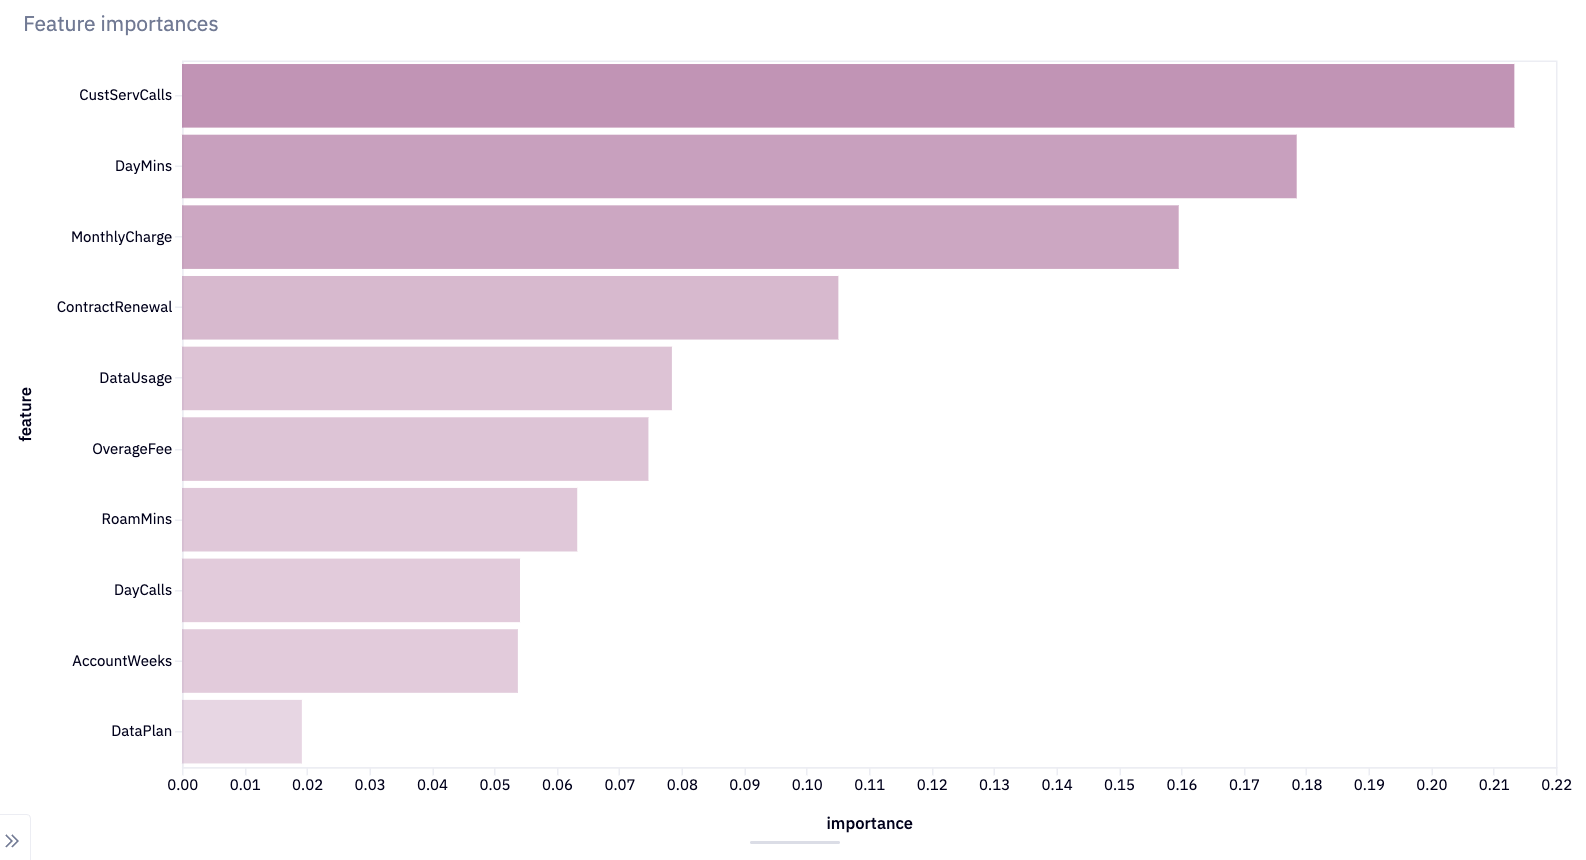
We can see that the “customer service calls,” “daytime calls,” and “monthly charge” are the most important features with predicting churn. At the other end, whether a customer has a data plan or not isn’t important in whether they churn.
Now we have a good idea of what impacts churn for our telecom customers. If we were just building a regular KPI dashboard, it might be enough to show this data to product managers and let them make decisions on how to affect these features. But here we want to go one step further and use this model to help predict churn.
Using Our Model to Predict Churn
If you look at the published Hex app and the logic that underpins it, you’ll notice something so far. None of this analysis is shown, neither are either of the visualizations. This is an important factor when creating KPI dashboards. Do you need to show your working or not? For ad-hoc analyses, or retrospective metrics dashboards, it can make sense to show how you got the data. For predictions and modeling, we rarely need to show the training.
Instead, we want our actual app to allow the user to use our trained data to predict customer churn depending on each of the features. To do that, we want to first give users the ability to interact with our model and input their own data. Within Hex, we can do that by adding input sliders that are mapped to variables within the notebook:
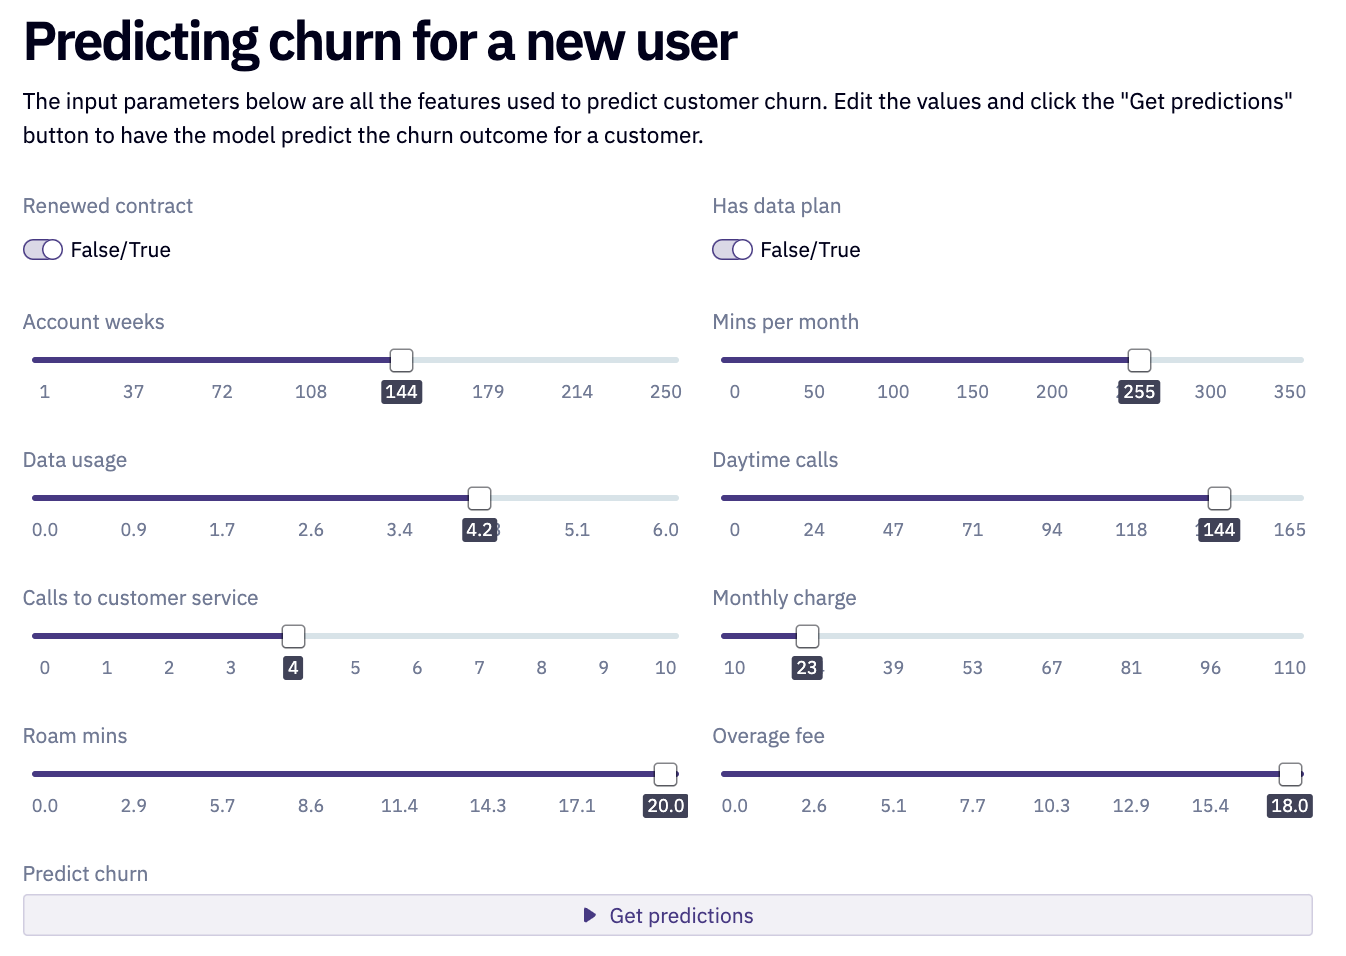
Behind the scenes, each of these inputs is used within this array to create a feature vector:
user_vector = np.array([
    account_weeks,
    1 if renewed_contract else 0,
    1 if has_data_plan else 0,
    data_usage,
    customer_service_calls,
    mins_per_month,
    daytime_calls,
    monthly_charge,
    overage_fee,
    roam_mins,
]).reshape(1,-1)

user_vector = scaler.transform(user_vector)
The feature vector is then transformed and scaled to ensure that the feature vector has the same scale as the data the model was trained on. This step is crucial because machine learning models can be sensitive to the scale of input features, and applying the same scaling as the training data ensures consistency and improves model performance.
The resulting user_vector can then be fed into a trained model to make predictions specific to this user. This is what happens when the user presses the “Get predictions” button. That calls this code:
value = model.predict(user_vector)[0]
prediction = 'churn' if value == 1 else 'not churn'
probability_of_prediction = np.round(max(model.predict_proba(user_vector)[0]) * 100, 4)
This trains our machine learning model to make a prediction about the user, predicting whether the user will churn or not. It also calculates the probability of this prediction. The prediction variable holds the categorical outcome ('churn' or 'not churn'), and probability_of_prediction provides the model's confidence in this prediction in percentage terms.
In the app, we can then use those variables within a markdown cell using jinja to dynamically add the prediction and probability_of_prediction to the text for the user.
{% if predict %}
#### The model is {{probability_of_prediction}}% confident that this user will {{prediction}}
{% else %}
#### No prediction has been made yet
{% endif %}
For the user, this looks like after they get their predictions:

Letting Users Learn More About the Data
Though we don’t have to show the end user all our analysis and training, we don’t want the data to be hidden from them. In this dashboard, we’re including a section on cluster analysis to let them see the important features in the dataset, so they can gain more insight into the customer and make good decisions.
The next part of our code is performing data processing, including inverse transforming scaled data, creating DataFrames, applying Principal Component Analysis (PCA) for dimensionality reduction, and then using K-Means clustering on the dataset. Let's break it down step-by-step:
# Perform the inverse transform on the scaled values to return the original values
dataset = scaler.inverse_transform(up[feature_names])

# create a dataframe out of the original values
dataset = pd.DataFrame(dataset, columns = feature_names)

# add the churn columns
dataset['Churn'] = up['Churn']

# ensures all values are integers and not floats
dataset['CustServCalls'] = dataset['CustServCalls'].apply(lambda row: np.ceil(row))

# create a new dataframe that contains the reduced features (2 columns)
pca = PCA(2)
reduced = pca.fit_transform(dataset)
reduced = pd.DataFrame(reduced, columns = ['component_1', 'component_2'])

# instantiate cluster model and fit on data
kmeans = KMeans(n_clusters=4, init='k-means++', max_iter=300, n_init=10, random_state=0)
kmeans.fit(dataset)
scaler.inverse_transform(up[feature_names]) reverses the scaling transformation applied to the data. This means converting the scaled data back to its original scale. The data being inverse transformed is up[feature_names], which is a subset of the up dataframe containing only the columns listed in feature_names.
The result, dataset, now holds the data in its original scale. pd.DataFrame(dataset, columns = feature_names) converts the dataset array back into a pandas DataFrame and assigns the original feature names (feature_names) to the columns.
The target variable 'Churn' column from the up dataframe is then added to the dataset.
We then need to perform dimensionality reduction with Principal Component Analysis. Principal Component Analysis (PCA) is a statistical technique used to reduce the dimensionality of a dataset while retaining most of the variation in the data by transforming the original variables into a new set of uncorrelated features called principal components.
Here, PCA is applied to the dataset to reduce its dimensionality. The PCA(2) indicates that the data is being reduced to 2 components.pca.fit_transform(dataset) applies PCA to the dataset and the result is stored in reduced. The reduced array is then converted into a DataFrame with two columns representing the two principal components.
Then we cluster this dataset with K-Means. K-Means is an unsupervised machine learning algorithm used for clustering, which partitions a dataset into $K$ distinct, non-overlapping subgroups (clusters) by minimizing the variance within each cluster and maximizing the variance between different clusters.
A K-Means clustering model is instantiated with 4 clusters (n_clusters=4), using 'k-means++' for initialization, and other specified parameters like max_iter (maximum number of iterations) and n_init (number of times the algorithm will be run with different centroid seeds). kmeans.fit(dataset) then fits this clustering model to the dataset. This means the K-Means algorithm is used to find cluster centers in the dataset, effectively grouping the data into 4 clusters.
We can then add the labeling and churn information to our datasets and visualize the clusters:
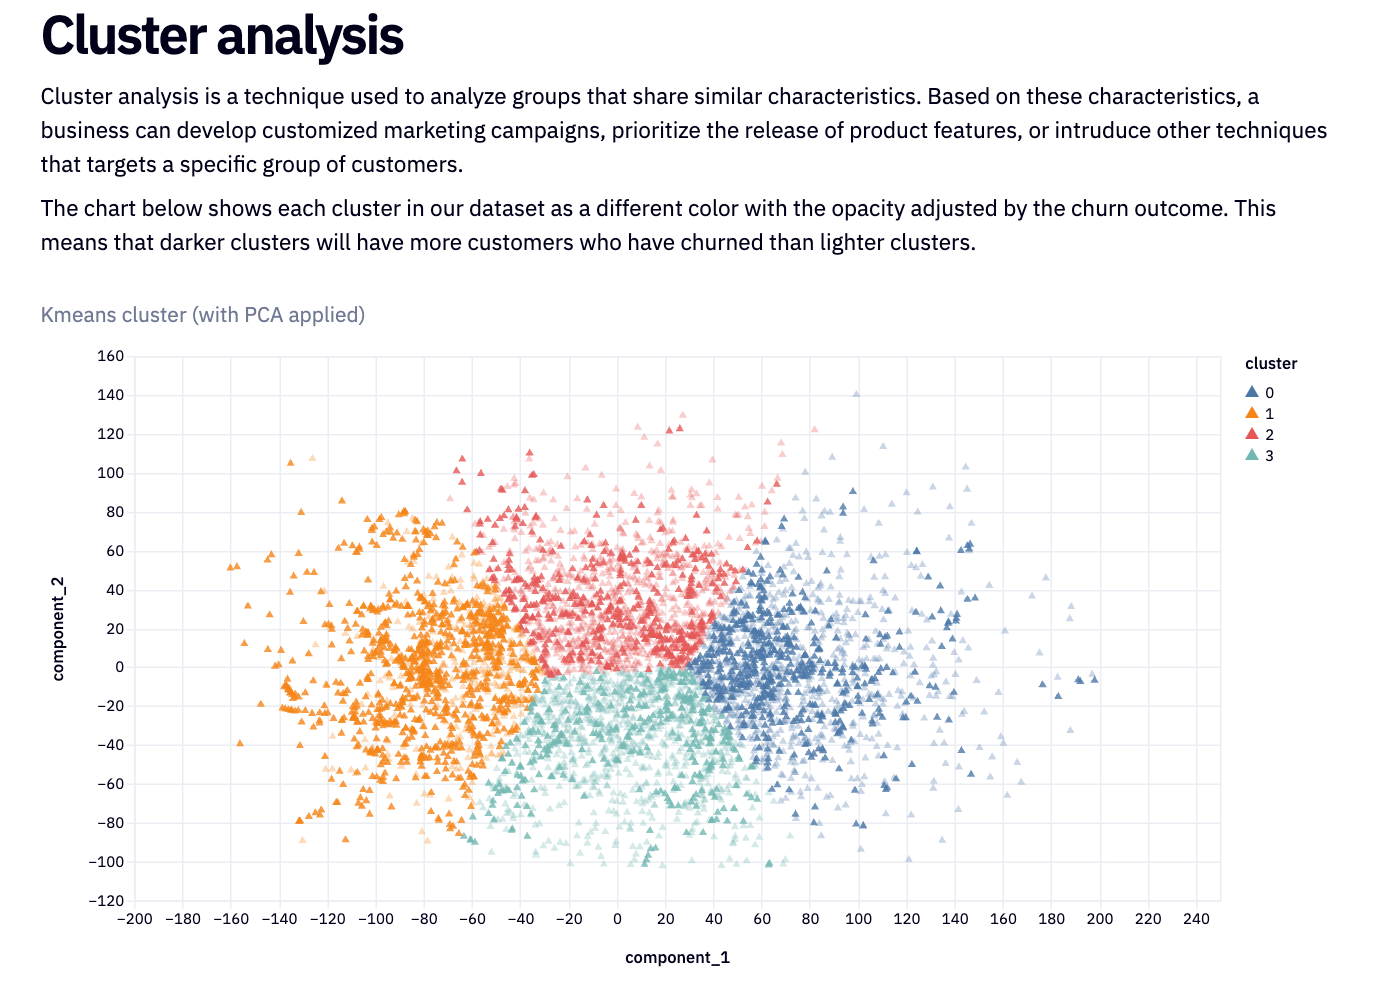
This visualization is shown on the published app, along with markdown text to explain to the reader what cluster analysis is and what the diagram shows. Without this explanation, a cluster plot can be confusing to the uninitiated.
Going back behind the scenes again, we want to start to understand the data behind these clusters. First, we create an SQL query that calculates the average churn rate for each cluster in a dataset and then orders the results by churn rate in descending order.
select cluster, avg(Churn) as churn_rate from dataset
group by 1
order by churn_rate desc
The SELECT clause selects two things:
- The
clustercolumn, which presumably contains identifiers for different clusters in your dataset. - The average value of the
Churncolumn for each cluster, named aschurn_rate. In this context,Churnis likely a binary column where 1 indicates a churn (loss of a customer) and 0 indicates no churn. The average of this column effectively calculates the churn rate for each cluster.
We then group by cluster (which is the first column in the dataset) and order the results by the churn_rate in descending order (desc). This means that clusters with higher churn rates will appear first in the query results.
We can then visualize this data:
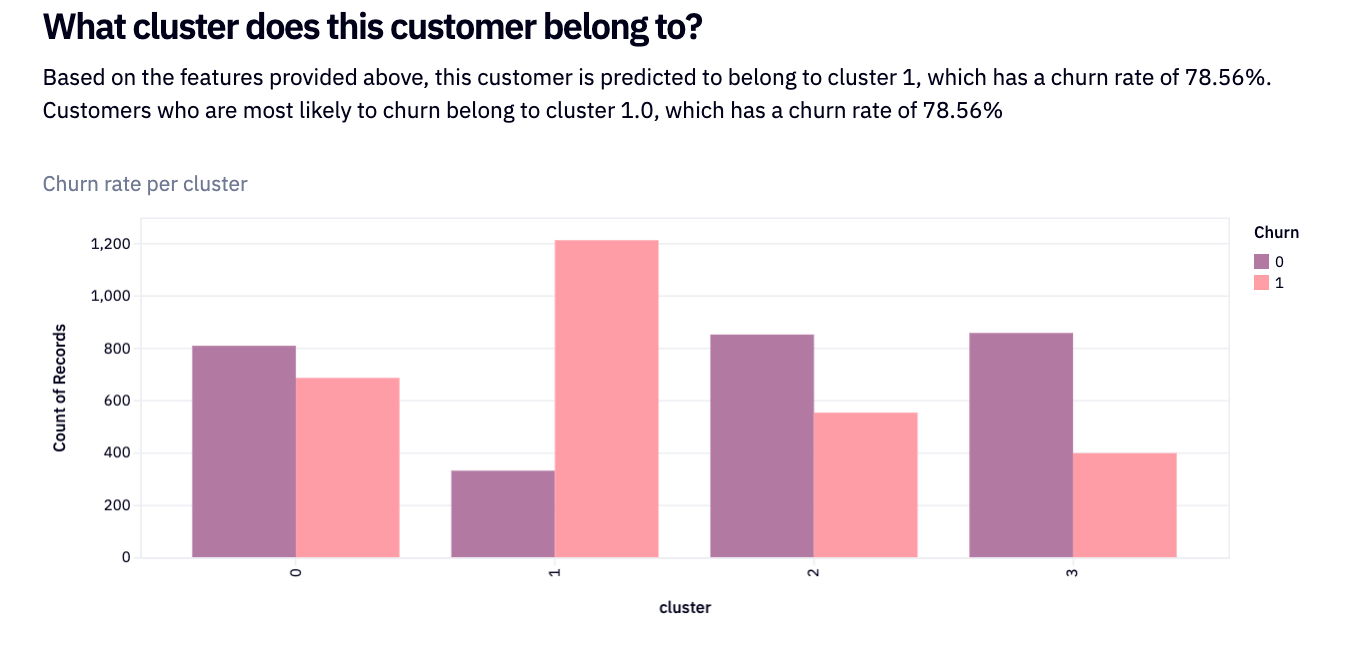
We then extract the churn rate for each of our four clusters and visualize with singe-value cells:
c1 = dataframe[dataframe['cluster'] == 0]['churn_rate'].values[0]
c2 = dataframe[dataframe['cluster'] == 1]['churn_rate'].values[0]
c3 = dataframe[dataframe['cluster'] == 2]['churn_rate'].values[0]
c4 = dataframe[dataframe['cluster'] == 3]['churn_rate'].values[0]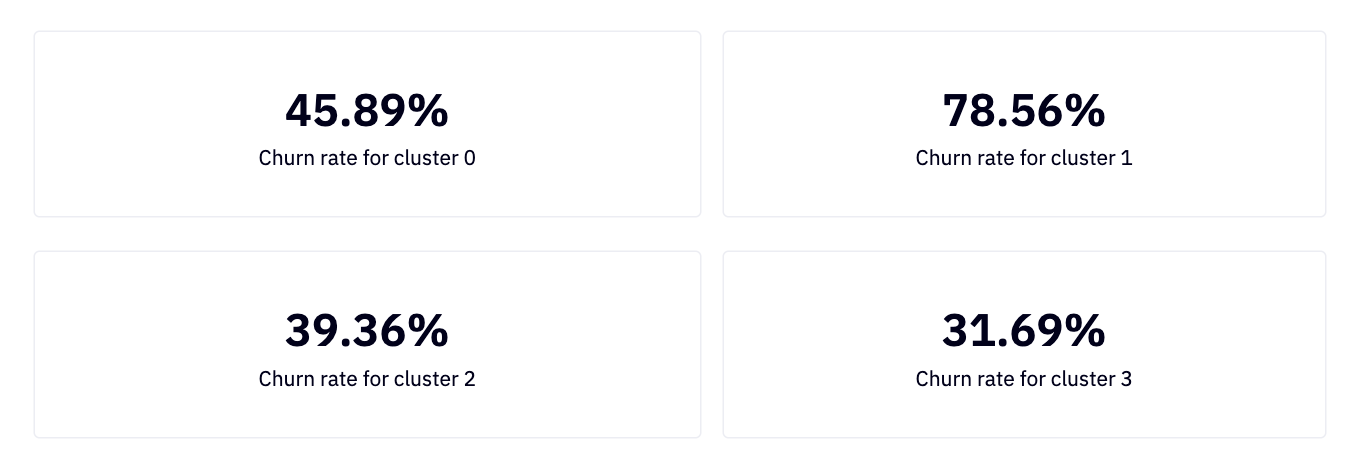
Show The Results, Not The Work
Building a model like this is a great example of how to build a KPI dashboard with a lot of underlying data analysis, but showing end users only what they need. As proud as you may be of your random forestry and k-means clustering, most people don’t care about the math, they care about the results.
That is because results bring insights. Giving them a clear dashboard like this, with added interactivity so they can manipulate how they wish, allows for greater insight, better decision making, and hopefully lower churn.
See what else Hex can do
Discover how other data scientists and analysts use Hex for everything from dashboards to deep dives.


Ready to get started?
You can use Hex in two ways: our centrally-hosted Hex Cloud stack, or a private single-tenant VPC.