Exploratory analysis and ad-hoc analysis sit at the core of insightful data work. This goes way beyond the confines of the Google definition for "Exploratory Data Analysis"; Far beyond just descriptive statistics, these are all the ad-hoc questions you dig into data to answer, the entire process of untangling a brand new dataset to figure out what's what, every working session that starts with "I wonder...". Every time you're answering a specific business question, analyzing individual user behavior, or investigating an unexpected trends in order volume— you're doing an ad-hoc or exploratory analysis. This isn't about pre-defined paths or rigid frameworks—it's about embracing those "I wonder..." moments and following them to their logical conclusion.Say you find yourself pondering why a certain product's sales suddenly plummeted, or you're curious about the patterns in an individual user's activity on your platform, or maybe you're just surprised by an unexpected spike in website traffic. That's where exploratory and ad-hoc analysis come into play. Each question leads you on another branch of exploration, opening doors to fresh insights and perspectives.
Importantly, once you've:
Formulated specific questions or identified areas that call for a deeper dive
Identified and curated the relevant data
Gone on your analytical adventure, mapped out all the correlations, hunted down the anomalies, and pieced together the puzzle
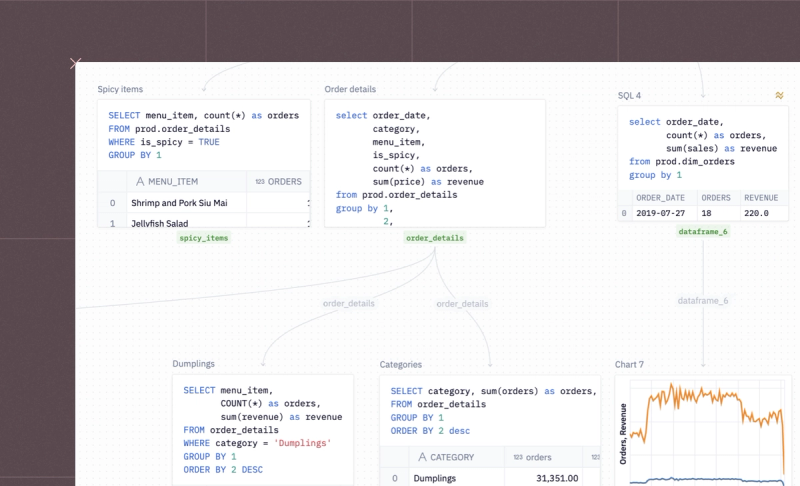
You have to do the most important part: Transform the raw data you've discovered into an engaging narrative that you can show to stakeholders and use to drive informed decisions.The exploratory journey might usually start with a simple question, but it often ends with a rich tapestry of insights that weave together threads across user behavior, business strategy, and more. On this page, you'll find interactive examples demonstrating typical scenarios of exploratory and ad-hoc analysis. If you see something interesting, click "Get a copy" to dive deeper and adapt any example to your requirements.
See what else Hex can do
Discover how other data scientists and analysts use Hex for everything from dashboards to deep dives.
What's an example of a typical scenario where I might use exploratory and ad-hoc analysis?
A typical scenario might involve investigating a sudden decrease in product sales. Through exploratory and ad-hoc analysis, you could delve into the data to understand possible reasons behind this decrease—be it pricing, competition, marketing effectiveness, or a change in consumer behavior.
What tools or skills are necessary for effective exploratory and ad-hoc analysis?
Tools for exploratory and ad-hoc analysis range from spreadsheets to advanced data analysis software. Skills required include a basic understanding of statistics, a knack for asking insightful questions, and the ability to weave data findings into compelling narratives. Knowledge of data visualization techniques is also highly beneficial.
How does exploratory analysis differ from confirmatory analysis?
While exploratory analysis is about uncovering trends, patterns, and relationships without a pre-defined hypothesis, confirmatory analysis tests specific hypotheses derived from theories or observations. The two approaches are complementary, with exploratory analysis often informing the hypotheses for confirmatory analysis.
What kind of data can I use for exploratory and ad-hoc analysis?
You can use any type of data for exploratory and ad-hoc analysis, including structured data (like databases or spreadsheets), semi-structured data (like JSON files or XML documents), and unstructured data (like text or images). The choice depends on your question and what data you have available.
What role does visualization play in exploratory and ad-hoc analysis?
Visualization plays a vital role in exploratory and ad-hoc analysis, as it helps to understand patterns, trends, and relationships in the data. Graphs, charts, and other visual elements can make complex data more comprehensible, enabling faster and more effective analysis.
How does exploratory and ad-hoc analysis fit into the overall data analysis workflow?
These types of analysis often form the initial stage of the data analysis workflow, providing direction for further investigation. After exploratory and ad-hoc analysis, you might proceed to more formal analysis or modeling, using insights gathered to inform your approach.
Can exploratory and ad-hoc analysis help in predictive modeling?
Yes, they can help identify key variables and relationships that could inform predictive models. For instance, if exploratory analysis reveals a strong correlation between two variables, that relationship might be used in forecasting future trends.
How do I handle 'noisy' or messy data in exploratory and ad-hoc analysis?
Handling 'noisy' data often involves data cleaning and preprocessing steps, such as dealing with missing values, outliers, or inaccuracies. This can be a time-consuming but essential part of the exploratory process, ensuring the reliability of your insights.
What is exploratory factor analysis?
Exploratory factor analysis (EFA) is a statistical technique used to identify the underlying relationships between measured variables. It's commonly used when you have a large set of observed variables and you want to understand the latent factors that cause these variables to covary.
How do you perform exploratory data analysis in Python?
In Python, libraries like Pandas, NumPy, Matplotlib, and Seaborn facilitate exploratory data analysis (EDA). These tasks usually involve reading the data (Pandas), cleaning and preprocessing the data (Pandas and NumPy), summarizing the data (Pandas), and creating visualizations (Matplotlib and Seaborn) to understand underlying patterns, trends, and outliers.
Why do we perform exploratory data analysis?
We perform exploratory data analysis to understand the main characteristics of our data, detect outliers or anomalies, uncover patterns, identify relationships among variables, and formulate hypotheses for further analysis. EDA helps us to make informed decisions and provides a solid foundation for the subsequent stages of the data analysis process.
What four statistical techniques are used in exploratory data analysis?
Some common statistical techniques used in EDA include: Descriptive Statistics (mean, median, mode, standard deviation, etc.) for understanding basic features of the data; Data Visualization (boxplots, histograms, scatter plots, etc.) to see patterns and relationships visually; Correlation Analysis to understand the relationships between variables; and Hypothesis Testing to check assumptions or compare groups in your data.
What is the role of exploratory graphs in data analysis?
Exploratory graphs play a critical role in data analysis by allowing us to visually inspect the data. They help in identifying patterns, relationships, trends, and outliers, which might not be apparent from raw data. Graphical representation of data aids in understanding complex data sets, communicating findings, and supporting decision-making processes.
What is the difference between a hypothesis-testing and an exploratory functional analysis?
Hypothesis-testing analysis is a confirmatory process where specific hypotheses, formulated before the analysis, are tested. It involves statistical tests to determine if there is enough evidence to reject the null hypothesis. On the other hand, exploratory functional analysis is a more open-ended process, often carried out when we don't have a clear hypothesis. It's used to discover patterns, relationships, or trends in the data, which can inform subsequent hypothesis formulation.