Today, we’re introducing a new version of Hex, and buckle up, because this release has everything. Cutting-edge AI features? Check. Big foundational re-writes? You bet. Shiny new design? Of course! It’s a whole version number – what’d you expect??
Hex is a collaborative workspace for analytics and data science. It has a powerful notebook UI that lets you mix no-code, SQL, and Python, and makes it easy to turn the result into an interactive data app anyone can use. It's built to let you go from quick question to shared insight, super fast.
3.0’s new features take this further. It’s full of big ideas and little details, based on feedback from the thousands of people who rely on Hex every day, on data-driven teams at companies like Notion, Brex, and Algolia. We’ve doubled down on what users love today, while unlocking entirely new possibilities for how teams work and share.
Ok, enough of my preamble – let’s jump in!
🪄 Hex Magic: AI, meet analytics
Earlier this year we launched Hex’s Magic tools, bringing the power of LLMs directly into our powerful, integrated workspace. The goal here wasn’t to build an “AI data analyst” – it was helping human data analysts do better work with AI.
Now, thousands of people are relying on our Magic features to write queries, draft scripts, and – most crucially – nail regex. And today, we’re introducing 3 new features that bring data further to the future:
Magic Charts
The name says it all! Type a prompt, get a chart.
And – because this is built into Hex’s existing chart cell instead of generating Python chart code, you automatically get all the goodies: visual filtering, drilling, and massive data scale.
Magic Analysis
Hex can now kickstart a whole analysis for you. Enter a prompt, and Magic Analysis returns chains of cells – including queries, explanation, and visualization. Hex’s notebook format really shines here, combining the best of a chat UI with a powerful, functional editing experience.
Magic Analysis is in private beta today, and will be rolling out to everyone in the coming weeks.
Improving AI accuracy with our new metadata engine
LLMs aren’t literally people, but they do have some things in common, including that they reason better when you give them more context. In the case of data workflows, the big thing is providing rich metadata on the schemas of the tables you’re querying.
Over the last few months, we have made some big upgrades to our metadata engine, including:
Semantic retrieval: we’ll share details in a future post, but the tl;dr is that it’s really cool, and makes things faster and more accurate.
dbt Docs: if you’re using dbt Cloud, all you have to do is update the metadata in your models, and it’ll automatically flow into Hex and be used to help inform query generation.
Support for warehouse metadata: ditto if you update information about your columns and tables in Snowflake, BigQuery, or Redshift.
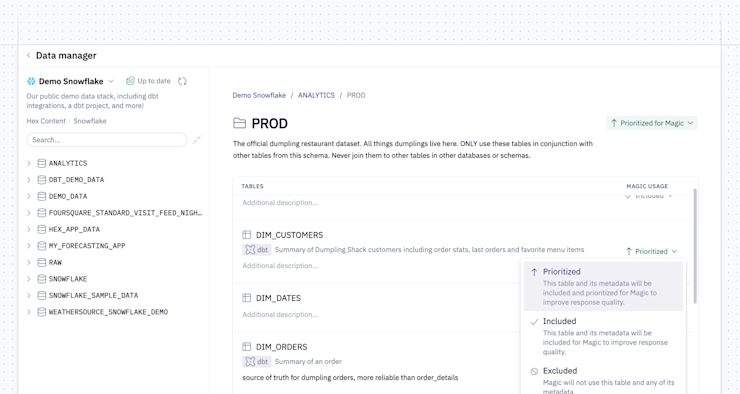
In addition to integrations with third party metadata sources, we’re also introducing an all-new Data Manager in Hex. It lets you view the information pulled from other systems – and add more, including descriptions and the ability to “promote” or “exclude” schemas and tables for use in Magic responses.

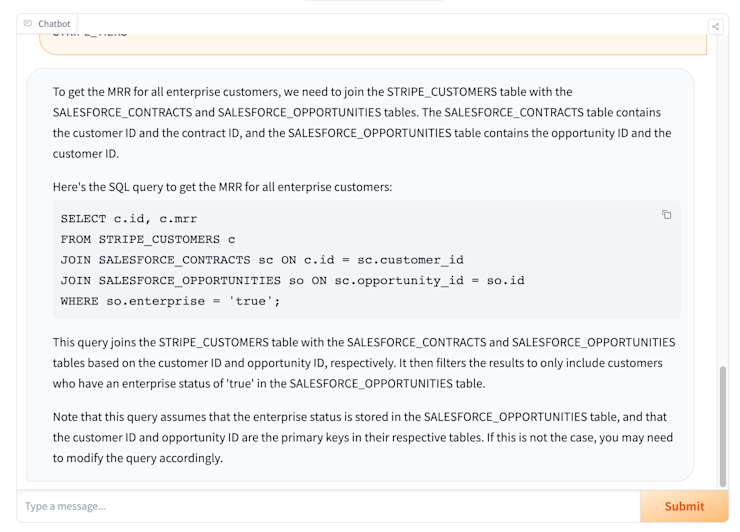
This metadata work happens mostly behind the scenes, but it has a massive impact on the accuracy of AI completions. Here’s a real world example of two AI generated SQL queries using our actual company warehouse.
This first query from an unnamed state-of-the-art LLM looks plausible, but it’s wrong. It uses raw Stripe and Salesforce tables, but we use dbt to model these into a dim_customers table with everything we need — but you can’t filter on enterprise = 'true' like that! These are the most pernicious kinds of LLM issues: the ones that look and feel right, but fail – or worse – return inaccurate results.

After adding some information to the Data Manager, the same prompt in Hex returns an accurate query, referencing the correct tables and filtering on the is_ela_plan field.
📈 All-new app builder: the easiest way to share data work
When we started the company, I identified as a Data Practitioner – the kind of person who builds the analyses and shares them with others.
Along the way, however, I have somehow metamorphosed to a Stakeholder – the kind of person who other people build and share analyses for.
Hex is built to bridge the gap between these versions of me. The App Builder makes it easy to take insights and turn them into beautiful, interactive experiences – whether it’s a simple report, interactive dashboard, or complex data app. And today we have some awesome new features that makes that better than ever.
Build, drag, and drop – right from the layout view
First up: the App Builder is now a full-fledged editing UI. You can add new elements directly from here, drag and drop and resize with more fidelity and even – yes! finally! – edit text directly in-line. In fact, you can build whole projects without ever needing to go to the notebook (but it’s there, patiently waiting, if you want it).
Powerful filtering
The most common thing us Stakeholders want to do with a published app is filter down data –and that’s easier than ever.
First, we have a new feature called Shared Filters, which, uh, lets you make shared filters. Just multi-select and Hex will intelligently guess which columns you want to use.
We also built filtering for Viewers – even if Editors haven’t configured them. I personally love this because I don’t have to go round trip and one (or bother the data team) – it Just Works.
Introducing View and Explore!
What does everyone want to do after they Filter? Drill, baby, drill!
Users of Hex apps can drill into the underlying data backing any chart by clicking ‘View data’:
Or use Explore to jump into a powerful data exploration interface where they can further slice & dice data, and remix visualizations:
The common theme across Filters, View, and Explore is one of end user empowerment without extra expenditure of editor effort (every editor endeavors to evade excessive effort!). The point is, all of these features work automatically, on every chart in every app, with little to no configuration required.
⚡ New compute engine: faster performance, and higher scale
An all-new, parallel compute engine
Hex has the world’s best notebooks – but it’s not just about the sexy surface-level features like magic AI or real-time collaboration. Under the hood, we have a powerful compute engine that models the execution as a graph, fixing a lot of the legacy problems with notebook kernel state (this was actually the big deal in Hex 2.0!) This makes Hex more reproducible, performant, and interpretable.
Today, we’re taking that even further, introducing parallel execution. Now, complex projects – especially those with lots of expensive queries! – can execute cells at the same time, versus one waiting on the other. It’s a night-and-day difference, especially in published apps, and it’s going to save you and your stakeholders a lot of time and 🤬.
Here’s a side-by-side comparison of the same app’s graph running with and without parallel execution enabled. It’s a little tough to see, but if you watch a few loops, you’ll notice the parallel graph executes all the branches of the graph at the same time, filling the entire page up with green completions while the old version is still focusing on one specific branch.
This is live today for warehouse SQL queries, and will be rolling out to more cell types soon.
Native Python dataframe pushdown with Snowflake, Databricks, and BigQuery
The other side of the compute coin is scale – being able to work with super large datasets. You can choose a bigger Compute Profile in Hex, but that brute force approach only gets you so far.
Meanwhile, most organizations have adopted modern, cloud-based data infrastructure like Snowflake, Databricks, and BigQuery. While you’ve always been able to push SQL down to these powerful compute backends, Python has been trickier, requiring a lot of manual gymnastics and hand-rolled connections.
Well, we’re fixing that, and now it’s just as easy to push Python! This means you can run massive data workflows and ML pipelines in Hex, using the leading cloud data infrastructure solutions, as seamlessly as if they were local dataframes.
We’ll be sharing more about this soon!
💅 And, a new coat of paint
Wow this post is getting long! One last thing, I promise. We did a whole visual overhaul of our design system, with an eye toward making it cleaner, simpler, and less cluttered (but no less powerful!) We’ve been using it internally for a few weeks – it’s a little adjustment, but then feels super natural. Enjoy!