Blog
Hex 2.0: Reactivity, Graphs, and a little bit of Magic
Announcing a new, ✨ magic ✨ way to work with notebooks and build data apps
tl;dr
Today we’re announcing Hex 2.0, powered by an all-new, reactive compute engine. Projects can now be executed and visualized as DAGs, with each cell re-running based on upstream dependencies, creating major benefits for reproducibility, performance, and interpretability.
It’s a powerful, ✨ magical ✨ way to work with notebooks and build data apps, and we hope you love it as much as we do.
Ah, notebooks
In 1984, Donald Knuth introduced the concept of "literate programming", a way of developing that mixes code, explanation, and outputs together in a way that's meant to be more interpretable by humans.
In 2021, computational notebooks like Jupyter are a staple of data workflows, and the most widely-used implementation of Knuth's concept in practice. By combining code and outputs into an interactive, REPL-like environment, computational notebooks make it easy to iterate on chunks of data analysis and visualization logic.
And yet, anyone who has actually used one (or spent time on Data Twitter™) knows that notebooks have many issues.
Current state: ?
The notebook compute and state model is a massive source of frustration, especially for beginners. This angst is most infamously documented by Joel Grus's "I don't like notebooks" talk at JupyterCon (video, slides).
The issue, in short: notebooks are backed by a kernel, i.e., an in-memory process with mutable state. The commands run in each cell of a notebook modify that state, such as creating or reassigning a variable. You can run anything in a cell, and execute those cells in any order, meaning that the current kernel state can be difficult to reason about and reproduce.
Check out this basic example: quick, what’s the current value of x?
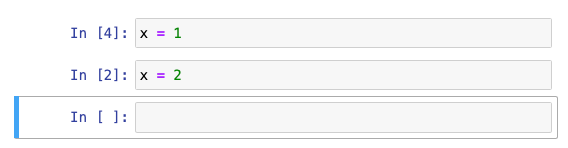
At first you might think 2, given it's the last cell. But you're a grizzled Notebook Veteran, so you look to the [execution order numbers] and see that the first cell was run most recently, and reason that it's actually 1. Ok, let's check:
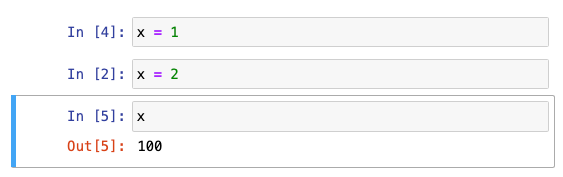
Oops, turns out the correct answer is 100, because the cell 1 was edited after it was previously run with x = 100. Better luck next time!
This is a really simple example, but as projects grow more complex, it’s very easy to tie yourself in awful state knots. You run a few cells out of order to test some things, or avoid running an expensive chunk of logic, and suddenly you’re seeing weird, inconsistent outputs. There isn’t a great solution to this, other than building up a complex state map in your head, or frequently restarting your kernel and running everything from scratch.
This causes three major issues:
- Interpretability: it’s hard to reason about what’s happening in a notebook, whether it's your own or someone else’s.
- Reproducibility: because cells can be run in any arbitrary order, reproducing a current state can be difficult without frequently re-running all the logic from scratch.
- Performance: re-running everything from scratch can be wasteful and time-consuming. This is true for any notebook, but unfortunately it's especially painful in Hex: published Data Apps run all of their logic top to bottom every time, explicitly to avoid weird state issues. While elegant, this has obvious performance implications if cells contain expensive logic like a query or model re-compute.
Another barrier to entry
If you have been using notebooks for a long time, you're used to this state-related pain, and probably have some workarounds (or a built-up tolerance).
But for folks who are newer to Analytics, the kernel model is frustrating and intimidating and creates yet another barrier to entry for technical workflows. Instead of empowering newer users with a smooth learning curve, notebooks can actually get in the way, and scare them off before they can really get going.
The state and reproducibility issues are bad enough that some folks conflate them with a failing of Python, and say analytics should be SQL-only. While we love SQL, we also believe that analytics should be flexible and polyglot. Whether you want or need SQL or Python or a visual tool for any task shouldn’t really matter - it should just be way easier to build reproducible, interpretable analytic projects. But the legacy state model of notebooks makes that tough.
So, in this sense, we actually agree with Joel Grus: the current state of, well, state for notebooks really is broken.

Enter Reactivity and DAGs
Reactive programming is an old concept. The basic gist is that a change in one component will trigger changes in another. For example, if you had x = y + 1 and y changed, the state of x would automatically update as well.
This is intuitive to most folks working with data because of - you guessed it! - spreadsheets. Excel is not only the most frequently-used data tool in the world, it’s also reactive. Each cell in a spreadsheet can have dependencies on others, and automatically re-computes when they update. You can visualize these links in Excel using the “Trace Dependencies / Precedents” features:
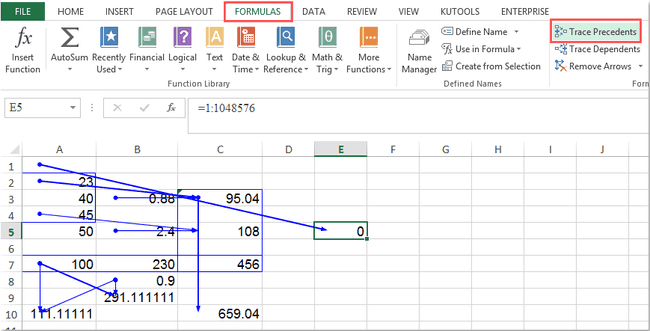
This visualization makes clear that you could consider a spreadsheet as a graph, with each cell as a node and references creating edges. 1 Among TLA (Three Letter Acronym) lovers, this model is often referred to as a DAG (Directed Acyclic Graph).

DAGs have gained a lot of popularity at the ELT and orchestration layer. Airflow, Dagster, and dbt are all very popular products built on the concept of a DAG. Here's an example data lineage graph from a dbt DAG (now in the IDE!), where each node is a specific transformation:
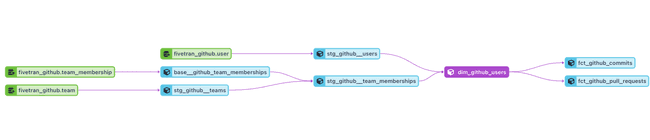
Representing data flows in this way makes a ton of sense. It is very clear what depends on what, you can easily debug your code, and there is no confusion over things being run out of order. Thus, DAGs - and Reactive programming models generally - do not suffer from the state issues that plague notebooks.
Bringing it all together: Reactivity in Hex
We have been thinking about state, DAGs, notebooks, and reactivity since very early on, and today are introducing Hex 2.0, built around an all-new, reactive, graph-based compute model.
Hex now analyzes the code in each cell and automatically infers dependency relationships. While you can still edit in a linear notebook UI, behind the scenes the project is modeled as a DAG, and can be visualized as such in the new Graph view:
In Auto Run mode, updates to a cell will trigger only the dependent downstream logic, completely avoiding all 3 of the issues we discussed above:
- Interpretability: it's easy to see how cells relate to each other, and how re-computes flow through the project. The Graph UI is a visual "mind map" of the complexity you'd previously have to keep track of in your head.
- Reproducibility: Hex projects are reproducible by default, in that a given change will trigger a predictable, consistent set of re-computes through the graph.
- Performance: in logic development, but especially in published Apps, this new DAG model is a massive leap forward. Input parameters will only trigger downstream, dependent logic, without any additional overhead or complexity.
Behind the scenes, Hex's compute engine is analyzing the Python and SQL code in real-time to infer relationships. 2 Each cell will show which variables it's returning, and indicate which downstream cells they're being used in.
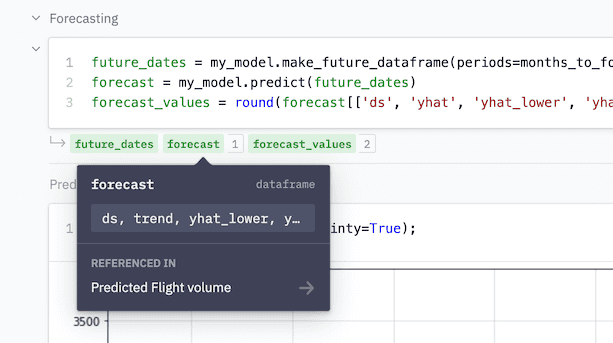
Reactivity in Hex feels especially great with Dataframe SQL: you can set up chains of SQL or Python cells depending on each other, and only the necessary downstream logic is re-executed while iterating or running an app.
The future of notebooks isn't just about notebooks
The literate programming paradigm - a mixing of code and outputs - isn't going anywhere. Notebooks are popular for a reason! For them to become more useful, reliable, and performant for everyone, however, they need to evolve beyond the broken models of today.
At Hex, we have always considered the notebook UI - and the legacy state model - as just one way to think about building data projects and apps. With Hex 2.0's new compute engine, we’re exploring a way toward a new future for literate programming and a more accessible, scalable future for analytics.
- ↩ To go much deeper on graph-based spreadsheet recompute algorithms, check out this sublime, burrito-centric piece by lord.
- ↩ This also eliminates the need for the old
$variablesyntax anywhere in Hex! RIP 🪦