Blog
The case for warehouse-based product analytics
Product analytics on top of warehouse allows for deeper insights into activation, retention, and churn.

Traditional analytics tools reward surface-level wins — "shipped features", retained users, growth charts. But what if that’s just the tip of the iceberg? For product and data teams, uncovering why users behave a certain way post-launch requires more than event-based dashboards — it demands flexible, exploratory analysis that reveals what’s really happening under the surface.
Shipping features is the means, not the end.
The problem is, there’s not always a clear line between a specific feature you’re working on and product-level KPIs like user growth, retention, or monetization. So it’s best to start a little further upstream by understanding who’s using your feature and whether they like it.
In their Reforge course on Product Strategy, Casey Winters and Fareed Mosavat propose a framework for evaluating feature success that combines 3 key metrics:
- Adoption - % of target users who try the feature
- Retention - % of feature adopters who continue using the feature
- Satisfaction - degree of happiness with the feature among retained feature users
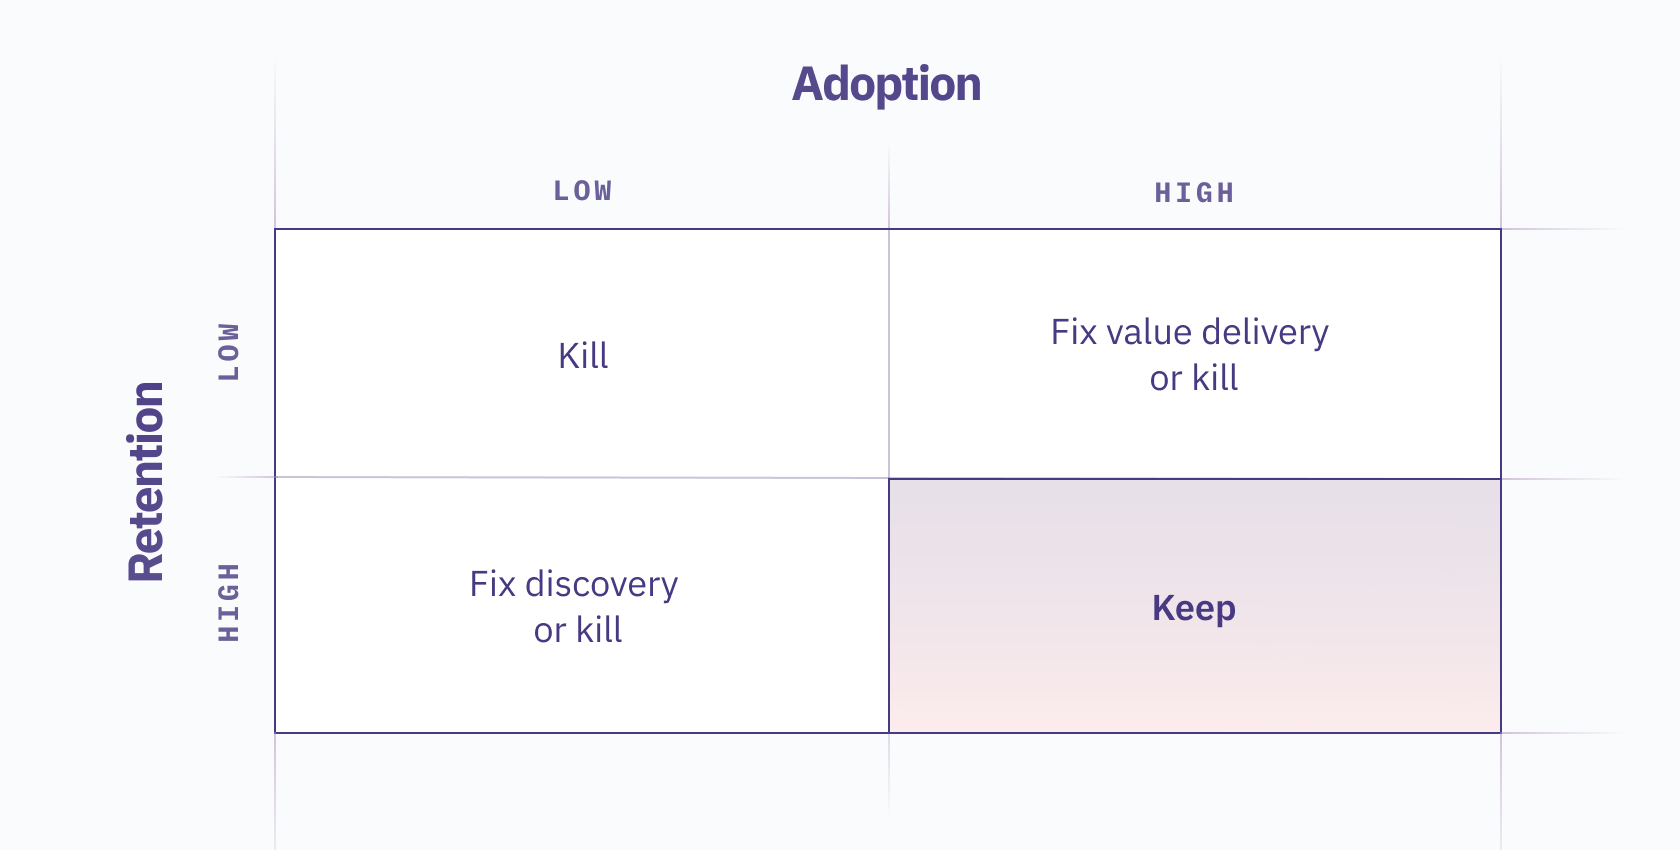
Together, these metrics can tell us how much value our feature delivers to users. A feature with strong performance across the board is a keeper, while a feature struggling in one or two needs to be either optimized or killed. It’s helpful to look at adoption and retention first, then layer in satisfaction insights to sanity check anything in the “keep” quadrant:
Great, so now we have a framework for understanding feature success…. But how might we actually implement and measure in practice?
Out-of-the-box product analytics tools can’t tell you if your feature is successful.
Let me start by saying that I love out-of-the-box analytics. The faster I can get directional insights to (in)validate a hunch and inform a product decision, the better. But traditional product analytics tools aren’t really cut out for evaluating features post-launch.
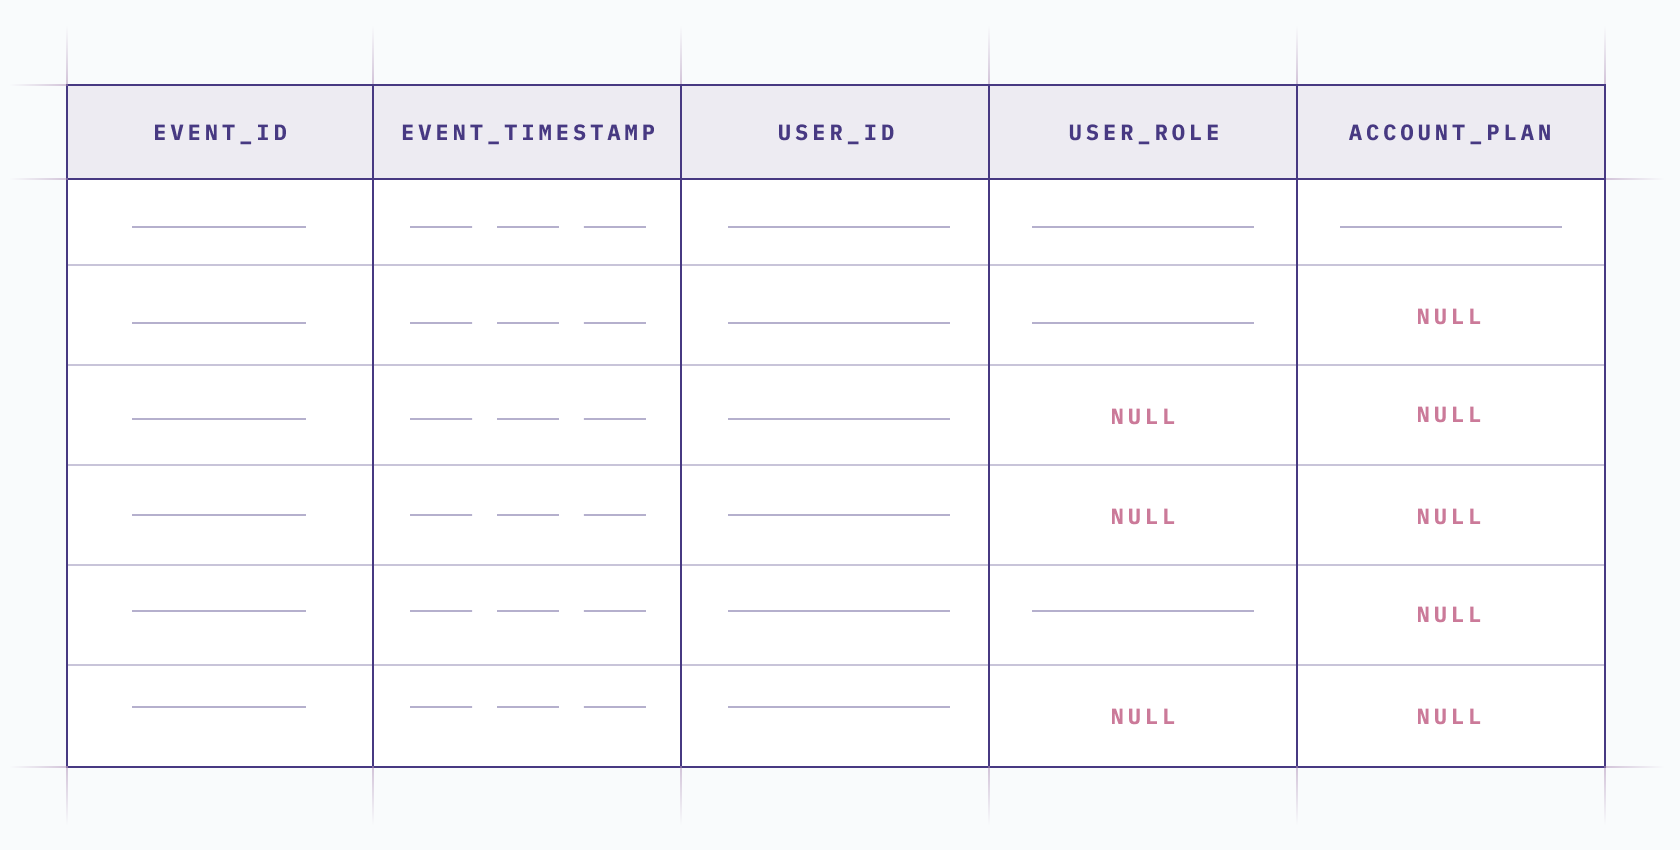
The main problem is that these tools are built on event data. Event data is immutable (i.e. it logs the data at the time an action occurred, rather than updating dynamically). It’s also notoriously difficult to maintain, which means even if you instrumented all the properties you need to evaluate feature success, chances are there will be gaps in the data. And it’s not exactly straightforward to correct or enrich event data when it’s trapped in a product analytics tool.
What does this mean for evaluating feature success? Let’s take it back to our framework: Of the three success metrics (adoption, retention, satisfaction), only one can be easily assessed with event data alone, and that’s retention. Products like Amplitude and Mixpanel are great at retention. Just grab an event that represents usage and slap it in a retention chart. Easy!
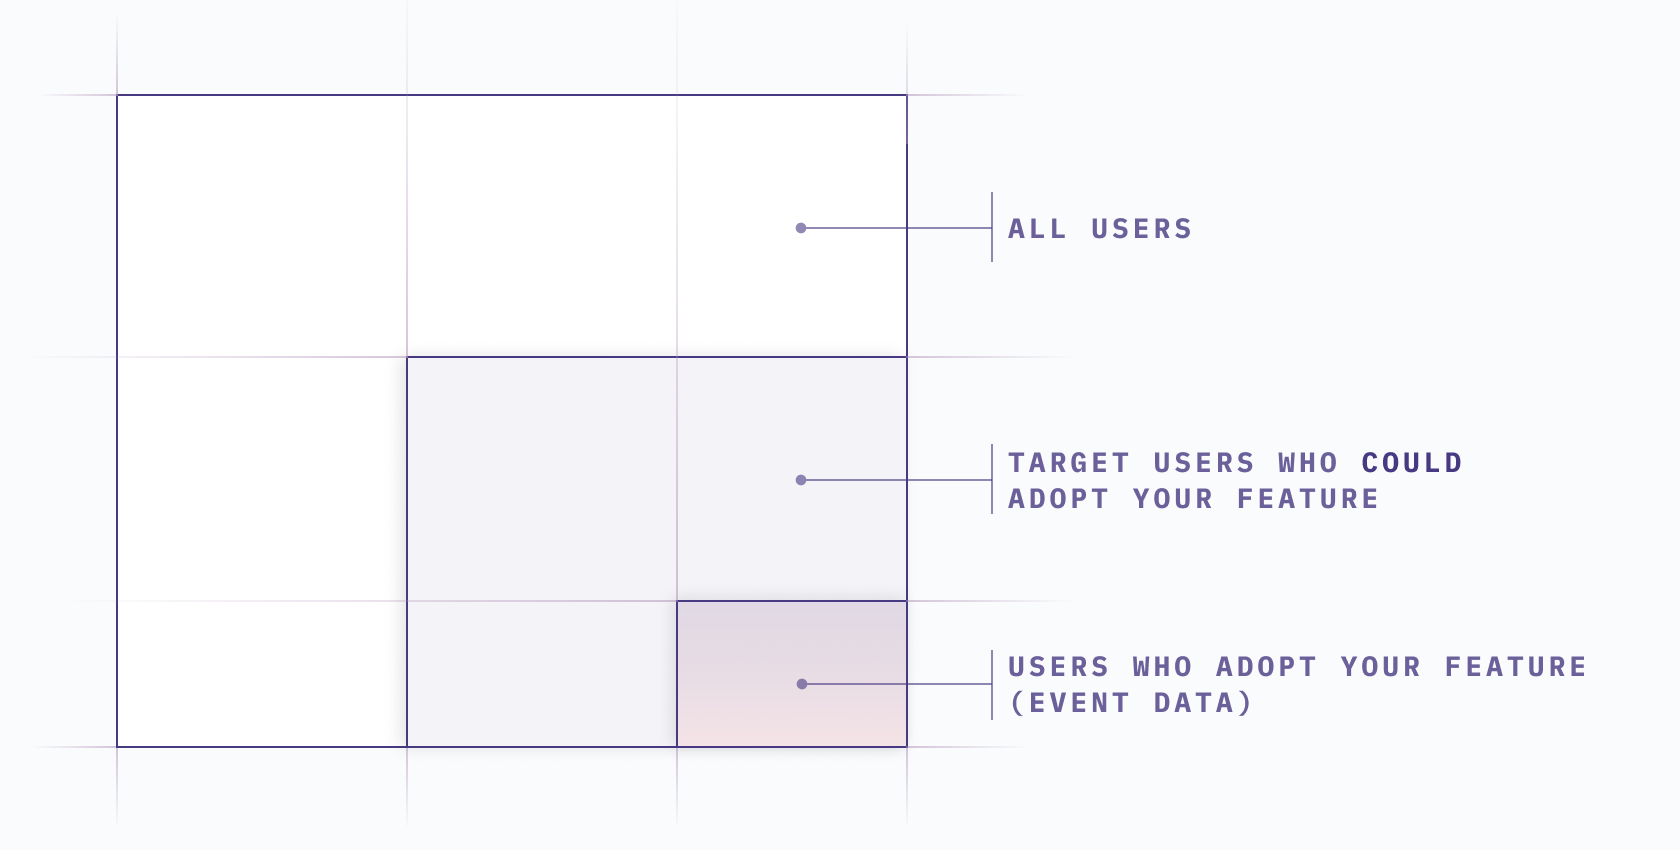
Alas, if only adoption were that simple. Event-based analytics tools really fall short when it comes to measuring adoption. That’s because adoption isn’t about how many users try your feature; it’s about the percent of target users who try your feature.
To identify target users, you need to know things like their user role and the pricing plan their account is subscribed to. And you need to be able to measure that initial pool of target users, even if they didn’t fire any track events for the feature you’re evaluating.
Maybe you belong to one of those mythical organizations that instrumented tracking events perfectly from the get-go. In that case, you might be able to hack together an adoption funnel in an event-based product analytics tool. That’s assuming you thought to instrument a User Updated event with all the right user-level and account-level audience criteria captured as event properties (user_role, pricing_tier, etc.), that you can use for your adoption denominator. But the rest of us mere mortals are better off using warehouse-based analytics so that we can correct and enrich event data with the attributes we need.
Similarly, feature satisfaction lives outside the realm of product analytics tools too. The idea is to assess how happy users are with your feature, and retention alone isn’t a sufficient metric.
If a repeat user is constantly battling kludgy UX, your retention metric could be hiding a ticking churn bomb. The best way to quantify feature satisfaction is with an NPS-style survey, sent to a randomized subset of repeat feature users. But, of course, this type of data isn’t typically ingested or displayed in an event-based product analytics tool.
To tell the complete story about feature success, centralize data sources in your warehouse
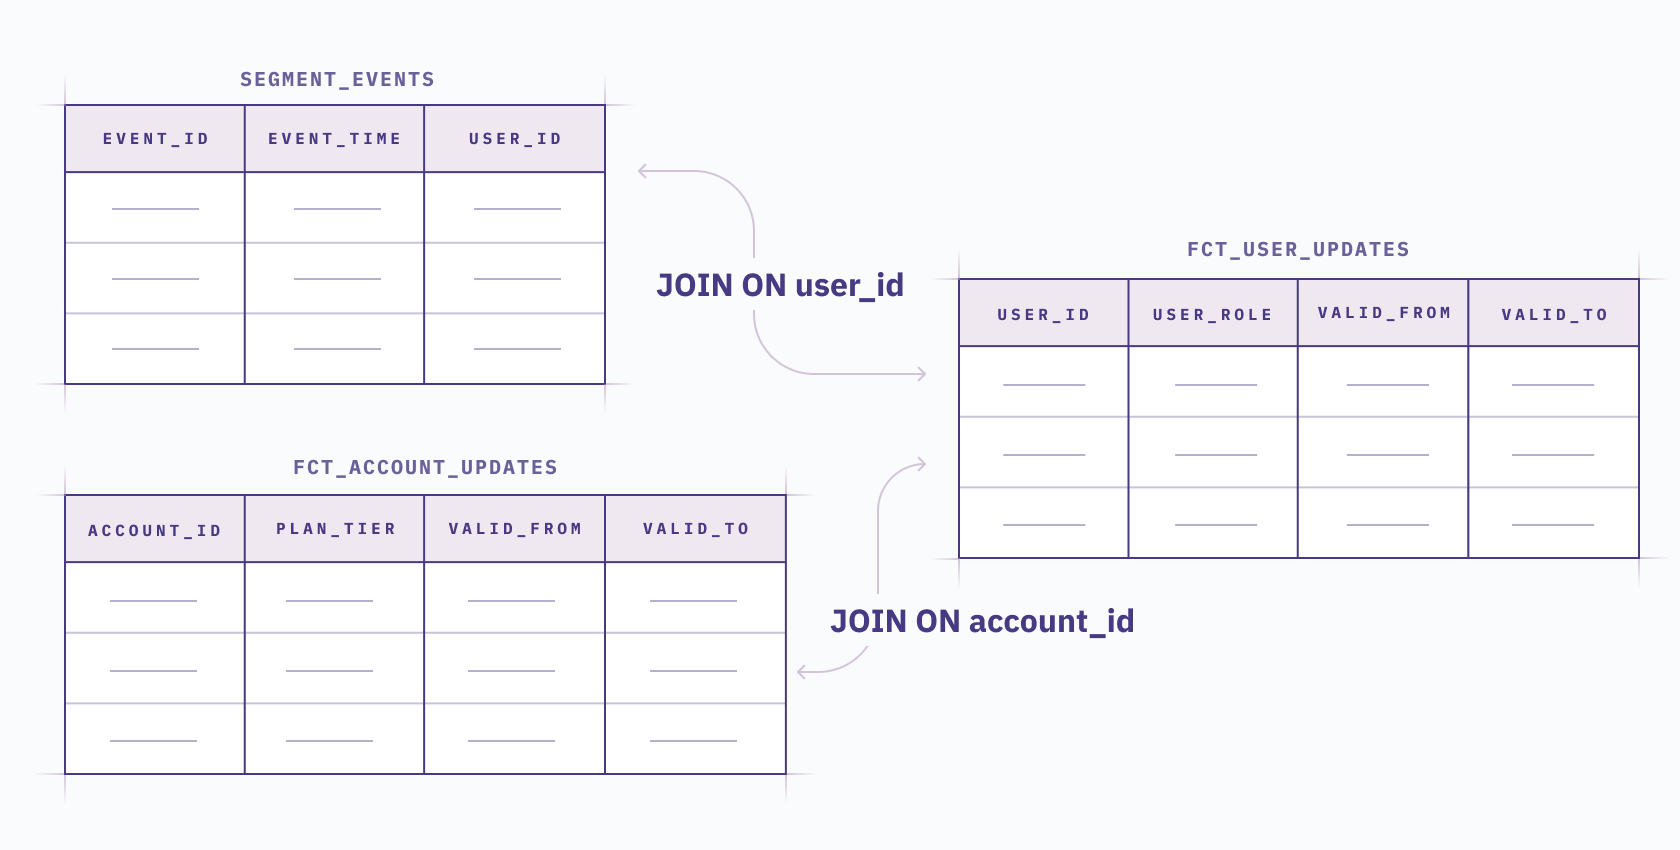
The best way to paint the full picture is to centralize all the data sources you need in your warehouse. This gives you a chance to clean and correct any rogue event data, and enrich it with context like users’ role, pricing tier or subscription status during a given time period. You can even bring in user survey data, or customer support ticket snippets to add color about user satisfaction.
The upfront costs of this approach (namely, modeling the data in the warehouse) are well-offset by the your newfound ability to get a clear read on feature adoption, and to combine feature success insights into one comprehensive report.
There are plenty of ways to reduce rework too. For example, once the base data is modeled, you can use a tool like Hex to build a single extensible feature success dashboard that stakeholders can update (without any code) to narrow in on the feature they’re most interested in. This can be accomplished by adding input parameters with parameterized SQL, which enables users to slice the data however they need. You can make sure teams are getting the full narrative and taking decisive action on the insights with text cells, Slack notifications, and commenting.
Regardless of what analytics tools you choose, find a way to reliably measure feature adoption! Yes, it requires a little upfront lift, but the insights you gain are well-worth the investment. Don’t be one of those product teams that just ships and forgets, or you’ll wake up one day to a mountain of product debt manifesting in mounting maintenance costs, convoluted UX, and degrading product KPIs.
Want to see warehouse-based product analytics in action? Check out this sample Hex project. You can copy it to your own workspace if you want to try it yourself.