Blog
The Poles of Brand Inaccessibility
Using modern data tools to discover modern opportunities for exploration

Up near the top of the world, on the Arctic Ocean pack ice over 1,000km from the nearest land, lies an unassuming, somewhat arbitrary point that nobody has ever been to. It's not the North Pole (many have been there!), though it's close— it's the northern pole of inaccessibility, the point in the northern hemisphere farthest from any land mass. Due to constant motion of the ice, no permanent structure can exist at this pole and nobody has yet reached its location. To be fair, I'm not sure that many have really tried.
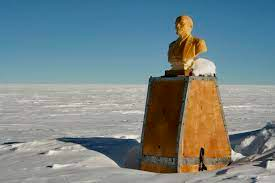
The consensus position of the southern pole of inaccessibility frequently varies due to both advancements in technology and debate over the continental edge of Antarctica. The most commonly agreed upon location is the “Polyus Nedostupnosti”, a Soviet station erected in 1958. Of course, there is a bust of Vladimir Lenin there. He must be lonesome.
The oceanic pole of inaccessibility, known as Point Nemo, is located in the South Pacific at roughly 48°52.6′S 123°23.6′W, the place in the ocean farthest from any land. Sometimes, the closest human beings to Point Nemo are astronauts aboard the International Space Station when it passes overhead.
There’s some inherent human fascination with adventuring to places that are just plain hard to get to. Mars, the bottom of the ocean, Mount Everest. But we’re not all cut out to summit Everest, or trek to the North Pole, or venture into space.
“What’s left”, you cry, lamentingly, “for me —the everyman— to explore!?”
Well, have I ever got something for you.
Introducing: The Poles of Brand Inaccessibility
Lubec, Maine, "where the sun first rises and adventure awaits” is the easternmost town in the United States. It is also the Americentric Pole of Wienerschnitzel Inaccessibility, clocking in at an inconvenient 1,821 km from the nearest Wienerschnitzel location.
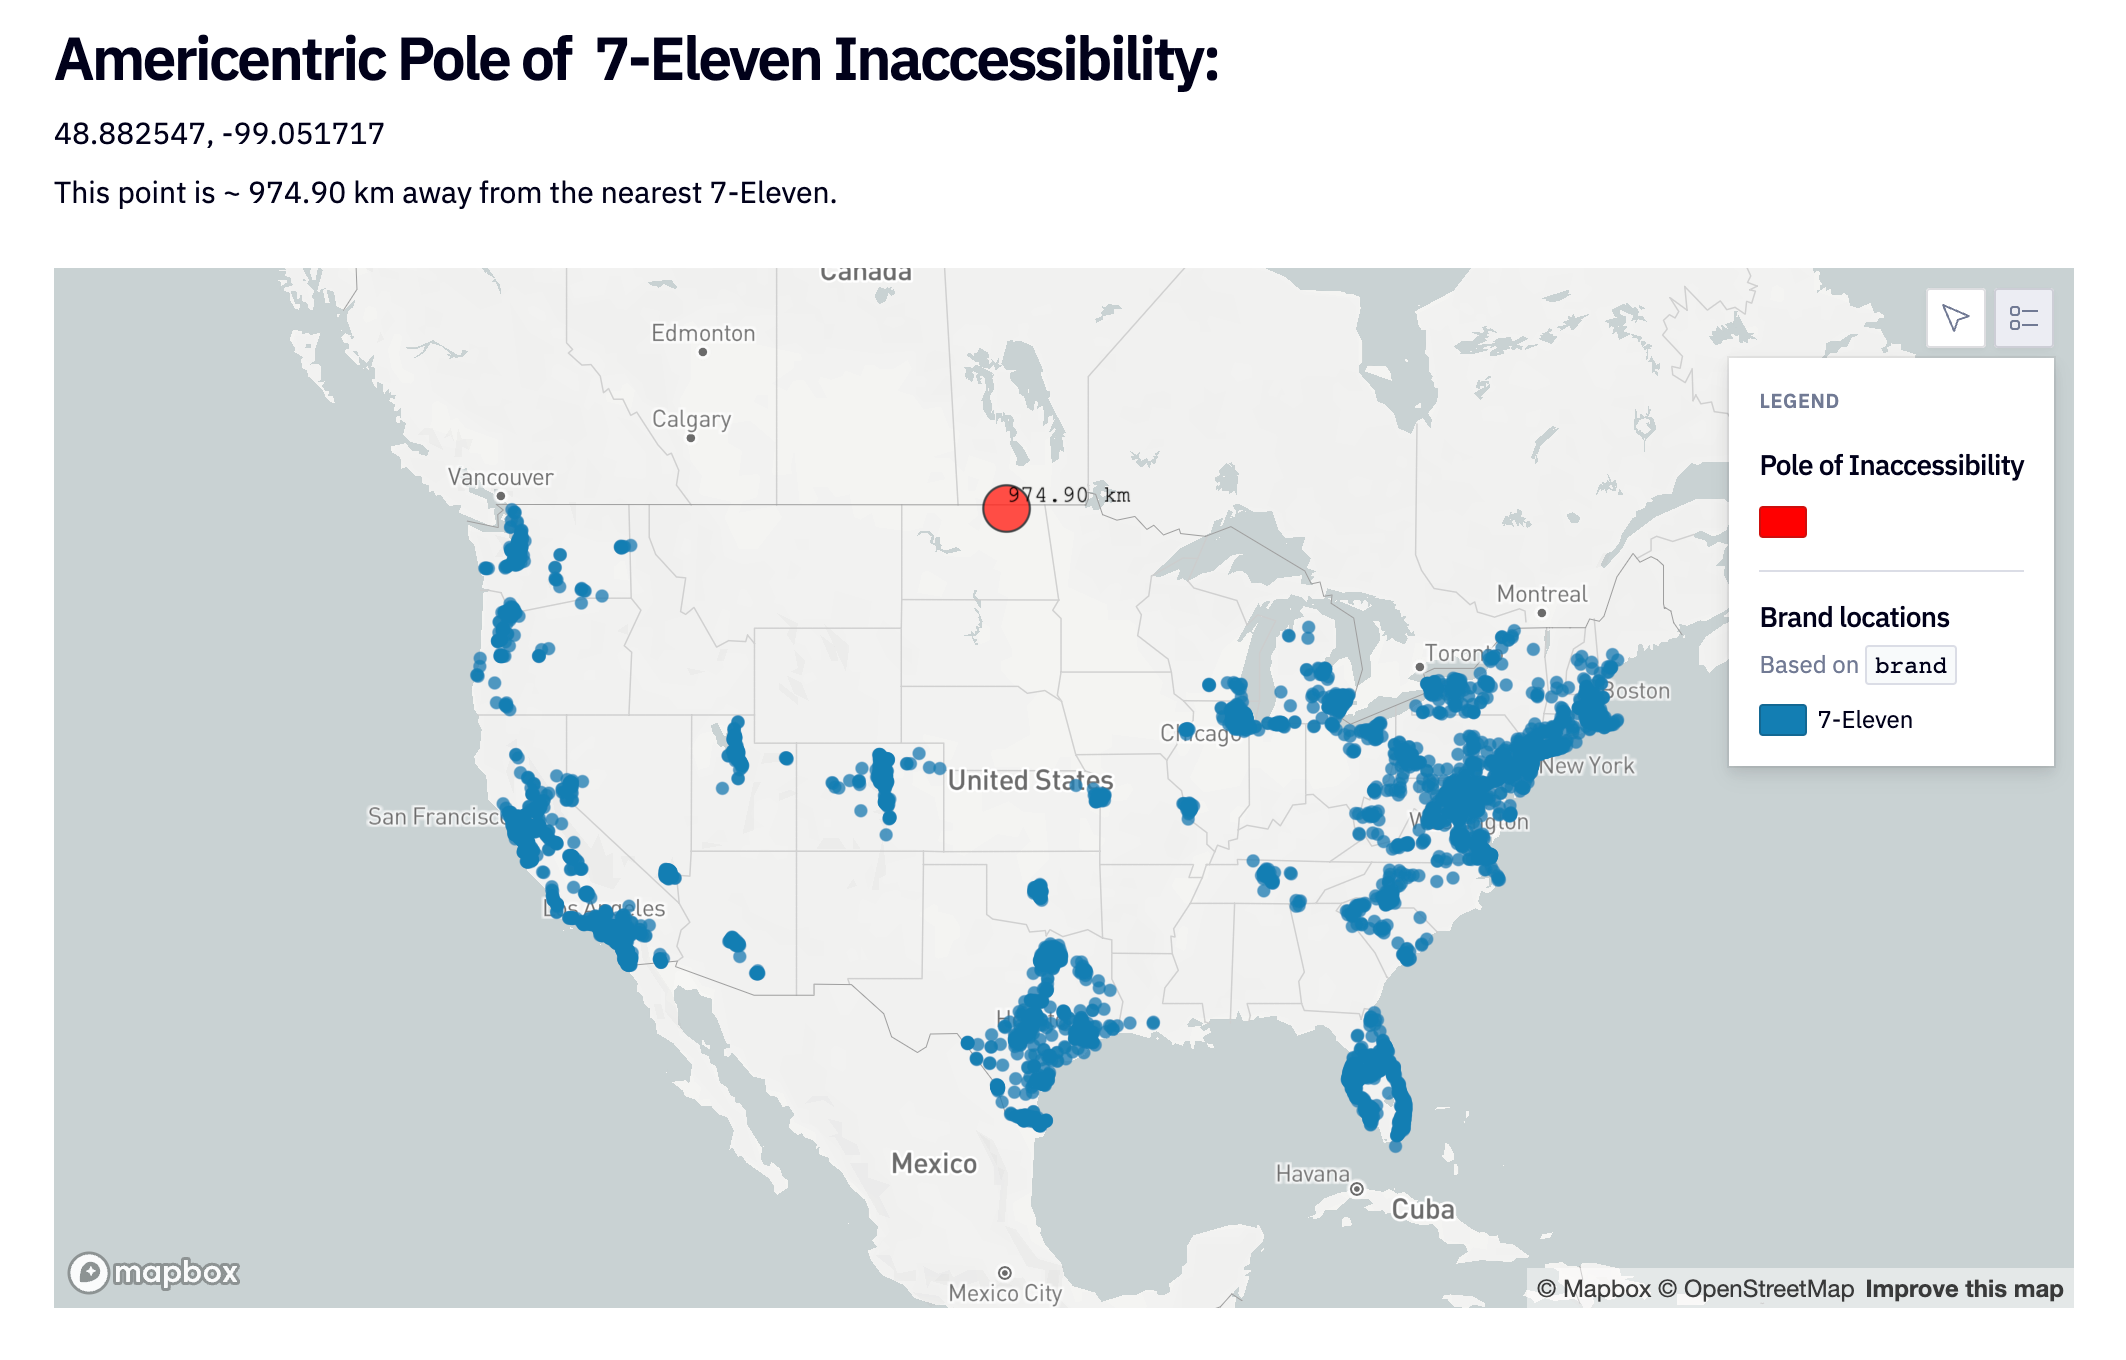
Perhaps the pole of 7-Eleven inaccessibility is more your speed, located in the desolate badlands of North Dakota approximately 975 kilometers from the nearest Slurpee®.
You see, America is ruled by the brand! Our golden arches, our five dollar footlongs, our weird coffee mermaids. No matter where you are in this fine country, some familiar fast food or retail therapy is never very far away.
What could be more adventurous than seeking out the exclusion zones, the lands before time, the stalwart holdouts against deep-fried progress— this is the true soul of modern American exploration!
And to help you, brave explorer, on your new quest (or to just poke around with some fun data), I crunched all the numbers and built an interactive explorer of all the Poles of Brand Inaccessibility in Hex, so you can try it out for yourself:
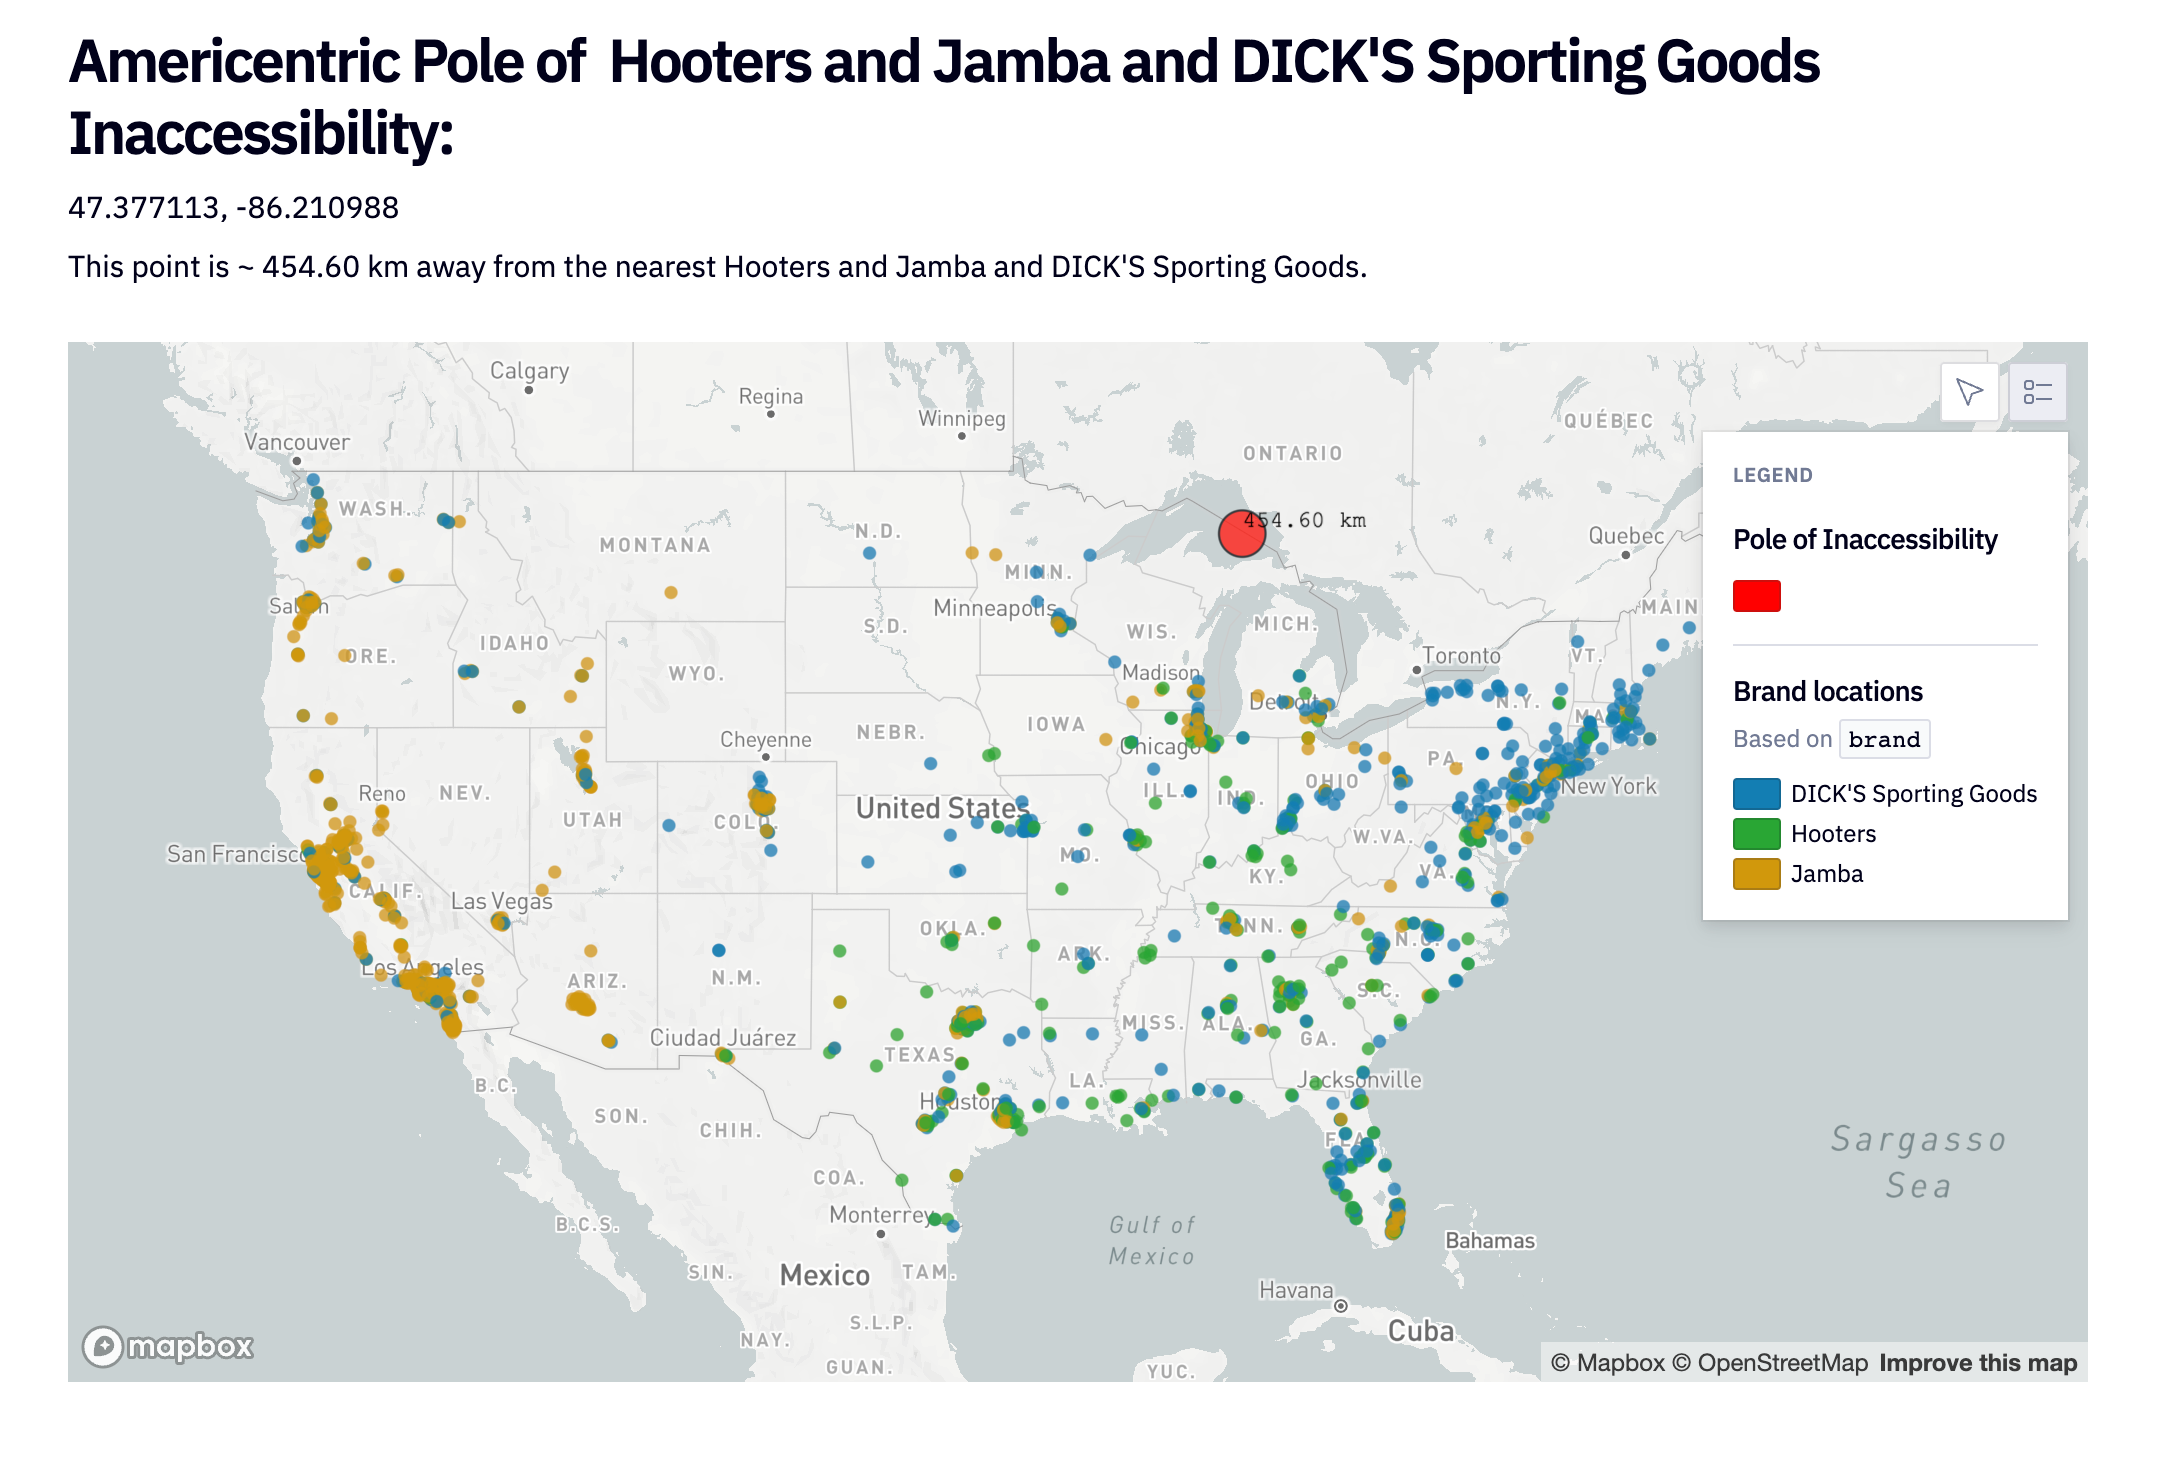
If you just scrolled right past that, I really encourage you to take a moment and play around with the map. You can come up with all kinds of fun and important combos, like the Unified Americentric Pole of Hooters, DICK'S Sporting Goods, and Jamba Juice Inaccessibility. Test subjects brought to this location have all reported inexplicable feelings of dread and asked to be returned “to a safer location” immediately.
If you look at the combined spread of all poles, a pretty interesting distribution appears. I don’t want to spoil the entire adventure of discovery for you all, but a few quick observations:
- The vast majority of large brands have poles along the northern border of the US, due to the combined effects of the shape of the earth and the fact that most of the northern states are essentially... empty.
- The west coast group is surprisingly minor, with just a couple of fairly small brand poles. I would have expected more of a coastal dimorphism among certain brands, but it seems to not be the case.
- The lack of an east coast group is very fascinating! The only brands with poles on the east coast are the ones up in the tip of Maine— the rest of the east coast is devoid of poles. Earth’s shape? New York City? I’m not sure— try and find out for yourself!
- The Nevada nothingness. This is where your most popular brands find their pole— Walmart, McDonalds, Dollar Tree, Applebees. The simple fact is that there just is pretty much nothing around there, so this is where the poles for brands that are "everywhere" wind up.
I’d love to see what else you discover with this data (tag me on twitter @isidoremiller).
The rest of this article will walk through how I did this analysis in Hex, and specifically how I turned it into something performant enough to be a live, interactive tool.
The McFarthest Spot
Important credit: This whole project started because of the phenomenal work Stephen Von Worley did in his “McFarthest Spot” series. I read his first piece, Where the Buffalo Roamed, when I was in high school, and always loved the concept and the execution.
When the Overture Maps Foundation released their global places dataset in late July, my mind instantly went to the McFarthest Spot. I thought “Surely there are new McDonald’s since 2009, I’ll update the location, reach out to Stephen, and he’ll be so impressed”. So I dug into the data, mapped all the Mickey D’s, found the McFarthest Spot— which, to my glee, had in fact moved—and started writing an article.
Then I re-read “Where the Buffalo Roamed”, and noticed a postscript I hadn’t seen before. Stephen himself updated the location of the McFarthest Spot not once, but twice, and was well aware of the new location!
But I was already in too deep and the Overture data was too enticing, so I thought to myself, well, he might have locked down McDonalds, but you know what Stephen didn’t map? Literally every single other brand.
And thus, the Poles of Brand Inaccessibility. Thank you, Stephen, and I hope you enjoy this derivative work! Though your code is not public, I reckon from the lat/long you chose for your McFarthest Spot that we used more or less the same technique for our calculations.
Getting the Raw Data
If you don’t want to read a long-form explanation of the code, you can just look at the Hex project, which contains all the code needed to reproduce this work. You can duplicate it and get hands on with it.
Overture was awesome enough to release their global places data as Parquet files on S3, which makes it incredibly easy and efficient to get started. Hat tip to Simon Willison for doing the trial and error that let me just copy/paste some DuckDB SQL out of his great article.
Hex notebooks have a built in DuckDB IDE in every SQL cell, so I could really easily prototype queries and explore the dataset without having to muck around on the command line and redefine functions each time. Eventually, I wound up with this SQL to extract the limited metadata I needed.
install httpfs;
load httpfs;
SET s3_region='us-west-2'
select names['common'][1][1]['value'][1] as name,
            addresses[1]['region'][1] as state,
            json(brand) as brand,
            categories['main'] as category,
				    geometry
from read_parquet("s3://overturemaps-us-west-2/release/2023-07-26-alpha.0/theme=places/type=*/*", filename=true, hive_partitioning=1)
where
	addresses[1]['country'][1] = 'US'
	AND
	categories['main'] in ('afghan_restaurant','african_restaurant','american_restaurant','antique_store','appliance_store','aquatic_pet_store','arabian_restaurant','arcade','argentine_restaurant','armenian_restaurant','arts_and_crafts',.....
I limited my scope to just the United States (hence, the Americentric Poles) and limited my categories to anything related to food, dining, or shopping. I actually used ChatGPT to help me with this task, dumping a massive list of every category and making batched requests to ChatGPT to extract just the ones of interest.

Then I copied/pasted the results out of ChatGPT, into my absolute all-time-favorite data tool delim.co, and put them straight into the SQL query.
Most of my initial queries against these Parquet files ran really fast— in seconds, or less. When I added that massive string filter and asked it to do all that array element extraction, it slowed down quite a bit (still only on the order of 10-15 seconds). I already knew I wanted to make this interactive, though, so that was too slow.
To speed things up, I just saved my own Parquet with the output of this query, and then referenced that moving forward. The next thing I did was drop every brand with less than 250 locations, not really for performance reasons (parquet querying in DuckDB is very very fast) but just to make it easier for users to parse the options.
select
    brand,
    category,
    count(*)
from 'data.parquet'
group by 1, 2
having count(*) > 250
order by 1 asc
Calculating Distances
Finding the distance from point X to point Y is a very easy task. This task becomes slightly harder when you have to do it in real geographic space instead of an abstract cartesian grid. The earth’s shape comes into play, so you can’t just draw straight lines.
And this task gets quite a bit slower when you want to do it for every single location of a major brand (say, all 13,392 McDonald’s). Oh, and then it gets a LOT slower when you want to check the distance from every single one of those McDonalds to every single possible point in the 1.9 billion acres of the United States.
So we have 3 problems:
- Rapidly calculating great-circle distance for two latitude/longitude pairs
- Efficiently performing that calculation on a large number of lat/lon pairs
- Making the US significantly smaller
Let’s work through them one by one, going backwards.
Making the US significantly smaller
Obviously we can’t make the US smaller. Oh wait, sure we can! We’ll just use a more realistic projection!

(map joke). Anyways, no, we can’t make the US smaller. But we can really easily decrease the resolution with which we perceive it. For our purposes, a pretty rough resolution is fine— we’re dealing in kilometers and miles here, not inches or meters. So let’s take the USA and throw down a point grid that evenly spaces points across the entire surface.
def gen_grid_points(res):
    us_gdf = gpd.read_file("gz_2010_us_outline_20m.json")
    continental_us_gdf = us_gdf.cx[-125:-66, 24:50]

    lat_range = np.linspace(
        continental_us_gdf.total_bounds[1], continental_us_gdf.total_bounds[3], res
    )
    lon_range = np.linspace(
        continental_us_gdf.total_bounds[0], continental_us_gdf.total_bounds[2], res
    )

    grid_points = list(product(lon_range, lat_range))

    grid_df = pd.DataFrame(grid_points, columns=["longitude", "latitude"])

    return grid_df
This code takes an outline of the USA in GeoJSON, very roughly clips it to the extent of the contiguous states, and then creates arrays for latitude and longitude that each contain an evenly spaced sequence of values within the provided range. Taking the product of these arrays gives you an evenly distributed grid of points across the US! This method also provides control over the resolution of the grid— if I set res = 5, then there’d only be 25 points covering the entire USA, at a really low resolution. After some tests, I opted for a resolution of 100 which worked pretty well.
My clipping mask for the continental US was pretty rough earlier, so we got lots of stray points outside the borders. These would obviously become erroneous poles of inaccessibility, so I had to be more precise in my clipping. To do this, I just uploaded a nice precise GeoJSON of the continental USA, and then ran a quick SQL query to only keep points within that geometry.
Note: I bet this task would have taken quite some time using GeoPandas, but it was REALLY fast using DuckDB’s spatial plugin. Really, really into this toolset!
I dumped this grid to a Parquet file too since it only needed to be generated once. That gives us this nice beautiful point grid:
Okay, that’s one problem out of the way. Now let’s hit the others.
Calculating distance between many points
My first attempt at this was to just use that super slick DuckDB spatial plugin. I broke the job up over two chained SQL queries. I love using cross joins for some reason, it feels so… risque.
-- grid_point_distances
SELECT
    grid_points.longitude, grid_points.latitude,
    MIN(ST_Distance(st_point(grid_points.longitude,grid_points.latitude), st_point(input_points.longitude,input_points.latitude))) AS distance_to_nearest_input_point
FROM
    dataframe input_points,
    points_in_us grid_points
GROUP BY
    grid_points.longitude, grid_points.latitude
Chained into:
-- distances
SELECT
    longitude, latitude,
    MAX(distance_to_nearest_input_point) AS max_distance
FROM
    grid_point_distances
    group by 1,2
    order by 3 desc
limit 1This works just fine, and gives a nice accurate location for the requested Pole of Inaccessibility. But it’s too slow for a real-time interactive tool, taking over a minute to complete. I needed seconds here, so I did what anyone would do when optimizing performance: I switched to Python 😜.
And of course, my first attempts here were very very slow. My first naive attempt is below, but it never ran to completion before I killed it. This nested loop approach was obviously never going to work at the hundred-million-possibilities scale I needed it to.
def find_farthest_point(input_df, grid_points):
    grid_points = [Point(point) for point in grid_points]
    input_points_array = np.array(
        [(row.latitude, row.longitude) for _, row in input_df.iterrows()]
    )
    grid_points_array = np.array([(point.y, point.x) for point in grid_points])

    # For each grid point, find the distance to the nearest input point w/ haversine
    distances = np.min(
        [
            haversine(grid_point, input_point)
            for grid_point, input_point in product(
                grid_points_array, input_points_array
            )
        ],
        axis=0,
    )
    most_distant_point = grid_points[np.argmax(distances)]

    return most_distant_point
But this is basically a nearest-neighbor problem (well, a farthest-neighbor problem) and I’ve been reading a ton about vector DBs lately, so my brain jumped towards that kind of solution. I implemented a KD tree approach, since this was a very low dimensional problem.
def find_farthest_point_kdt(input_df, grid_points):
    ## im uncertain of the accuracy of this method
    grid_points = [Point(row.longitude,row.latitude) for _, row in grid_points.iterrows()]
    grid_points_array = np.array([latlon_to_xyz(point.y, point.x) for point in grid_points])
    input_points_array = np.array([latlon_to_xyz(row.latitude, row.longitude) for _, row in input_df.iterrows()])
    R = 6371 ## earths radius
    tree = cKDTree(input_points_array)
    distances, _ = tree.query(grid_points_array, k=1)
    distances = 2 * R * np.arcsin(distances / (2 * R))  # this is an approx Haversine formula
    most_distant_point = grid_points[np.argmax(distances)]

    return most_distant_point
For those unfamiliar with KD trees, they’re basically a sorting method that lets you pre-compute a very efficiently laid out “tree” of options for your search space, and then narrow down your options systematically when it comes time to search for something. There’s a ton of different tree-based data structures, probably some of which I’ve never learned about that’d be a better fit here. Let me know!
This worked pretty well! I shimmed in an approximate Haversine calculation here to deal with the fact that the KDTree is working off of Euclidean distance, which doesn’t accurately reflect the curvature of the earth. I think it works ok but not perfectly, and it just felt kind of hacky. It was really fast though.
Then I read about Ball Trees, and decided that was the perfect way to do this calculation.
def find_farthest_point_balltree(input_df, grid_points):
    grid_points_array = np.array([[row.latitude, row.longitude] for _, row in grid_points.iterrows()])
    input_points_array = np.array([[row.latitude, row.longitude] for _, row in input_df.iterrows()])
    R = 6371  # Earths radius in km

    input_points_rad = np.deg2rad(input_points_array)
    grid_points_rad = np.deg2rad(grid_points_array)
    tree = BallTree(input_points_rad, metric='haversine')

    distances, _ = tree.query(grid_points_rad, k=1)
    distances = distances * R
    index_of_most_distant = np.argmax(distances)
    most_distant_point = grid_points.iloc[index_of_most_distant]
    distance_to_nearest_neighbor = distances[index_of_most_distant][0]

    return most_distant_point, distance_to_nearest_neighbor
The sklearn BallTree method has built-in support for Haversine distance, so I didn’t have to worry about fudging it myself. I’m still not 1000% clear on how ball trees work, but my basic understanding is that instead of visualizing a typical branching tree structure, you instead visualize a series of spheres with a center and radius, each containing your items. Then you iteratively split the spheres in two, creating a finer and finer set of spheres which you traverse to find your item.
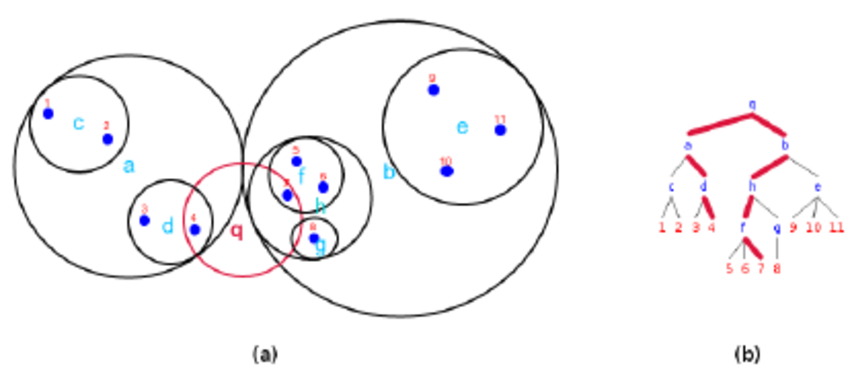
This is great here, since it's fast and the data structure has a built-in concept of spherical distance.
Anyways, this worked great. The calculation is very precise, and takes about a second to run. Every time you change your selection in that Hex app, data from the Parquet file is read and piped into find_farthest_point_balltree() which compares it to 10,000 potential grid points in the USA and chooses the most distant one. Pretty sweet.
Putting it all together
And that’s pretty much it! The beauty of doing this project entirely in Hex means that the process of getting it ready for sharing involved some commenting out of code, some dragging and dropping, and adding a little bit of explicatory text. The project you see live is the same place where I did my scratch work, figured out what the dataset looked like, fumbled through various distance algorithms, and then finally polished up something beautiful and interactive.
I’d really love to see the funny Poles of Inaccessibility you discover with this tool, any deeper insights into the true nature of the Poles, or any cool further research this inspires you towards. Let me know @isidoremiller on Twitter!
If this is is interesting, click below to get started, or to check out opportunities to join our team.