Blog
We took down production by misconfiguring our ETL
Here’s what we learned and how you can avoid it

On November 7, 2022, an ETL configuration issue caused our production Postgres to completely fill disk space, resulting in a Hex Cloud outage for about 2 hours 40 minutes. This was our longest-ever service interruption, affecting thousands of users globally during that window. You can read a complete post-mortem here.
I want to apologize to everyone whose work was disrupted. We take uptime seriously and have invested a significant amount of engineering effort in it. As you’ll read below, we had actually put some measures in place to avoid exactly this problem, but the outage still lasted much longer than it should have.
This was bad! So, you might be wondering why we’re writing a public blog post about it. Well, we learned a lot while investigating this issue, including how easy it was to get ourselves into a bad state with tools that aren’t typically considered dangerous. There are a lot of folks in our community who have similar setups, so we are publishing our findings in the hopes that others will find it educational – or at least entertaining.
Background on our ETL stack
Our multi-tenant Hex Cloud runs primarily on AWS, using a managed RDS instance to run a Postgres database powering our application. We also have a read replica that follows prod by about a minute, so we can run expensive queries (like migration dry runs or ad-hoc analytics) without affecting performance.
As you’d expect, we also have a top-notch Data team and stack. Earlier this year, we migrated our data extraction jobs to Fivetran (to be clear - the incident here isn’t their fault).
Fivetran’s main job is syncing data from our application Postgres to our Snowflake warehouse so we can transform it in dbt, analyze it in Hex, and flow into the rest of our data stack. This is done through incremental syncs, where only the recently-changed data is transferred.
When we first configured Fivetran**, the two options for incremental syncs were logical replication and XMIN. We actually just wrote a whole blog post breaking down the differences between these.
XMIN would have let us connect to our Postgres read replica, but it’s not recommended for “near real-time data needs because XMIN replication is slower than logical replication and doesn't allow Fivetran to detect deleted rows.” (source)
We needed both near real-time data and deletion detection, so we chose logical replication, which required us to connect directly to our main production Postgres (not a read replica).
Waiting write-ahead log
A database write-ahead log (WAL) stores information about new or changed data (you can read much more here), which is useful for applications that only care about data updates rather than processing the entire database at once. In particular, Fivetran uses it to know what updates to sync. The WAL is implemented as a queue: if the data in the WAL is consumed, it’s flushed from the queue, but if data is not, it stays in the WAL and waits.

The upshot is that if your Fivetran sync ever goes down, the WAL will grow continuously and unboundedly as the production DB keeps adding and changing data.
What happened
On Thursday, November 3rd, we deleted and recreated the database tunnel that Fivetran uses to connect to our production DB. The database credentials didn’t change, so we didn’t think there would be an issue, but the new EC2 host had a different fingerprint, so the Fivetran connection began failing.
Now, because Fivetran wasn’t consuming the WAL, it started building up (and up… and up…) on our production DB instance.
A completely full database can’t process any requests, so at approximately 12 pm PT on Monday, November 11th, app.hex.tech became unresponsive and sent us into incident mode.
Auto-scaling didn’t save us
A database filling up isn’t outlandish, and we had actually anticipated this exact situation: our RDS instance was configured to auto scale-up when it starts to get low on space. What we didn’t realize was that following the scale up, a significant optimization step follows, automatically rearranging the disk layout. This can improve performance, but also take several hours, and the database can’t be scaled again when this is happening.
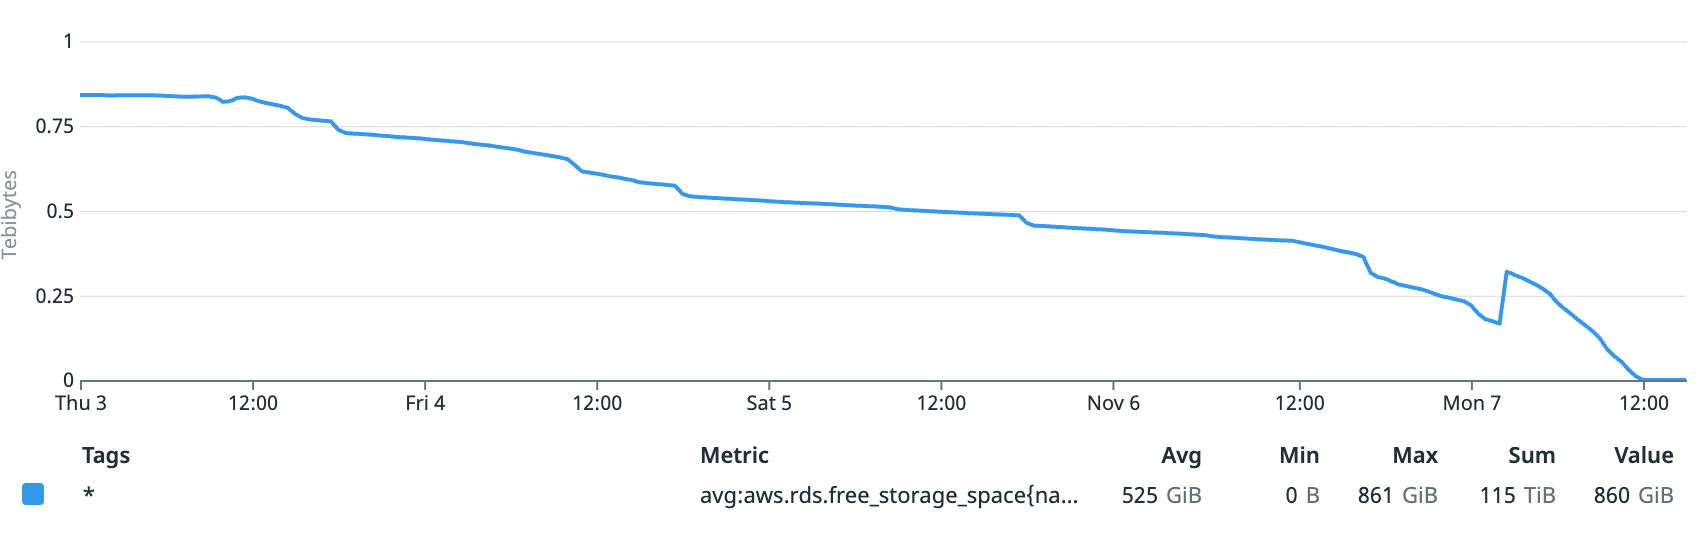
As you can see in the graph above, our RDS instance did successfully scale up. But at a chunky 1.8 TB, the optimization step would take many hours, during which the database cannot be resized again. And it was this part that bit us: the size of the WAL was increasing faster than our DB could scale and optimize, meaning we only made it through one cycle of scale-up before the WAL caught up to the new size and locked us out again.
There is an irony here, which is that if we hadn’t set our DB to auto-scale, the outage would have happened a few hours sooner, but would have lasted only a few minutes while we manually re-sized the DB and fixed the Fivetran connectivity issue.
But, alas, we were stuck waiting for the optimization step, unable to further scale our database until it finished. This was the point at which we called AWS Support, where we learned there was absolutely nothing they could do to terminate or accelerate the optimization process. And worse, after 12 hours, we were only 75% of the way done.
The read replica didn’t save us, either
Fortunately, we also had the read replica, which we’d initially set up for analytics. When we realized that our main database would be out of commission for several more hours, we started working on options to use the replica as our primary database.
Unfortunately, we assumed that since it’s a read-only replica, we couldn’t just swap it in – but might be able to restore a backup into a new read/write instance. So we kicked off a backup, expecting it to take about 20 minutes, the length of our typical nightly backup.
Reader, it did not take 20 minutes.
What we had neglected to account for was that the nightly backups of our production database are incremental. But our replica had never been backed up before, which means the backup was starting from scratch. And doing anything 1.8 TB – even copying it from one place to another – takes a long time.
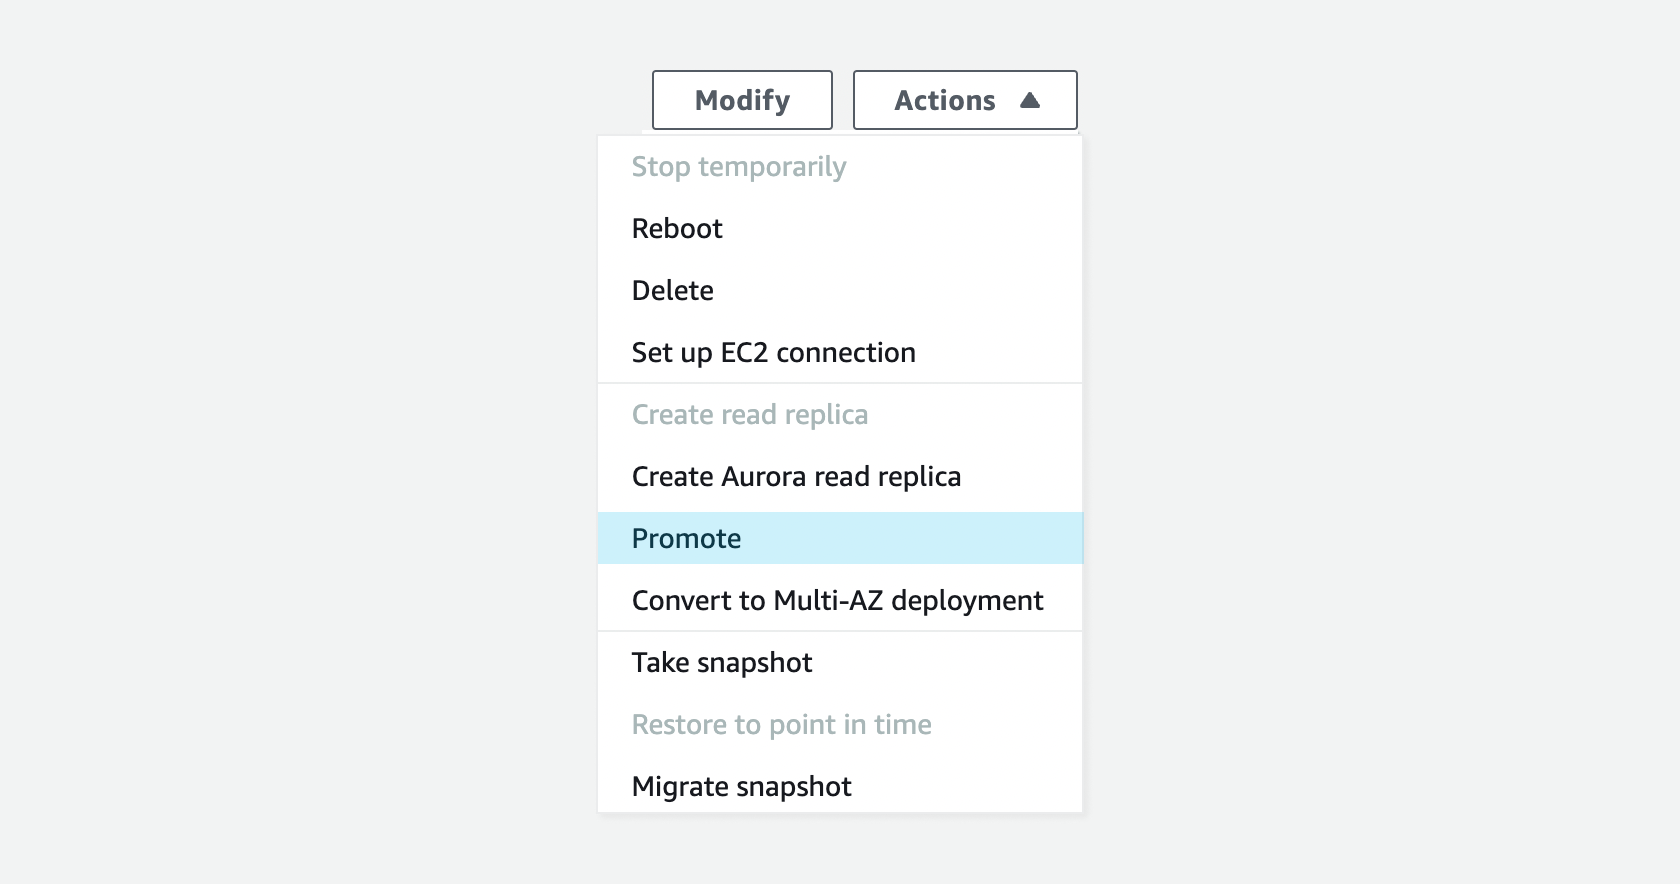
Once it became clear this was not proceeding as fast as expected, we began to explore as many options as we could to accelerate the timeline. During this exploration, we realized that the backup was actually unnecessary: you can just promote a read replica to be the main database through the AWS console. We’re saved!
Haha no, no no, apparently you cannot do this while a backup is running. Back on the phone with AWS, they helpfully informed that after 20-some minutes, our backup was only 39% complete, and that there was absolutely nothing they could do to terminate or accelerate the process (sound familiar?).

Turtle race to the finish
So, now we were stuck waiting for one of two long-running processes – the database optimization, or replica backup – to finish before we could do anything.

The winner (replica backup! 🥇) took another hour.
Once it did finally complete, the fix was fast – we promoted the replica, updated our Kubernetes variables to point to the new db, and had prod back up in a few minutes.
Next steps
We do a post-mortem for every incident (you can read the official notes here), and fortunately this one had several very clear follow ups to prevent this specific brand of failure from happening again.
Better alerts
As you can see from the graph above, disk space was filling up for several days before the incident. While we have alerting on a range of other database issues (such as query time), we missed alerts in two places that would have notified us of the issue in time to avoid an outage: one on free space in the database (which we’d had previously but had disabled due to noisiness with auto-scaling behavior), and one on Fivetran failures.
In addition to adding these specific alerts, we’ve kicked off a broader project around monitoring to audit our existing systems and ensure that we have the right alerts in place for each service to head off significant future issues.
Better WAL handling
Fivetran isn’t the only use-case for the WAL (in fact, we’re adding Elastic to our stack now, which will use a similar mechanism), so we’ll need to account for this failure mode in the future, even with better Fivetran monitoring.
Fortunately, Postgres 13 has the ability to limit the size of the WAL, which in this scenario might lead to some internal data consistency issues, but will prevent a larger outage. We’ve been on Postgres 12 for a while, so we’re taking this opportunity to prioritize an upgrade.
Moving non-essential workloads off of prod
We’re also exploring Teleport for Fivetran, which we currently have running against our replica, alongside the WAL-based connection. We’re excited to try this out – if it works for our use case it will significantly de-risk our ETL integration.
Incident response updates
The worst time to try to figure out a new process is under pressure during an active incident. (Indeed, the time pressure is why we jumped to something we knew how to do before exploring further, which in our case exacerbated the incident.)
To avoid this, we maintain an extensive set of incident runbooks and conduct quarterly fire drills with all engineers. We actually had a runbook for a related but slightly different case (databse corrupted or unrecoverable) that led us astray here, jumping to restore from backup as the first option. Following this incident, we’ll be adding a runbook specifically dedicated to restoring from the read replica, which in many cases will be the fastest way to restore an uncorrupted but unresponsive database.
Learnings
Beyond specific operational fixes, we’ve absorbed a few lessons that we’ll be carrying forward to future projects.
First, redundancy is key. We were completely saved by our read replica. Over the course of the outage, the optimization process completed another 2%. Without the replica, we might have been deciding between significant data loss (our backup was several hours old) or days of downtime.
Second, even when in crisis mode, take a minute to reflect before diving in. Our initial response was to try the things we knew how to do to see if they worked – including taking a backup – but we didn’t stop to think about how they might fail, or what to do in that scenario. In particular, we were caught off guard by long-running, irreversible operations in AWS, and had we thought through the failure modes of the backup and restore plan, we might have sought other alternatives before beginning.
Finally, and most importantly, prod is prod. All systems that touch prod – even ones that themselves are non-critical – should have the same level of reliability, monitoring, and alerting that critical systems have. Systems are complex organisms, and anything that touches a critical system has a chance of having unexpected and catastrophic results. You should treat them accordingly.
Parting thoughts
No outage is desirable, but at Hex we try to approach every incident as a learning opportunity. We hope this post-mortem has been educational for you as well, and if you have any more questions or thoughts, don’t hesitate to reach out to us at [email protected].
** Fivetran has since added an additional mechanism: Fivetran Teleport Sync, which we are exploring as a solution now!