Blog
Automating Reporting at Algolia
How one data team transformed tedious, manual reporting tasks into seamless, automated workflows

This is a summary of a Select session that was presented live on August 10, 2023.
Algolia, like at many other companies, holds quarterly reviews which have many charts and graphs representing what's been going on in the business. Each quarter they would spend a couple weeks regenerating and updating each one of these visualizations. This was time intensive and often stakeholders wanted the data refreshed before and after the meeting leading to more rounds of updating by the data team.
They needed a process to transform tedious manual tasks into a seamless, automated workflow. Here’s how they automated quarterly reviews at Algolia.
From Manual to Magical: Previous vs. Current State
In the past, the quarterly review process was a manual ordeal. The data team downloaded CSV files from Salesforce, uploaded them to Google Sheets, modeled the data, created visualizations and painstakingly copied charts to Google Slides. It was time consuming and prone to errors.
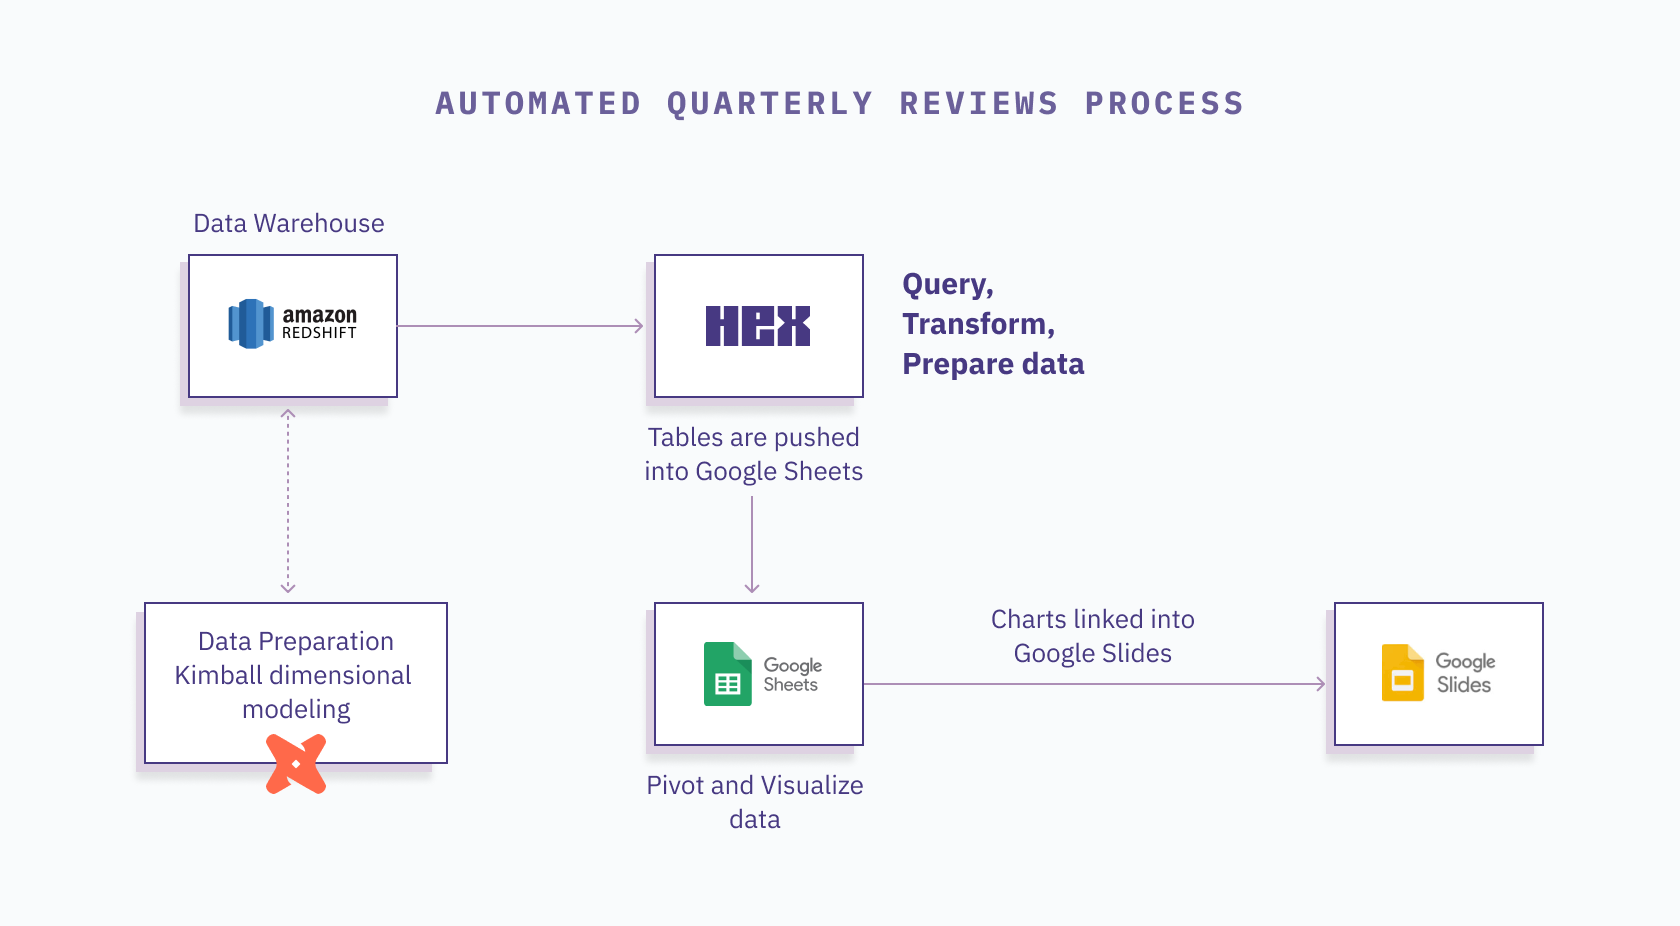
They decided to automate pulling data from Salesforce into Redshift using Fivetran. Once the data was in the warehouse they could use dbt to automate the transformations necessary to prepare the data for analysis. This ensured that their data was both accurate and reliable as a single source of truth. They focused on data quality, business logic and thorough documentation. All together, this created a solid foundation for automated reporting.
Then the Algolia data team used Hex to automatically query the data from the warehouse and push specific data sets into Google sheets using APIs. Check out this Hex template to push data into Google sheets.
With the data in Google Sheets, they could pivot and visualize the data into charts that were copied and pasted into Google Slides. These charts are linked so that if the data changes in Google Sheets you can click update all in Google Slides to refresh all the charts in your deck, with the push of just one button.
When this initiative began, Algolia had two goals: to use curated data and to drive data automation across the organization. The breakthrough came when they introduced Hex and dbt into the mix. They started automating data retrieval, transformation, and visualization. They were able to establish an automated connection between data sources and Google Sheets which eliminated the need for manual intervention. Charts in the quarterly review deck could now be updated with a click, saving valuable time while also reducing errors.
Accelerating Insights
The introduction of automation was game-changing. What used to take two weeks to complete is now finished in just 5-10 minutes. Executives now have access to trusted, automated data that they can rely on for accurate insights, anytime. This newfound reliability has prompted the Algolia team to extend automation to other teams with routine reporting needs. And now they re-allocate the time spent on administrative tasks, like copying and pasting data, to more strategic projects.
Algolia relies on data to make smart decisions about the business, so automation is key. The journey to automating quarterly reviews transformed their process from manual drudgery to efficient, data-driven insights. By automating, they saved time, improved the accuracy of their work and empowered the team to focus on more strategic tasks. With Hex, dbt, Redshift and Google Slides, they created a seamless and efficient reporting process that brings new levels of efficiency to the team.
Are you interested in automating your reporting process? Watch the original recording that this post is based upon or ask Hex to show you a demo.