Automating Quarterly Reviews

hex-avatar

Izzy Miller

Connect your data between Hex and Google Sheets as well as Google Slides within minutes. Empower your business stakeholders to access data and charts that automatically refresh before the next QBR.

playWatch demo(15 min)

Explore a live demo

What you can build (app)
How it's built (logic)
Full screen

See what else Hex can do

Discover how other data scientists and analysts use Hex for everything from dashboards to deep dives.

BLOG
Hex and Algolia

Automating Reporting at Algolia

Matthew David ยท September 1, 2023

How one data team transformed tedious, manual reporting tasks into seamless, automated workflows

USE CASE
Rudderstack use case image

Replace Google Analytics with Rudderstack & Hex

Build a more in-depth and flexible analytics stack

USE CASE
Pop real

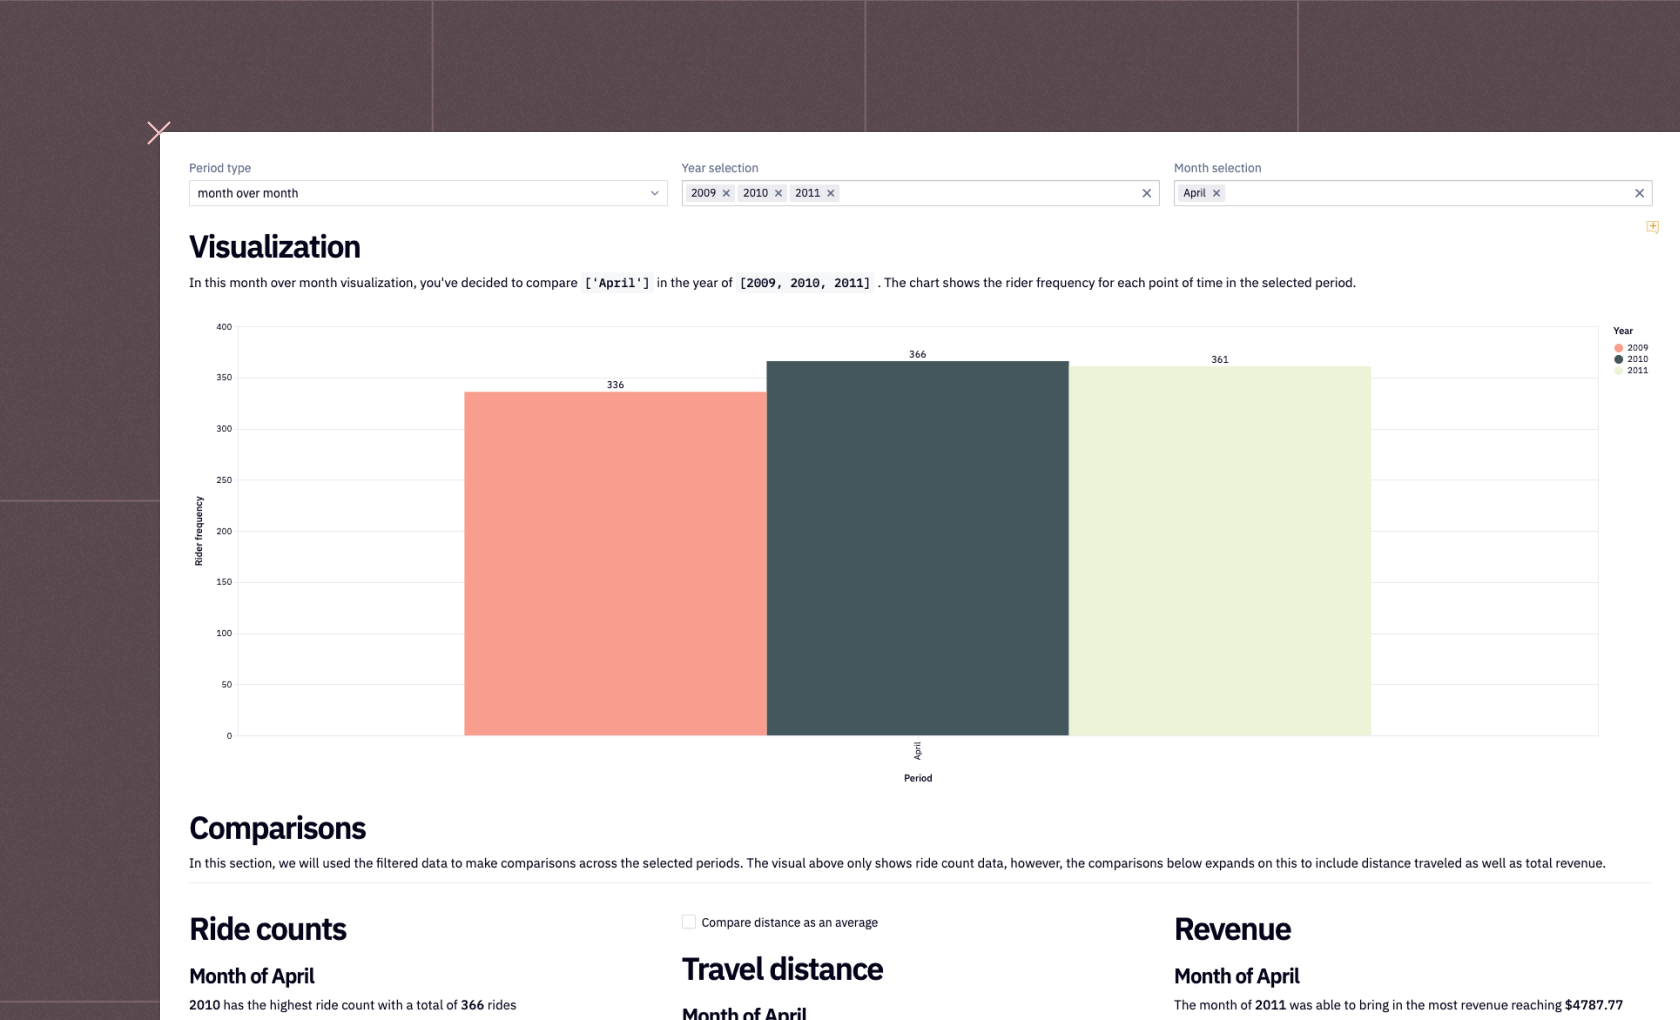
Period over period analysis

Izzy Miller

Compare various points in time across multiple periods

USE CASE
inventory

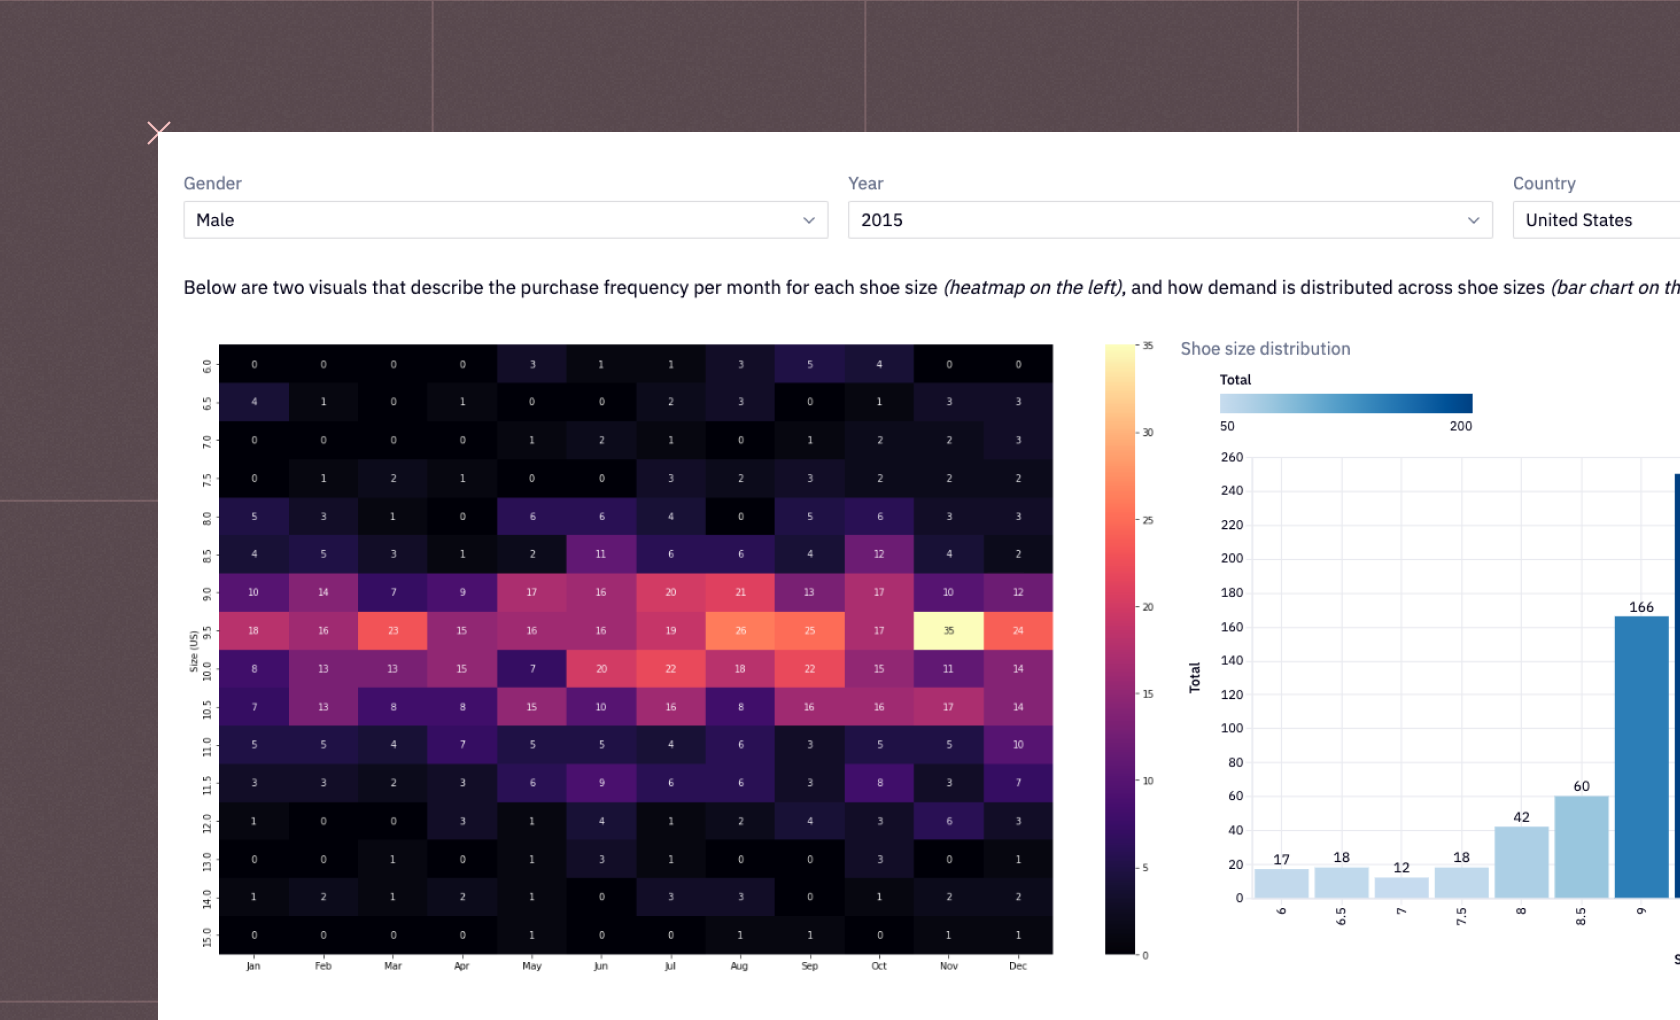
Inventory management

Izzy Miller

Leverage insights to make informed decisions about product inventory and ensure availability

USE CASE
Cohort analysis@2x

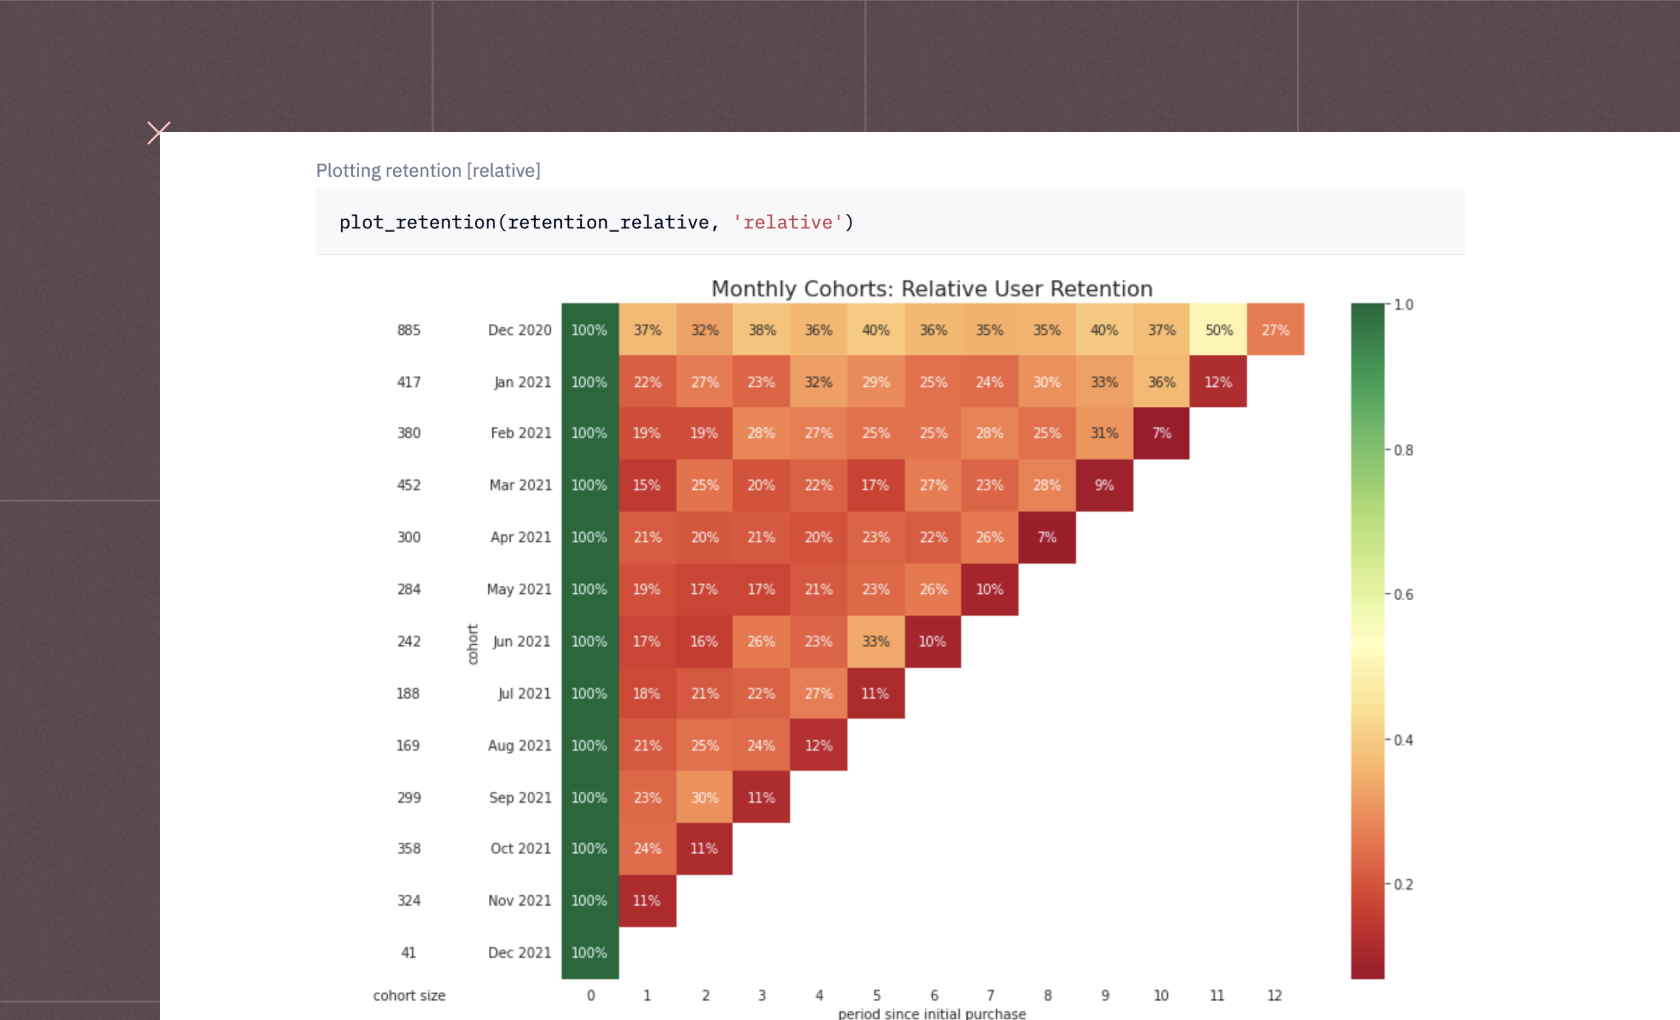
Cohort analysis

Izzy Miller

Analyze groups of customers to understand retention, predict churn, and find other patterns.

USE CASE
metrics dash cover

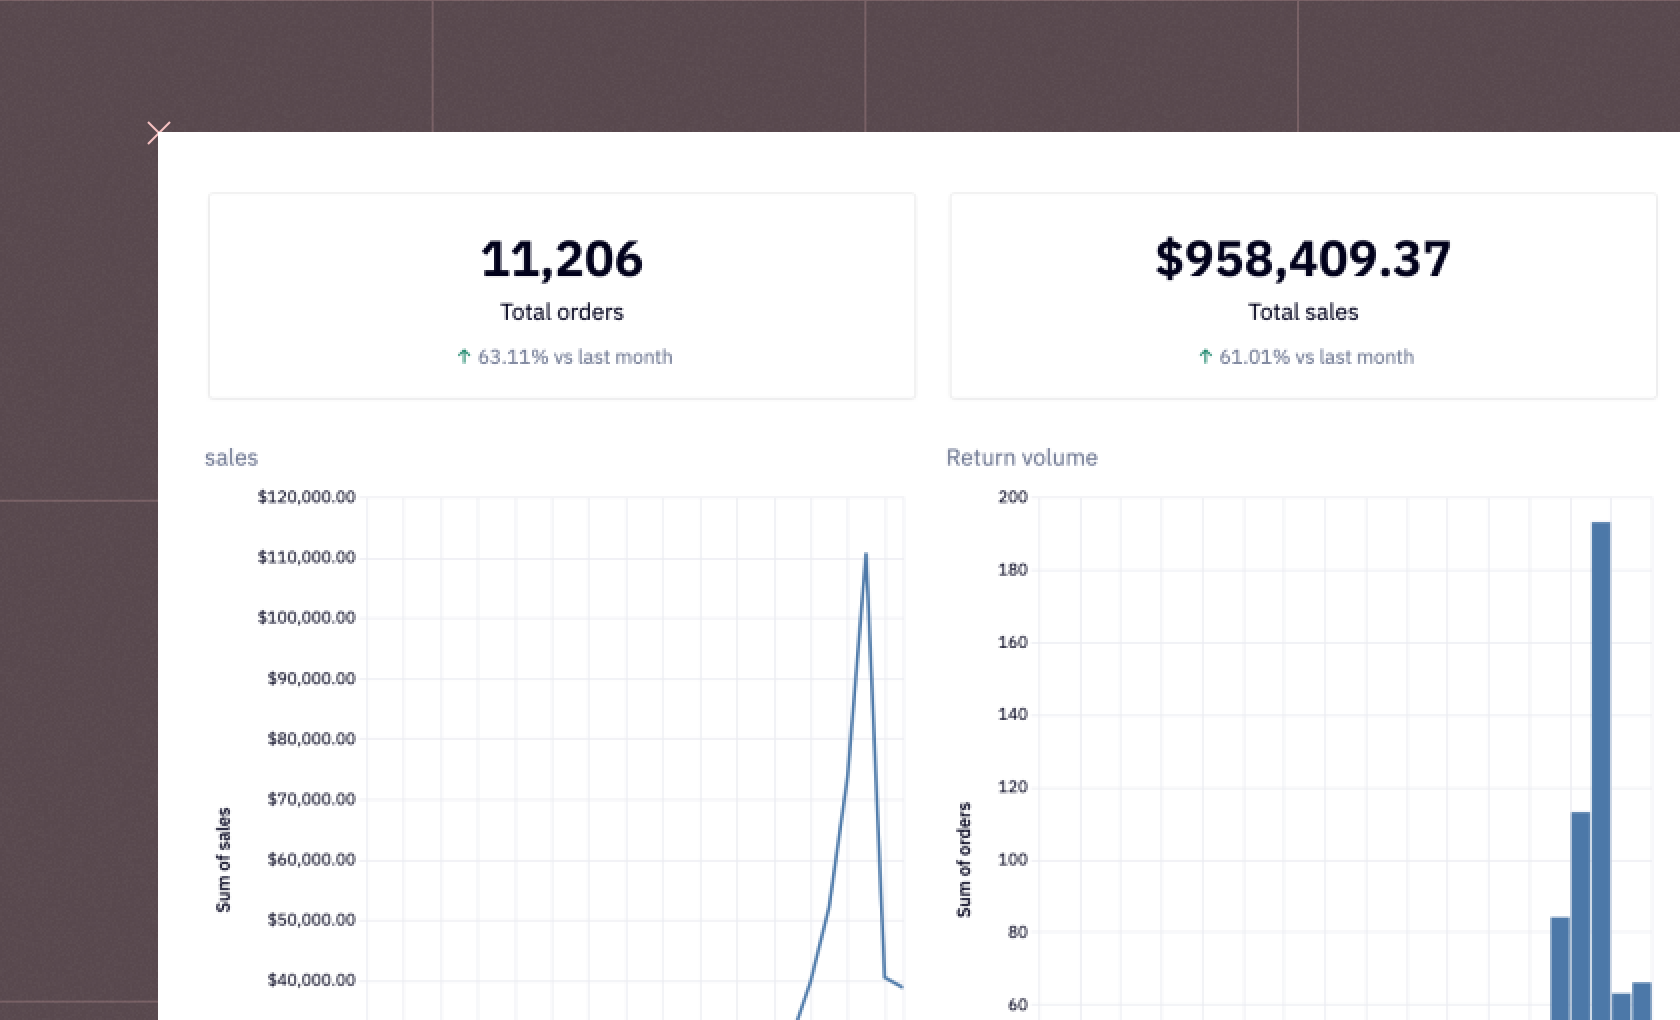
Company Metrics Dashboard

Izzy Miller

Don't limit yourself to traditional, old-fashioned BI. Hex lets you turn even the most flexible and complex analyses into beautiful dashboards.

Ready to get started?

You can use Hex in two ways: our centrally-hosted Hex Cloud stack, or a private single-tenant VPC.
Community

Free to explore data and showcase your work.

Get started

Professional

For practitioners or small teams accelerating data workflows.

Get started

Team

For teams scaling data collaboration and governance.

Try 14 days free

Enterprise

Advanced security, support and control for organizations.

Contact us