
This is a guest post on the Hex Blog by Matt Palmer from AllTrails, explaining how his team uses Hex for their day-to-day work.
Analytics: The Team & Its Data Stack
AllTrails has been hard at work ensuring we’re able to scale and foster a data-driven culture within the company. As AllTrails grows, so does the need for clear and reproducible analyses. With 6+ analysts spanning product, growth, marketing, and finance, our Analytics team has established a process for delivering insights while working with stakeholders to implement event tracking, stand-up dashboarding, and conduct A/B testing.
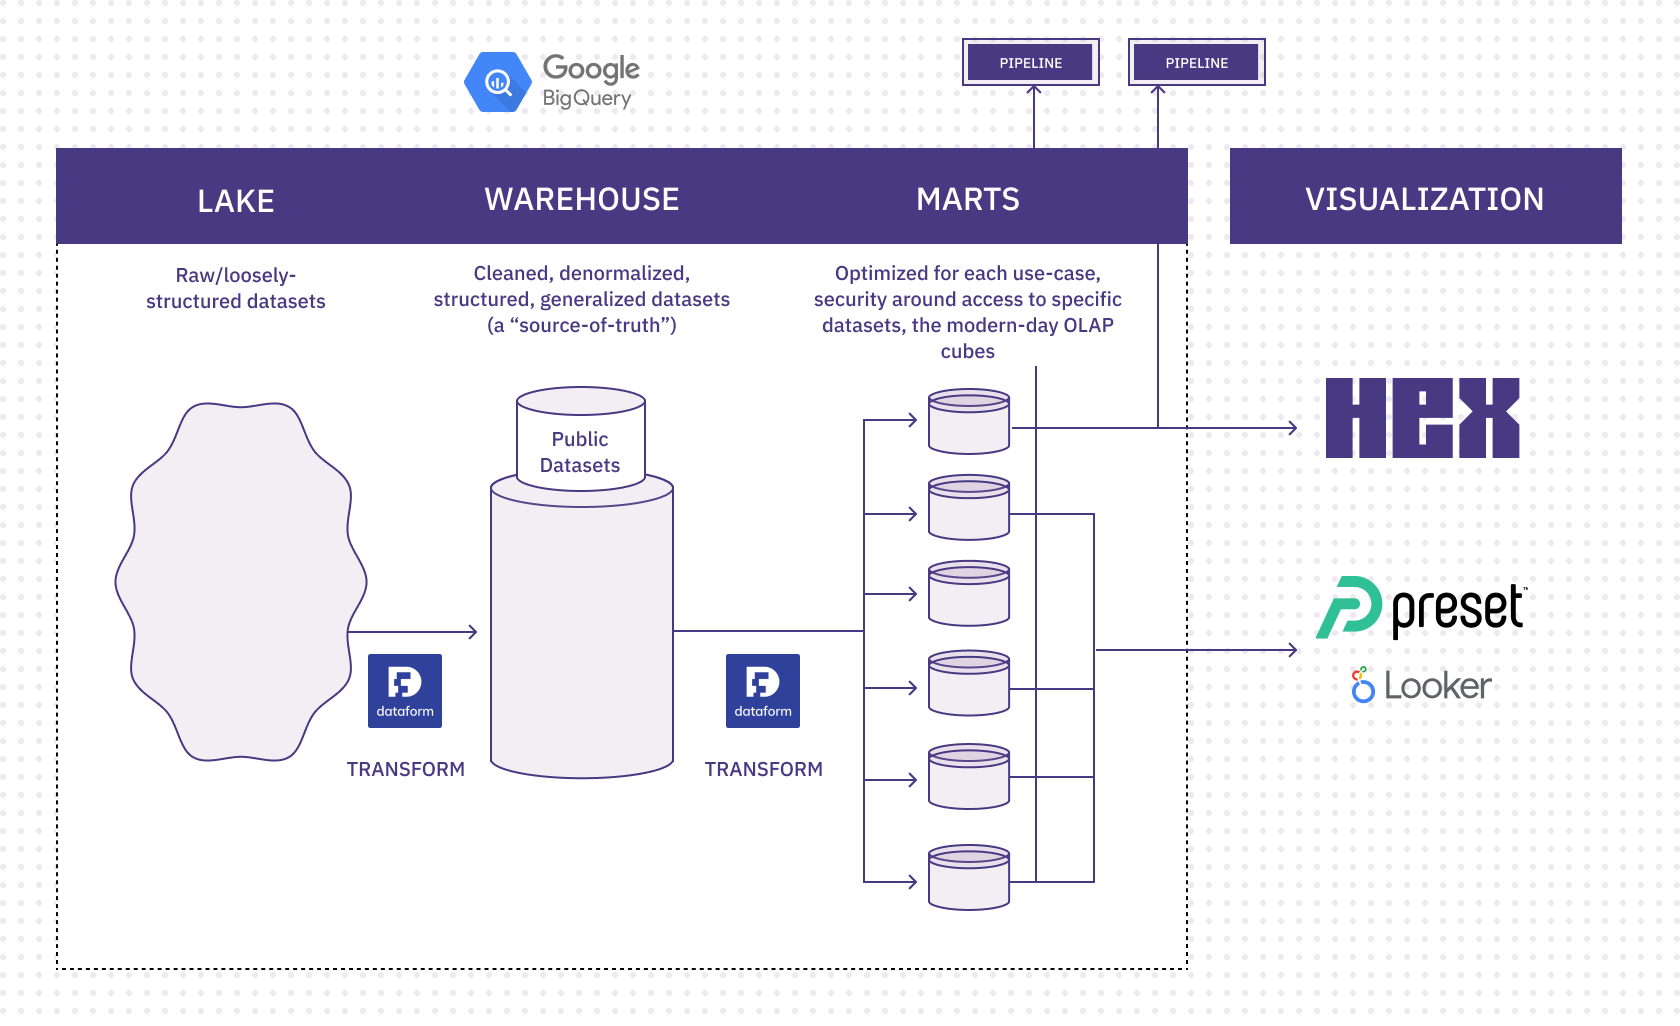
Our data stack is built on Google Cloud Platform. We transform our stored data using an ELT powered by Google Dataform, which uses a blend of SQL and JavaScript to build dynamic data pipelines.
The Analytics team leverages tools like Amplitude, Hex, Preset, and Looker to deliver compelling stories to stakeholders across the organization. We also have in-house tools and processes to handle event governance, implementation, and metadata tracking.
While most of the organization uses Google Suite (Drive, Docs, Sheets) for presentations and share-outs, traditional documents lack the ability to convey complex charting and reporting. We needed a more powerful solution that allowed us to intertwine code and visuals while supporting rich formatting and advanced sharing.
Throughout our growth, we’ve used Hex for exploratory analysis, data validation, and web apps to improve our workflow. It replaced a clunky process consisting of CSVs, SQL files, Google docs/decks, and Jupyter notebooks. In this article, we’ll talk a bit about how Hex has enabled robust exploratory analyses and give a few examples of projects we’re especially proud of.
Setting the Stage for Exploratory Analysis
Analytics at AllTrails is built on exploratory data analysis. When a stakeholder has questions about how our users behave, it’s up to Analytics to provide quantitative methods and data that illuminate our trail-goers’ behavior.
With Hex, we can start from a point familiar to analysts— writing SQL. Hex’s query caching allows us to write and store queries in hosted notebooks, preserving both the query and making it simple to access and visualize data from our warehouse (BigQuery). We’ve found Hex’s integration with our warehouse to be simple, reliable, and fast.
Rather than dealing with custom JDBC connectors to build custom libraries for executing queries via Jupyter notebooks (or importing CSVs), we can dive right into analysis. Hex’s managed environment abstracts away notebook configuration and resource monitoring (you can easily adjust compute). Hex is preconfigured with most Python analysis and visualization packages, drastically simplifying the development environment. Best of all, queries go directly to pandas DataFrames— the most common way of interacting with row-based data in Python.
For those projects that require lesser-known libraries, a quick pip command can be used— we’ve found the functionality to be more than sufficient for our needs and the possibility of pulling in custom libraries through GitHub is there if we need it.
Diving into data notebooks
Jupyter notebooks are popular for good reason— they fit a niche between a dashboard, which is often more permanent and time intensive than an analysis, and a document, which lacks dynamic charting and stored code.
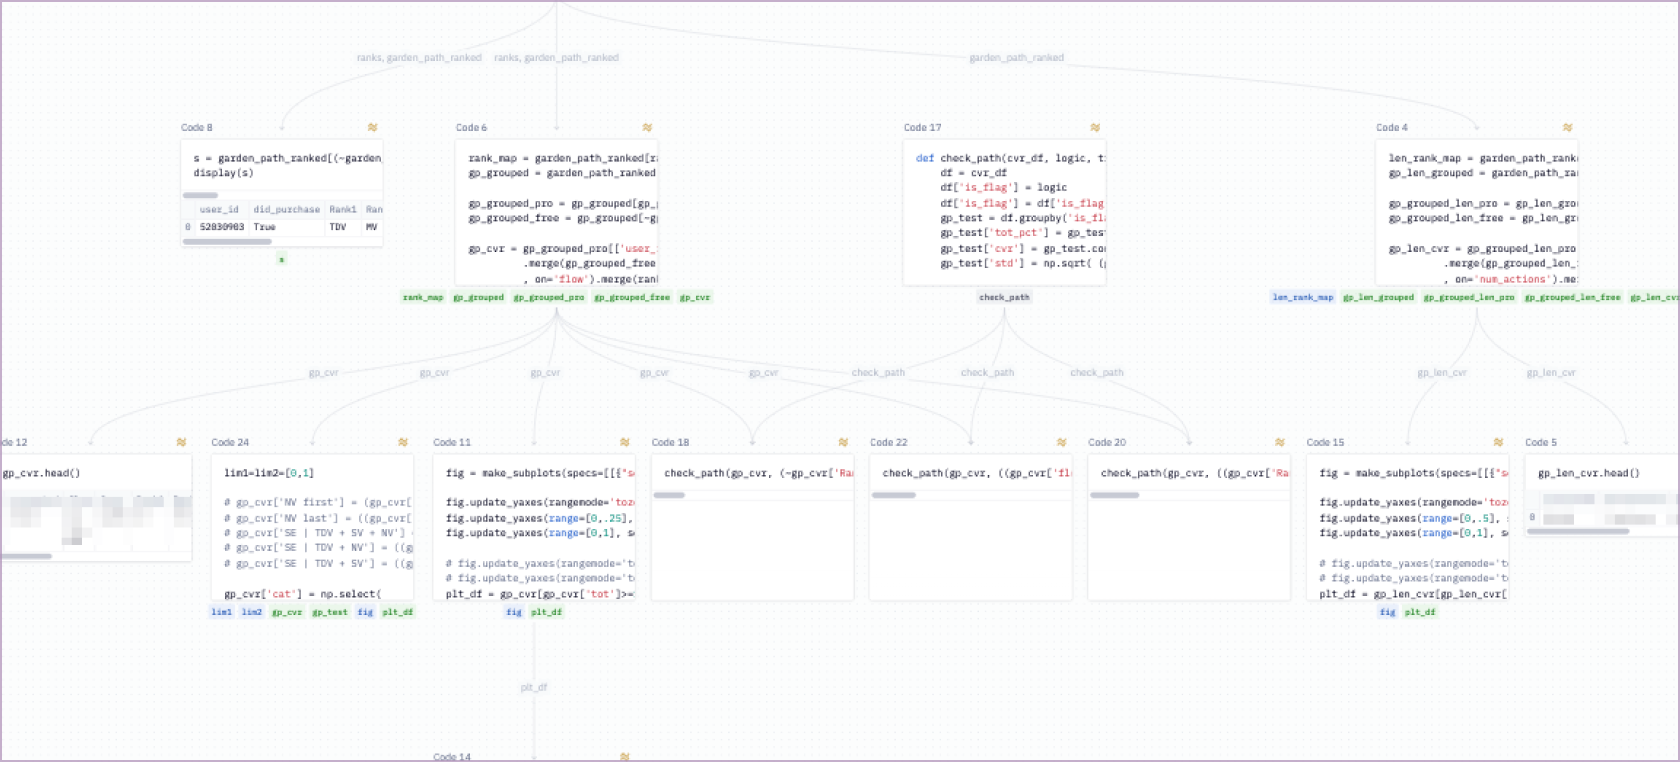
Hex builds on existing Jupyter notebook functionality while reducing complexity. Dynamic markdown allows us to reference notebook variables, input mathematical functions (Latex!), and build beautiful text documents that help analysts better tell a story.
Should our code change (as it often does), Hex’s dynamic variable refactoring replaces downstream variables as they shift. Auto-rerun handles dependent cells, eliminating the headache of triaging dependencies in Jupyter notebooks.
Sharing analytic outputs with stakeholders
Once the core analytics work is complete, Hex allows us to use our plotting library of choice (Plotly is a favorite) to customize charts, enable interactivity, and create rich Markdown to express our thoughts and methods. Hex even supports dynamic markdown variables, so we can embed updating values in our summaries and comments.
Using a published app, we can alter the depth of our analysis to meet our stakeholders’ desired level of specificity. Short-form analysis can be tailored to C-Suite executives, while deep-dives can be reserved for more technical teammates. Robust markdown formatting carries a level of flexibility that lets us use the same platform for a number of cases.
Hex’s publishing feature ensures data is saved-off for future reference. The published app is visually immaculate and adding teammates is as simple as a Google Doc. With Hex, we can be confident that our dataframes and plots can always be re-accessed. This is crucial for reproducing analyses and building off prior learnings.
Case Studies
That’s just a high-level overview of our process. Since adopting Hex, the data team has churned out a steady stream of analysis, from internal benchmarking to evaluating the effectiveness of metrics. Here are some case studies of Hex in action at AllTrails.
Examining rolling metrics
Daily, weekly, and monthly active users are common metrics among product-led organizations. Challenging the status quo, we were able to use Hex to assemble a report making the case for surrogate metrics in experimentation and dashboarding, presenting a robust analysis that visualized the effect of using a rolling window for these metrics over our previous, static definition.
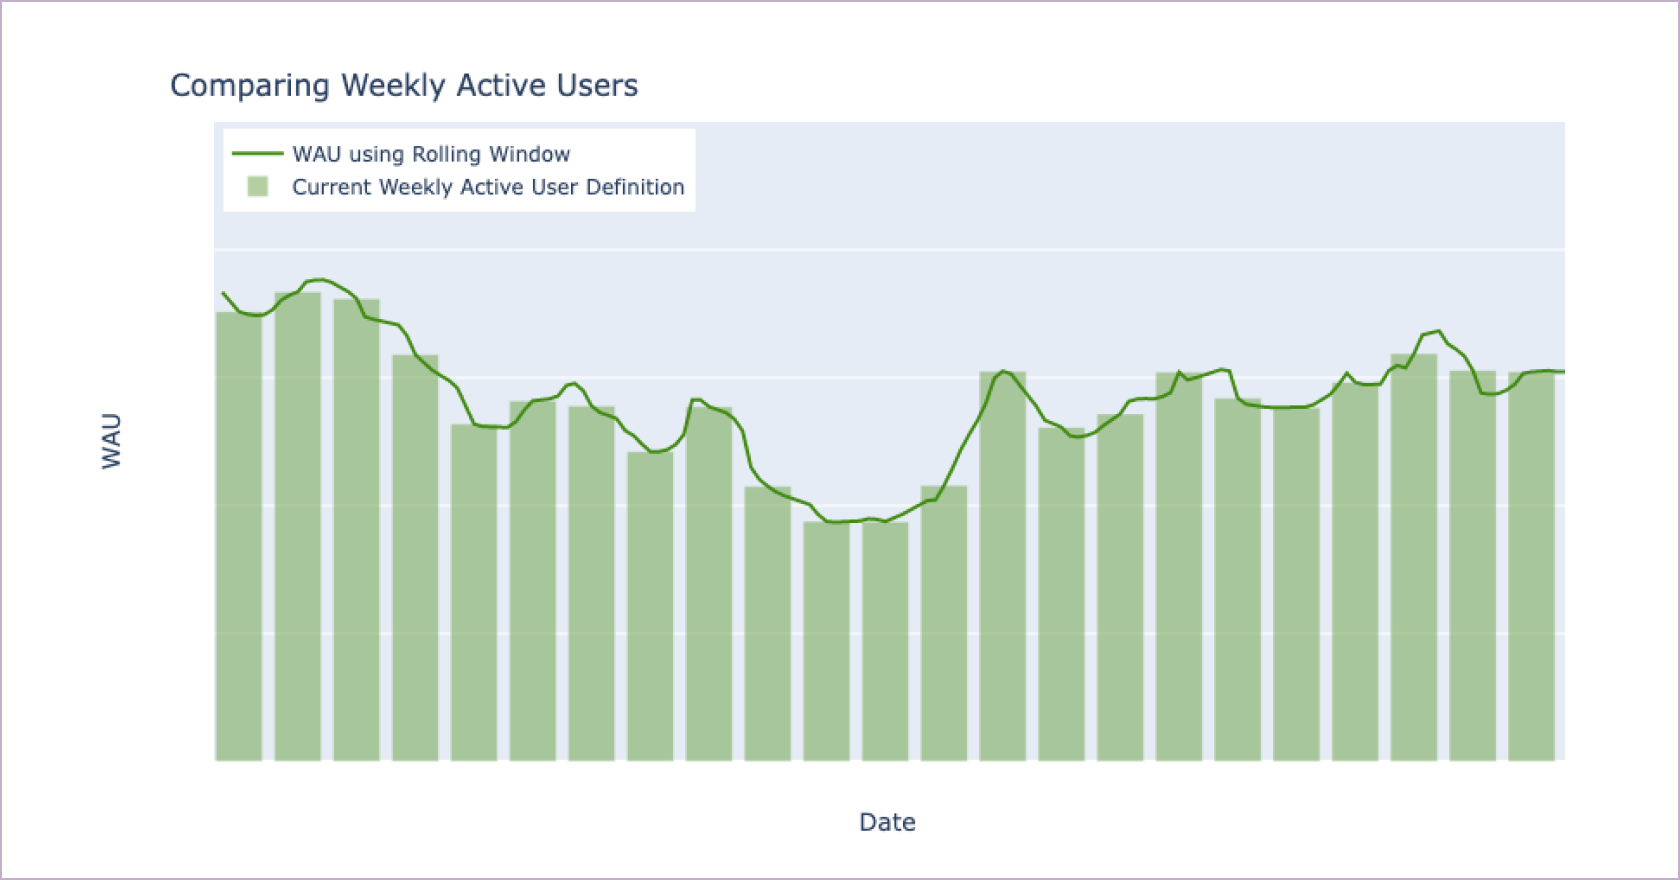
By weaving interactive graphics into our notebook, the analytics team was able to convey downstream impacts to company leaders, making the case for a switch in how we measure user activity.
Speeding up development
We’ve also found Hex incredibly useful for speeding up Python/SQL development. In many cases, it is simpler and faster to pop open a Hex notebook and plug in the functions we’re aiming to test, then analyze the output to ensure validity.
Before Hex, this would require extracting CSVs from our warehouse (or finding some other way to create test data), standing up disparate Jupyter notebooks, and messing with packages and dependencies before finally being able to start building new code.
Hex’s connection to our warehouse makes it simple to pull in sample data and it’s powerful enough to handle some complex libraries and computational tasks. The cell-based structure makes swapping functions and iterating a breeze.
All in all, we’ve shortened processes that would have taken hours on average using the “old way” down to minutes or seconds with Hex.
Building tools & internal data apps
Hex’s capacity isn’t limited to exploratory analysis— here are a few internal tools we’ve built using notebooks, dynamic variables, and published apps:
A/B Testing Statistical Power & Sample Size Calculator: an interactive app for calculating and visualizing sample sizes for A/B tests. Our calculator accepts test criteria as inputs and assists in determining an appropriate run-time and minimum detectable effect (MDE) given a number of variants, conversion rate, and sample size.
QA Tooling: a web app that allows our QA team to check experiment bucketing via a query to our data warehouse. This process replaced costly back-and-forth between Analytics and QA each time they had to manually validate that users were in a particular test group in the old environment. The web app saves our team hours of time and resources each month;. By leveraging partitioning on the source table, Hex quickly executes the queries with low scan costs.
Wrapping up: Analytics & Life at AllTrails
It’s been an awesome experience learning and growing at AllTrails. Though much has changed, the demand for quality exploratory analysis has not. Hex has enabled our team to improve both the quantity and quality of analysis over the past year and has provided a robust platform for re-accessing learnings and building on our hypotheses.
AllTrails has provided a fundamentally different job experience from any other I’ve had. I’d be remiss if I didn’t spend some time discussing the unique nature of the company and the fulfillment that comes from chasing a mission we’re truly passionate about.
Working on a product we use, manipulating trail data, and hiking/climbing/exploring come together to create a vibrant and exciting work culture, even in a distributed environment. It’s inspiring to show up (virtually) with coworkers who are all moving towards the same goal.
Abiding by our core values, we’re striving to make the outdoors more accessible by delivering a reliable, quality experience to our users. Being a part of a mission-driven team has been incredibly rewarding for me.AllTrails values
Spread the stokeSharing great trails with like-minded nature lovers is what we live for.
Lead by exampleThe trails we love are the legacy we leave for future generations.
Embrace changeFrom fallen trees to sudden rain, obstacles are what we make of them.
Stay down to earthOur love of the trail is at the heart of everything we do.
All are welcomeHikers, bikers, roamers, strollers — if you're out there, we're with you.

If this is is interesting, click below to get started, or to check out opportunities to join our team.