Blog
How GameChanger used LTV modeling to predict and prevent churn
LTV clarified the "what" and "why" questions about churn


You might be familiar with the nation-wide franchise Dick's Sporting Goods, but unless you have kids in youth sports, you might not know about GameChanger, its popular and family-loved app.
The app lets families and friends watch their favorite youth team players during live games and gives access to highlights and game archives while also helping coaches keep score and set lineups.
With GameChanger’s array of users — paid and free with seasonal gains and drop offs — they needed a clear lifetime value metric at the user level (some companies just do this at the business level).
This would let marketing, finance, and product create more efficient action plans and strategy and also clarify predictions of churn due to seasonal fluctuations. The data team set out to create a clear understanding of the monetary value that users provided for GameChanger and how it would change over time.
Watch the full GameChanger story in our Select Session.
Redefining lifetime value (LTV)
To do the research to support this work, the data team spun up a Hex notebook which gave them a collaborative environment to do all the data preparation and exploration. Then it was time to explore LTV.
In its simplest form, LTV has two components:
- “Lifetime” which measures a subscriber’s time to churn
- “Value” which measures a user’s monthly value in dollars (e.g., if a user stays on the app for 10 months, how much money does that translate to?).
LTV is the result of multiplying these two numbers together.
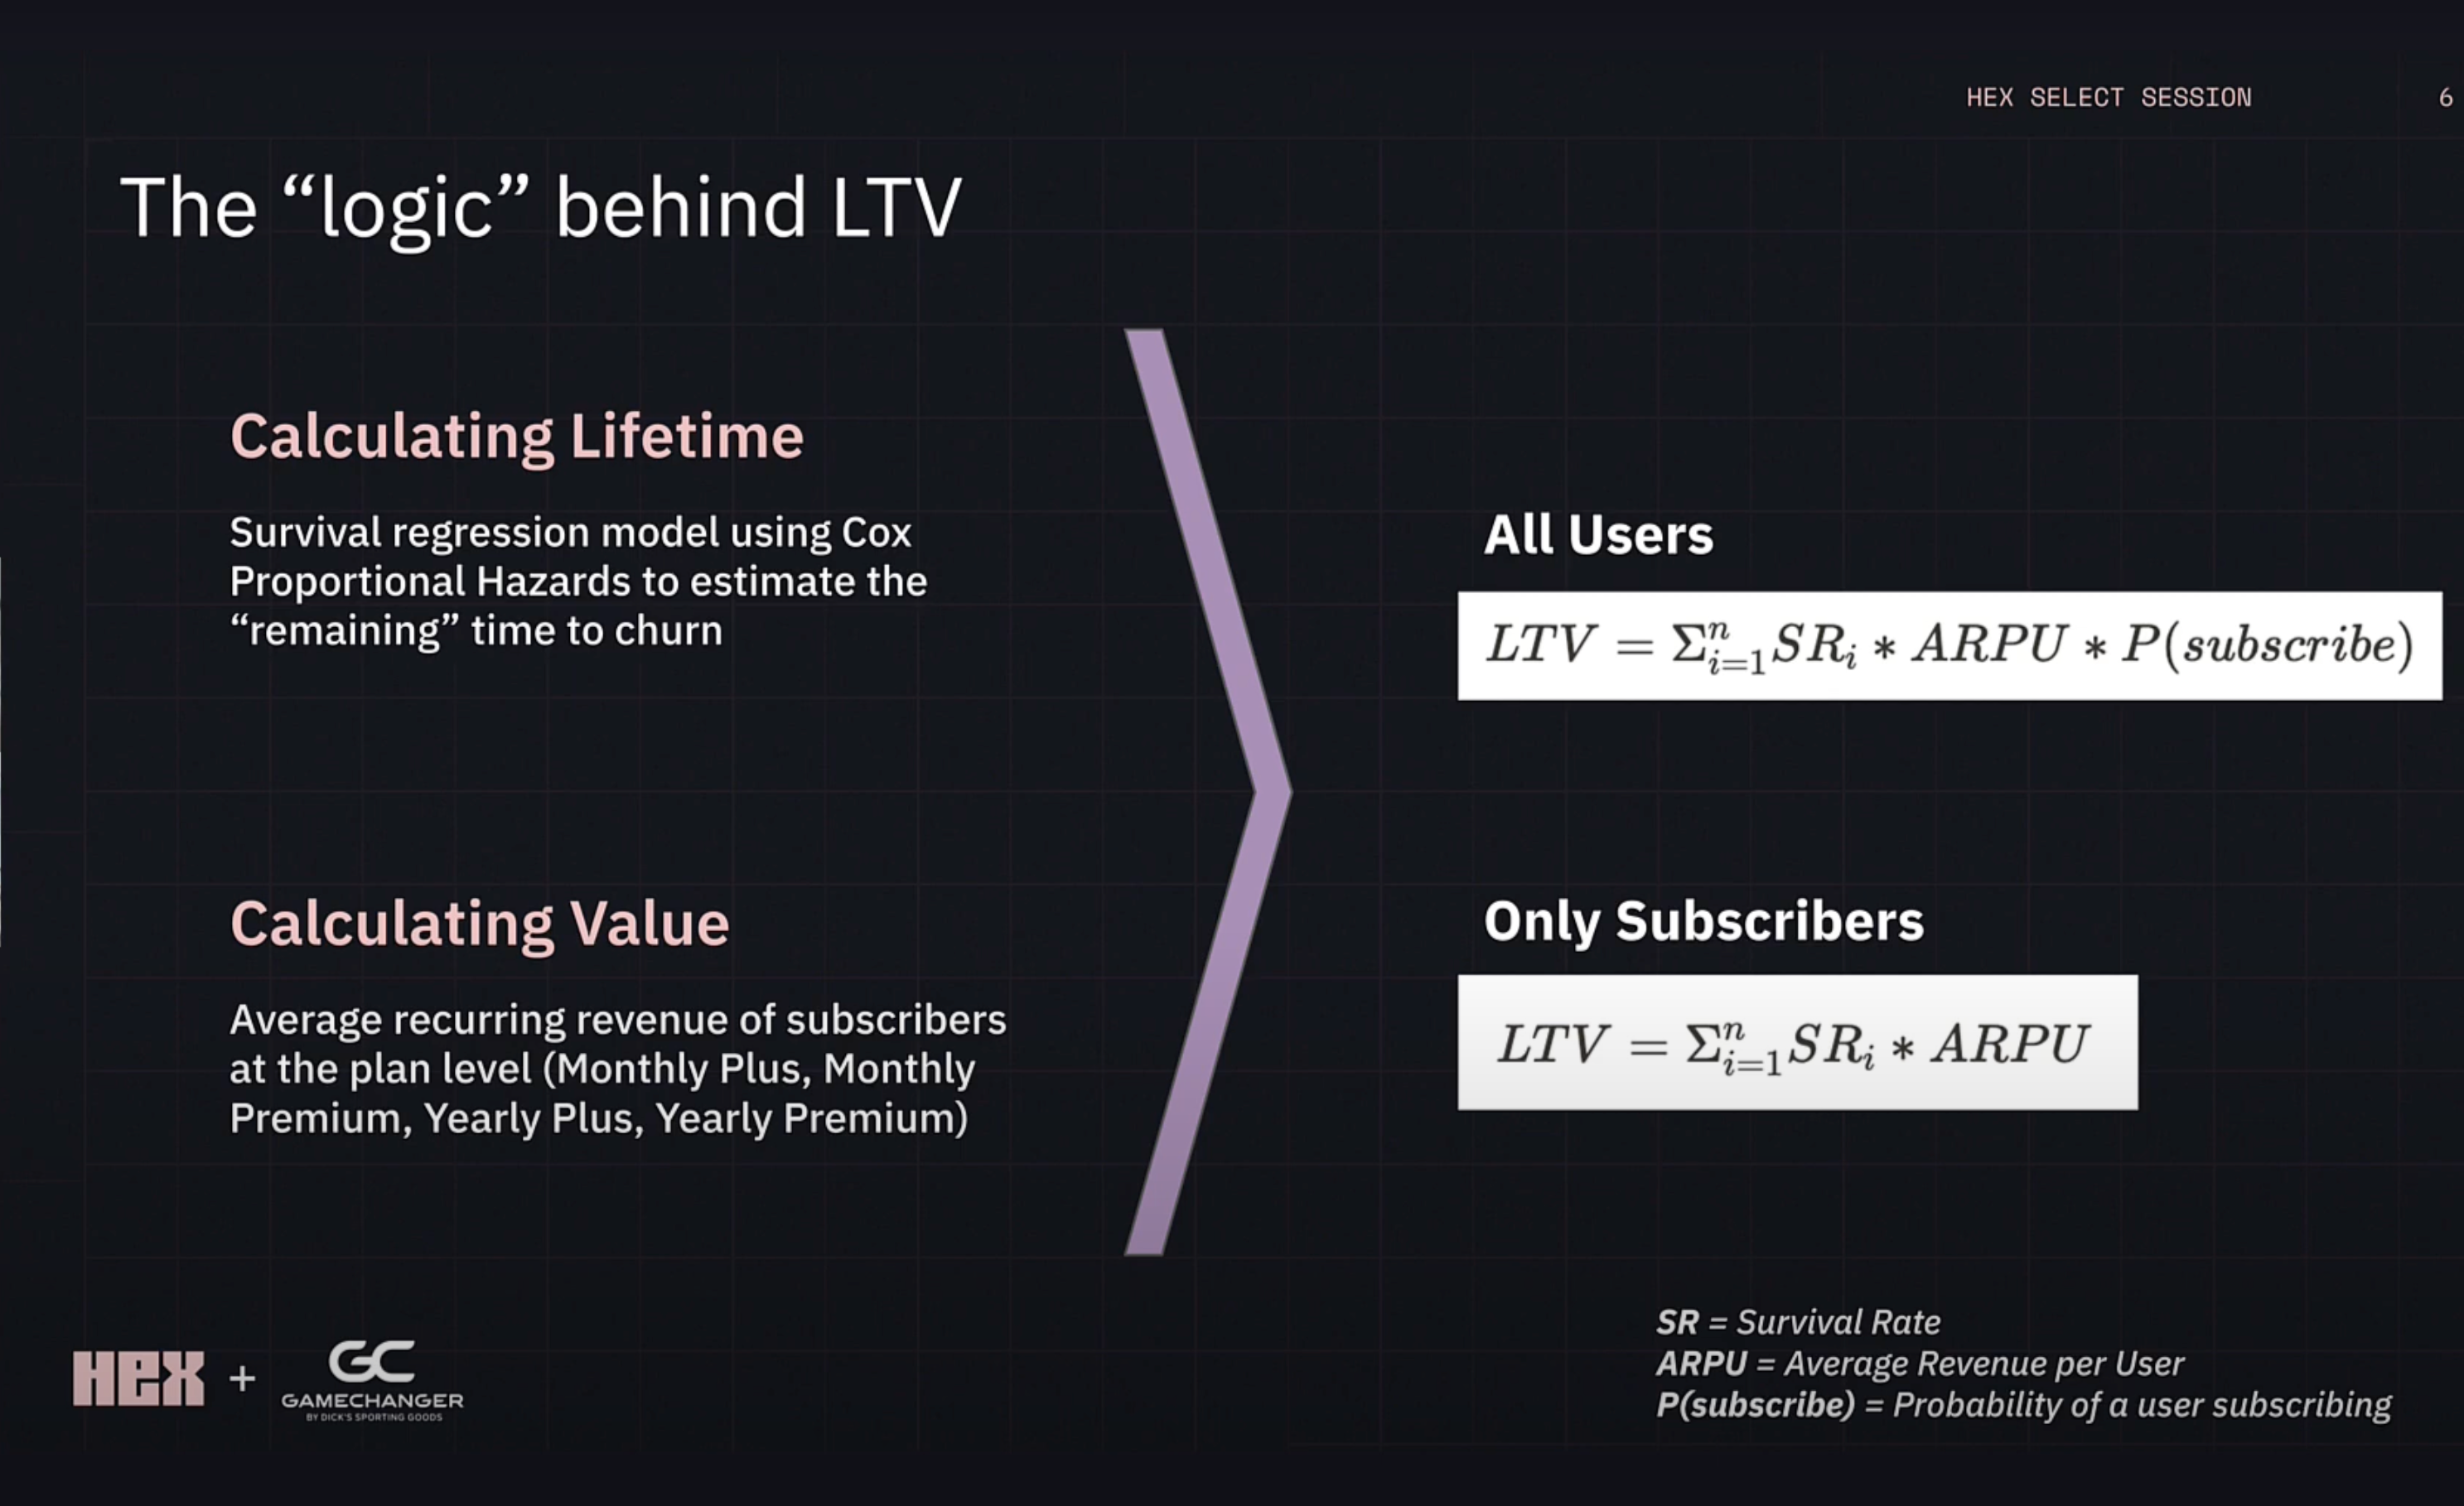
They looked at LTV of paid users first (knowing they could build upon that formula for free users).
To get the “Lifetime” of a paid user, they used survival regression to estimate a subscriber's time-to-churn.
To get the “Value” of a paid user, they used the metric average revenue per user (ARPU), which changes based on which of the four different subscription plans a user is on.
LTV of free and paid users
Since the app has both free and paid user plans, a LTV metric that only focuses on paid users or subscription dollars misses the value that free users provide via advertising dollars. Not only does this leave a gap in understanding the monetary contribution of all users, but it also means their team was unequipped to see when and how free users could convert into paid ones.
In order to build LTV accurately of free users, they modeled not just their advertising potential, but their likelihood of them eventually subscribing. The data team could then use that complete view and then bring it together with paid user LTV to model growth that is based on all users.
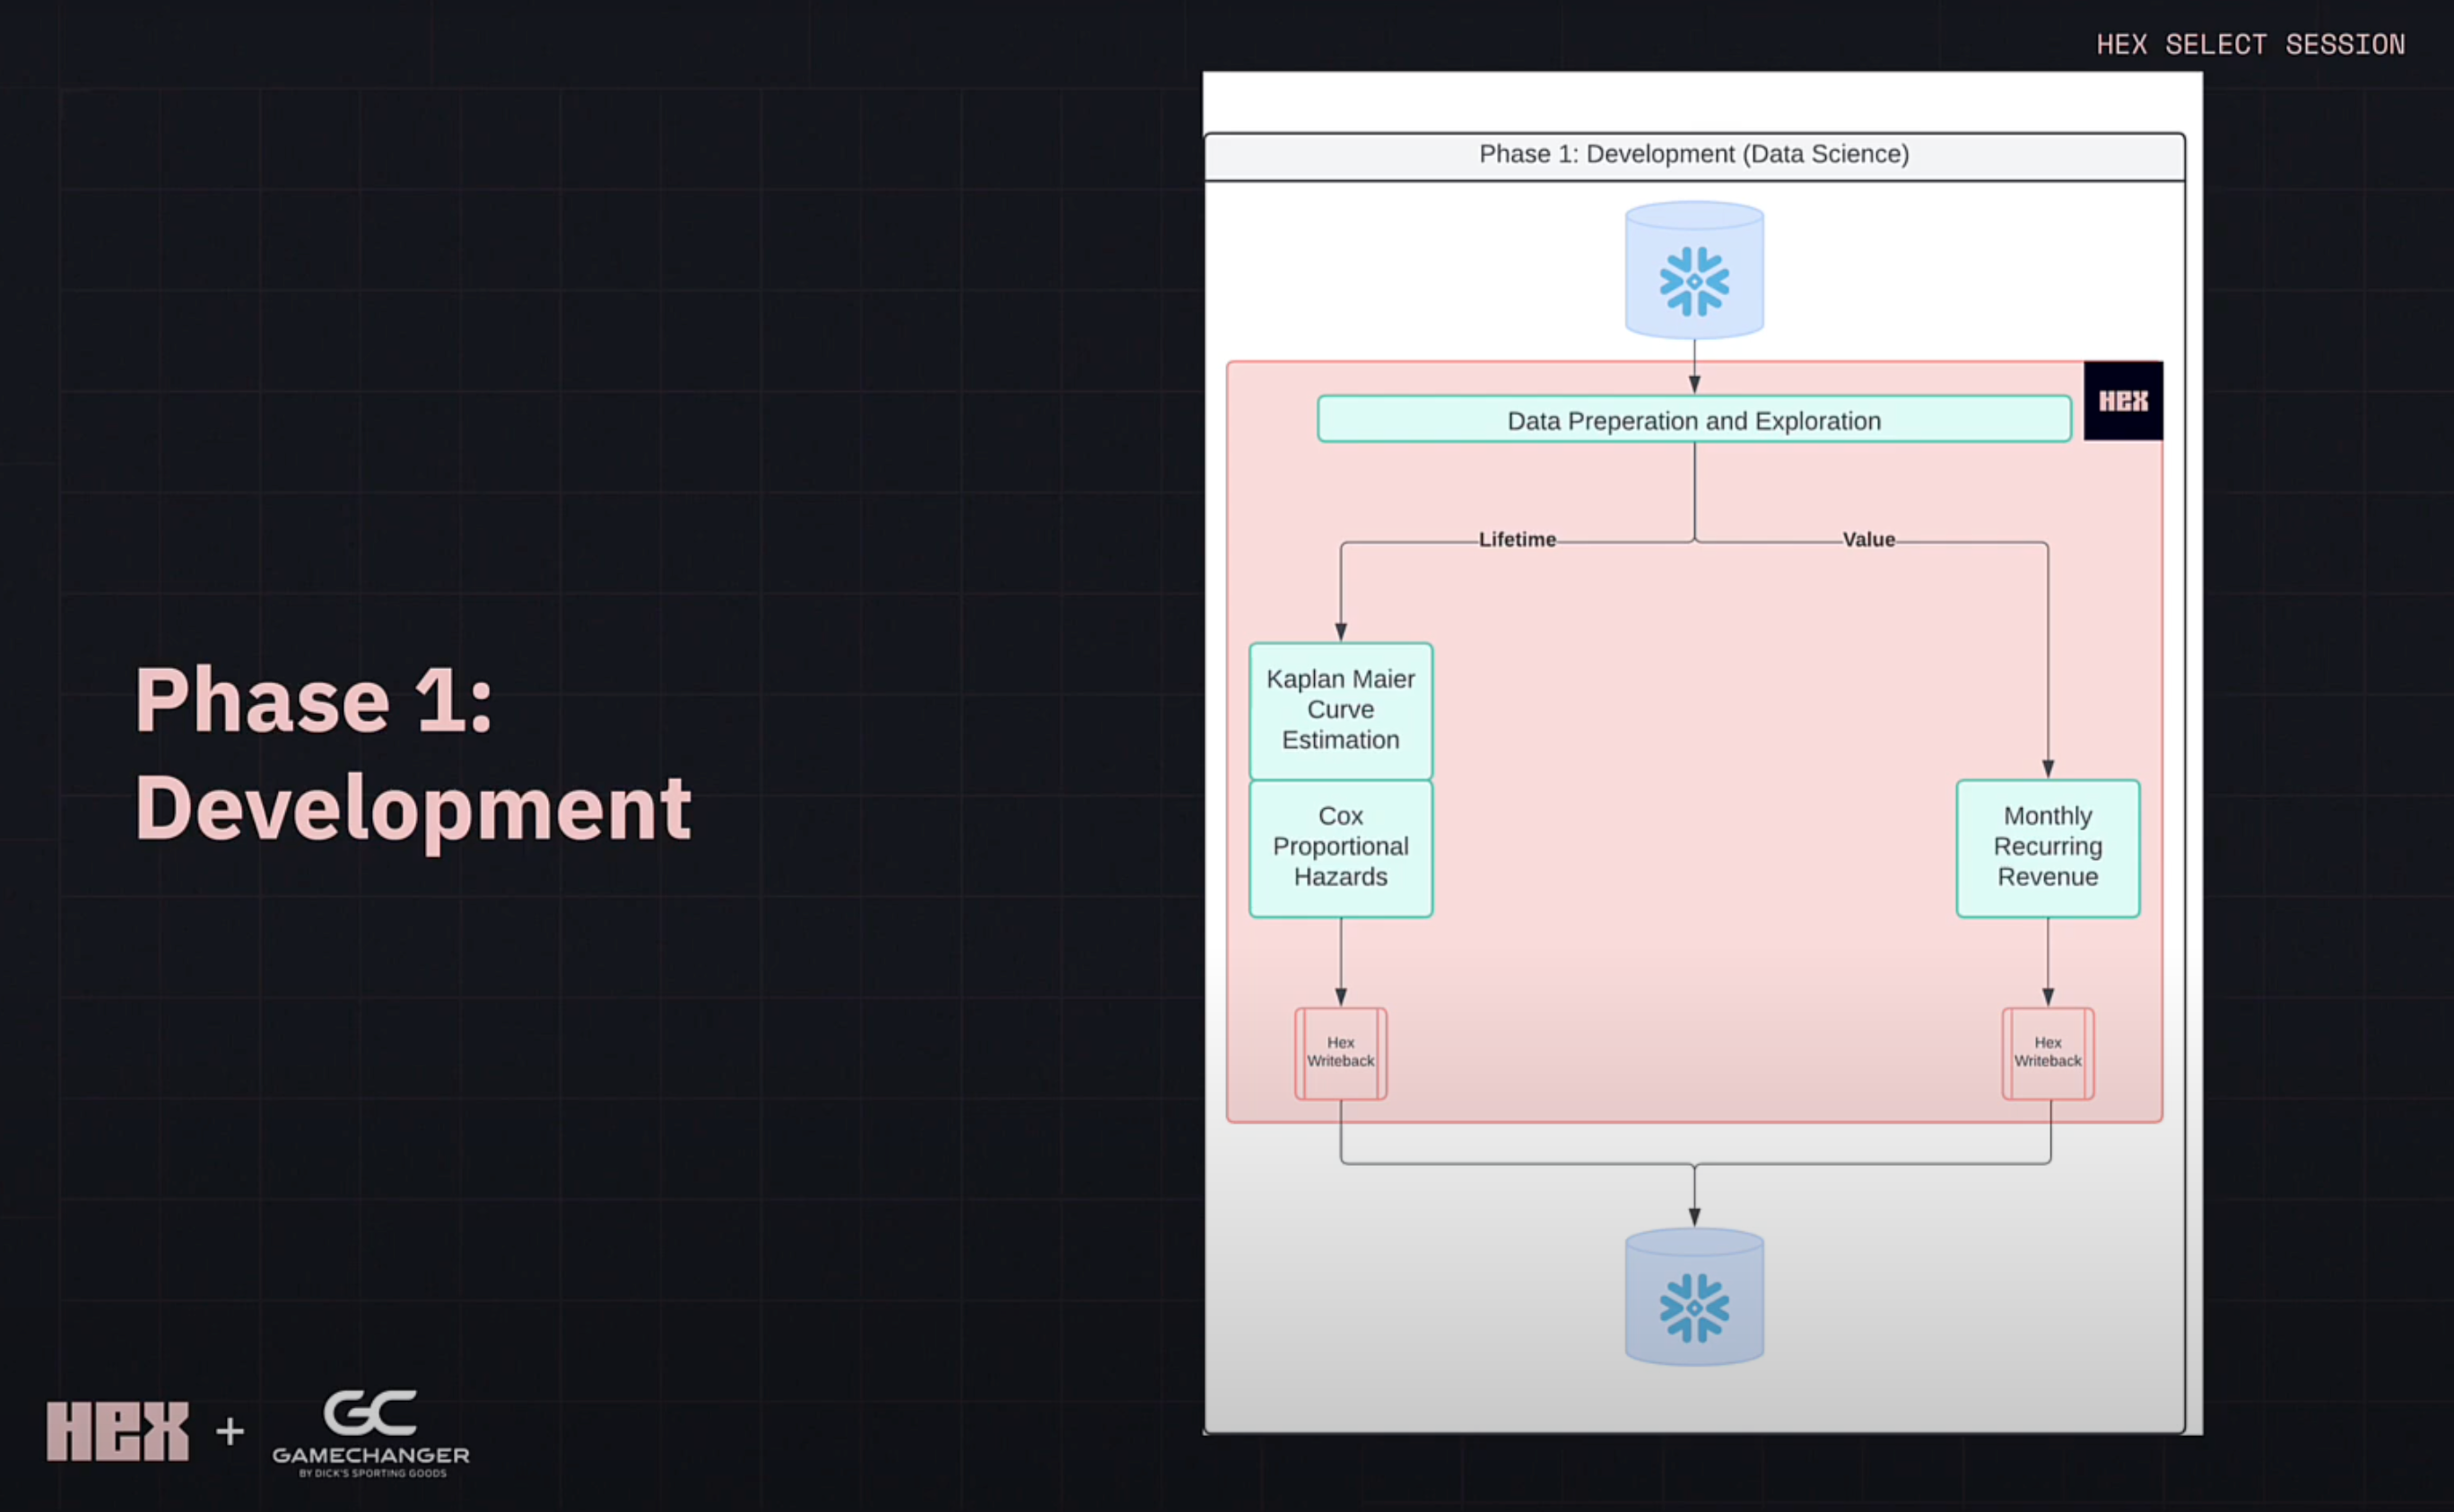
Modeling Lifetime and Value in Hex
They pulled data from Snowflake to have two different models run on lifetime and value metrics in Hex, which then dumped the results of those back into Snowflake. Hex’s multimodal workflow made it easy to keep the MRR work in SQL, and the Lifetime metric work in Python and SQL, all in the same place.
Getting new LTV metrics ready to share with the company
With the lifetime and value components established, the data team used Hex to port the insights they were producing into Snowflake. Data engineers then took the data from Snowflake, modeled it in dbt, and exposed the data to end-users. They were able to automate much of the work by using Hex’s built-in scheduler to schedule weekly data dumps from Hex Notebooks into to Snowflake.
Before sending out their new metrics, the data team looked at general accuracy metrics to gauge log likelihood and concordance. “Those have to look good to train the model and they did,” Nihal said. For even more confidence, the data ran the workflow weekly for a month and then compared it to actual churn results. “We were happy with the outcome.”
LTV clarified the "what" and "why" behind churn
The insights from Hex were ported into their BI tool, where business teams could answer "the what" questions of churn. They could see trends of LTV across different user segments like and understand the current state: How has churn changed over the last two quarters? What’s the average LTV of a subscriber?
The product, marketing, and finance teams all began using LTV as an essential, instrumental metric for generating better forecasts and strategy.
- The product team uses LTV to more deeply understand specific user segments
- The marketing team uses LTV to analyze paid media performance by marketing channel
- The finance team uses LTV (among other metrics) to improve financial revenue forecasting
In Hex, they were able to dig into the "the why" questions behind churn. It was key for model explainability where the data team could see: What are the most important features within your ML model that are affecting churn? Are there any interactions between various features usage and order of usage that impact churn?
The LTV model could also be used to do revenue forecasting. “All we had to do was bring in a new model to answer our new subscriber growth and forecast questions,” Nihal said.
How the data team is supporting the company with LTV
The behavioral dynamics of GameChanger's users are sometimes hard to parse and predict because the company has free and paid features, numerous subscriber plans, and multiple predictors of when a user might upgrade or churn. But through experimentation, accuracy checking and models that check themselves, GameChanger is able to have a much clearer picture of growth.
Without the results of this work, GameChanger would have been left with a shallow view of its user base. The behavioral dynamics of user types would have been inscrutable at a granular level, and other teams would have struggled to predict churn or improve conversion rates.
Now, GameChanger has a better understanding of LTV and can offer sophisticated prediction models that use LTV to predict churn. From the data team to the finance and marketing teams — the family-loved app is now much better equipped to build and maintain a more reliable, more predictable business.
For the full behind-the-scenes workflow, watch the GameChanger Select Session.
If this is is interesting, click below to get started, or to check out opportunities to join our team.