Blog
Introducing: “No-Code” Cells
Bringing together SQL, Python, and no-code in Hex’s magical notebooks
Hex has already changed the way thousands of people do data work with SQL and Python, and today we're expanding further with a suite of UI-driven cells in Hex: Pivot, Filter, and Writeback.
These “no-code” cells complement existing code-based data science and analytics workflows in Hex, allowing users to go back and forth between code and UI, and empowering everyone to do many of the most common data manipulation tasks (and avoid winding up in StackOverflow again!)
Why the obnoxious quotes around “no-code”? Well, because they’re actually code, Hex is just writing it for you. Each cell can actually be converted into code, so you can see what’s going on, or go off-roading yourself.
If you’re an existing Hex user, these are live [flips feature flag] now! If you have yet to try Hex, you can give it a spin here.
Low floor, high ceiling
In the very first post for this blog, I wrote:
The beauty of code is its infinite flexibility, and the tools of the future should unleash, not constrain, a users’ creativity. This may mean less code. But not none.
This conviction is unchanged. At Hex, we set out to build a platform with a “low floor, high ceiling”: accessible to novices, while not constraining more technical data science users. The first step was making code-based data analytics workflows more accessible, with a fully-hosted environment, first-class SQL and Python features, and an intuitive UX.
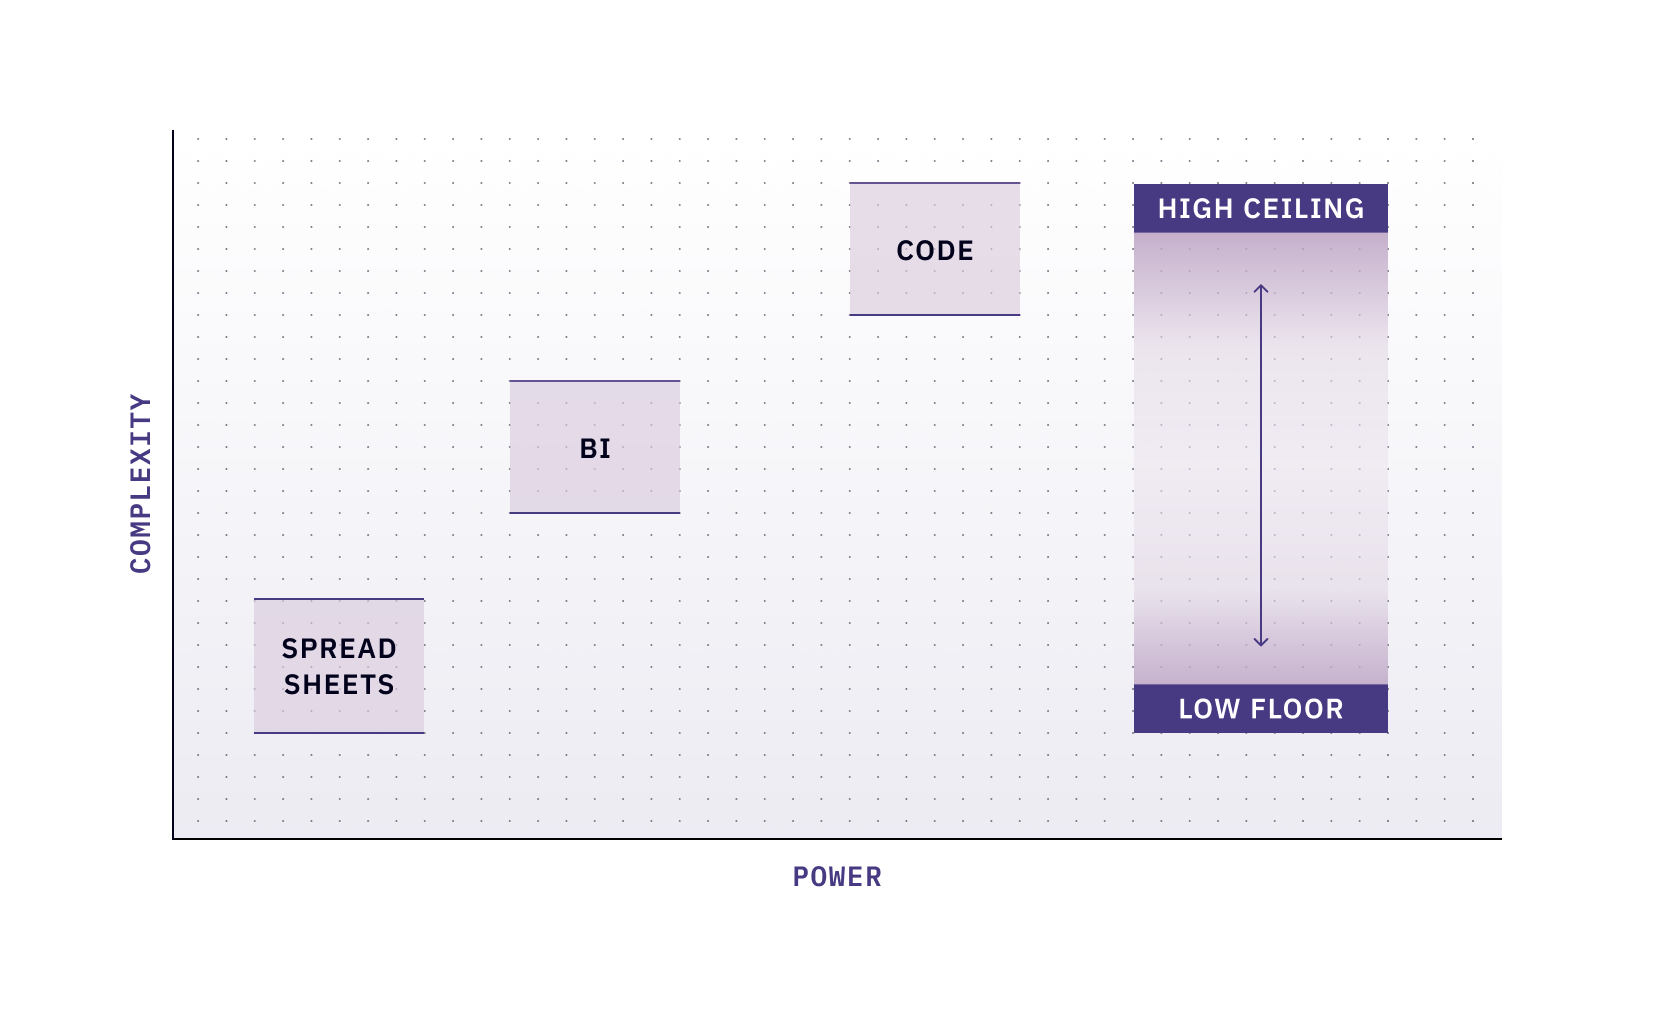
Two years on, it has been amazing to see this barrier-lowering in action. Some of our most devoted power users never touched a data science notebook or built a data app before picking up Hex.
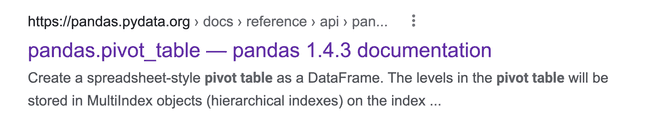
But – not everyone is going to learn every possible function in SQL or Python. Take me as an example: I have been writing analytics code for the better part of a decade (and started a company built for it!) but I can never remember the exact syntax for a df.pivot (or is it pivot_table(df)?), without clicking on the purple link.
Interacting visually can also just be a better experience. Many analytics workflows benefit from immediate interaction and manipulation with a UI. This is why last year we introduced UI-driven charts and tables that allowed users to build beautiful no-code data visualizations. Even if you know code, this is just a better experience.
Our users tell us all the time how all of this this has changed the way they work with data, and now, we’re taking that a step further.
Bringing “no-code” cells to Hex
These new “no-code” cells live right alongside code-first SQL and Python cells in Hex, and return dataframes that can be used downstream. You can easily go back and forth, building a chain mixing-and-matching UI and code, and visualize the logical flow in the Graph View.
But wait – surprise! They’re actually code. Hex is just writing it for you behind the scenes. And we give you direct access to it if you want to get your hands dirty: each of these cells has a Duplicate as Code button, allowing you to “eject” to view or edit to your heart’s content.
This means you can use these UI-driven cells not only as helpful workflow upgrades, but also as templates to help learn new things, or jumping-off points to dive into more complex operations.
Meet the Cells
Pivot cell
Perhaps the most powerful feature of spreadsheets is the pivot table. Now, we’re bringing these to modern data analytics workflows, with a powerful built-in cell:
Under the hood, pivot tables are really doing two things: aggregating, then pivoting. We break this out for you in more detail when you eject out to code, returning a SQL cell for aggregation and a Python cell for pivoting. You can use the pivot_result output of a pivot cell in other Hex cells, or access raw .aggregated or .pivoted dataframes on the output object. Check out the docs for more details.
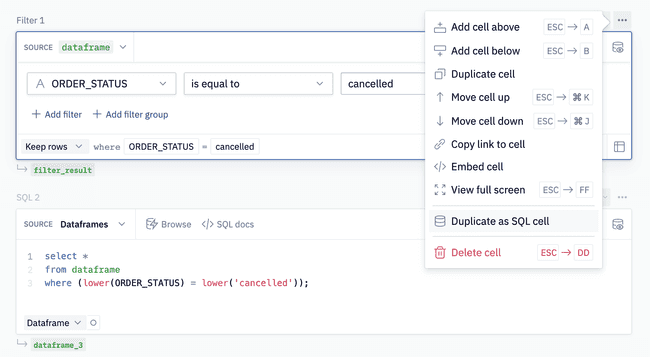
Filter cell
The name kind of says it all – these filter dataframes! You can add individual filters, or groups, and toggle whether the operation keeps or removes matching rows. You can also check out the compiled SQL to double-check operations, or learn new SQL syntax. Check out the docs for more details.
Writeback cell
This is a fun one – you can now send dataframes back to the database from your logic.
We have seen users doing this “by hand” for a long time, meticulously writing out database connection logic in Python. The Writeback cell simplifies this enormously:
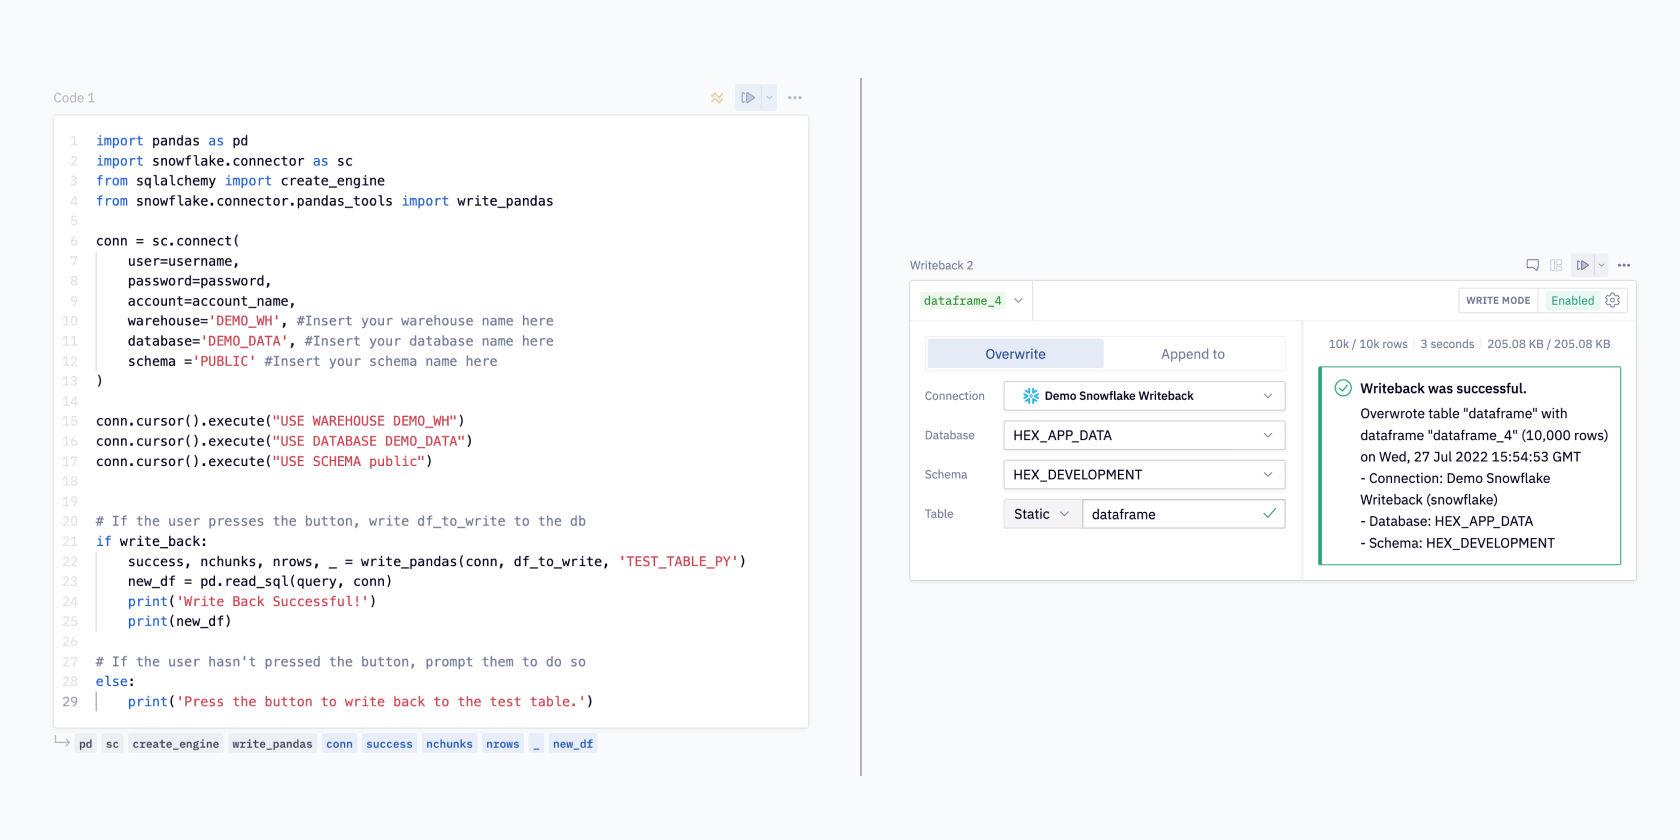
To make this even easier, we have also added a Writeback function to the hex_toolkit object, making it simple to off-road and do programmatic writebacks beyond what’s enabled in the cell itself:
if hex_run_context in ["logic"]:
    import hextoolkit
    hex_data_connection = hextoolkit.get_data_connection("Demo Snowflake Writeback")
    writeback_metadata = hex_data_connection.write_dataframe(df=dataframe, database="HEX_APP_DATA", schema="HEX_DEVELOPMENT", table="dataframe", overwrite=True)
Check out the docs for more details.
Chart cell
This isn’t technically new, but we have made a ton of recent improvements, including more visualization types, better customization, and infinite scale (no more 5k point limit!)
And, like the other cells, this can also be ejected out to code – you can see the full VegaLite spec backing the charts, and edit and customize however you want.
Long live code!
Going back to my old blog post:
Too many no-code tools are setting their users up to be artificially constrained today (when they inevitably hit the limits), and disadvantaged tomorrow (when they haven’t learned any transferable skills).
With Hex, we want to empower as many people working in data science and data analytics as possible while avoiding artificial constraints, and today’s release is just one step in that journey.
More to come…