Blog
Introducing VegaFusion 1.0: now a Hex OSS project
Infinitely scalable data visualization, with a more permissive license

Building great visualization products is hard.
The first obvious challenge is the UI. Building an intuitive, yet flexible, interface for visualization isn’t as easy as slapping a frontend on a plotting library. At Hex, we actually just completely re-built our chart cell, because our first attempt wasn’t cutting it.
Even harder, however, is getting the backend right. There are two basic ways to approach this:
- Static visualization libraries like Matplotlib, Seaborn, or GGPlot render charts on the server side, and display them as static images. This means they can render large-scale data, but the outputs aren’t interactive.
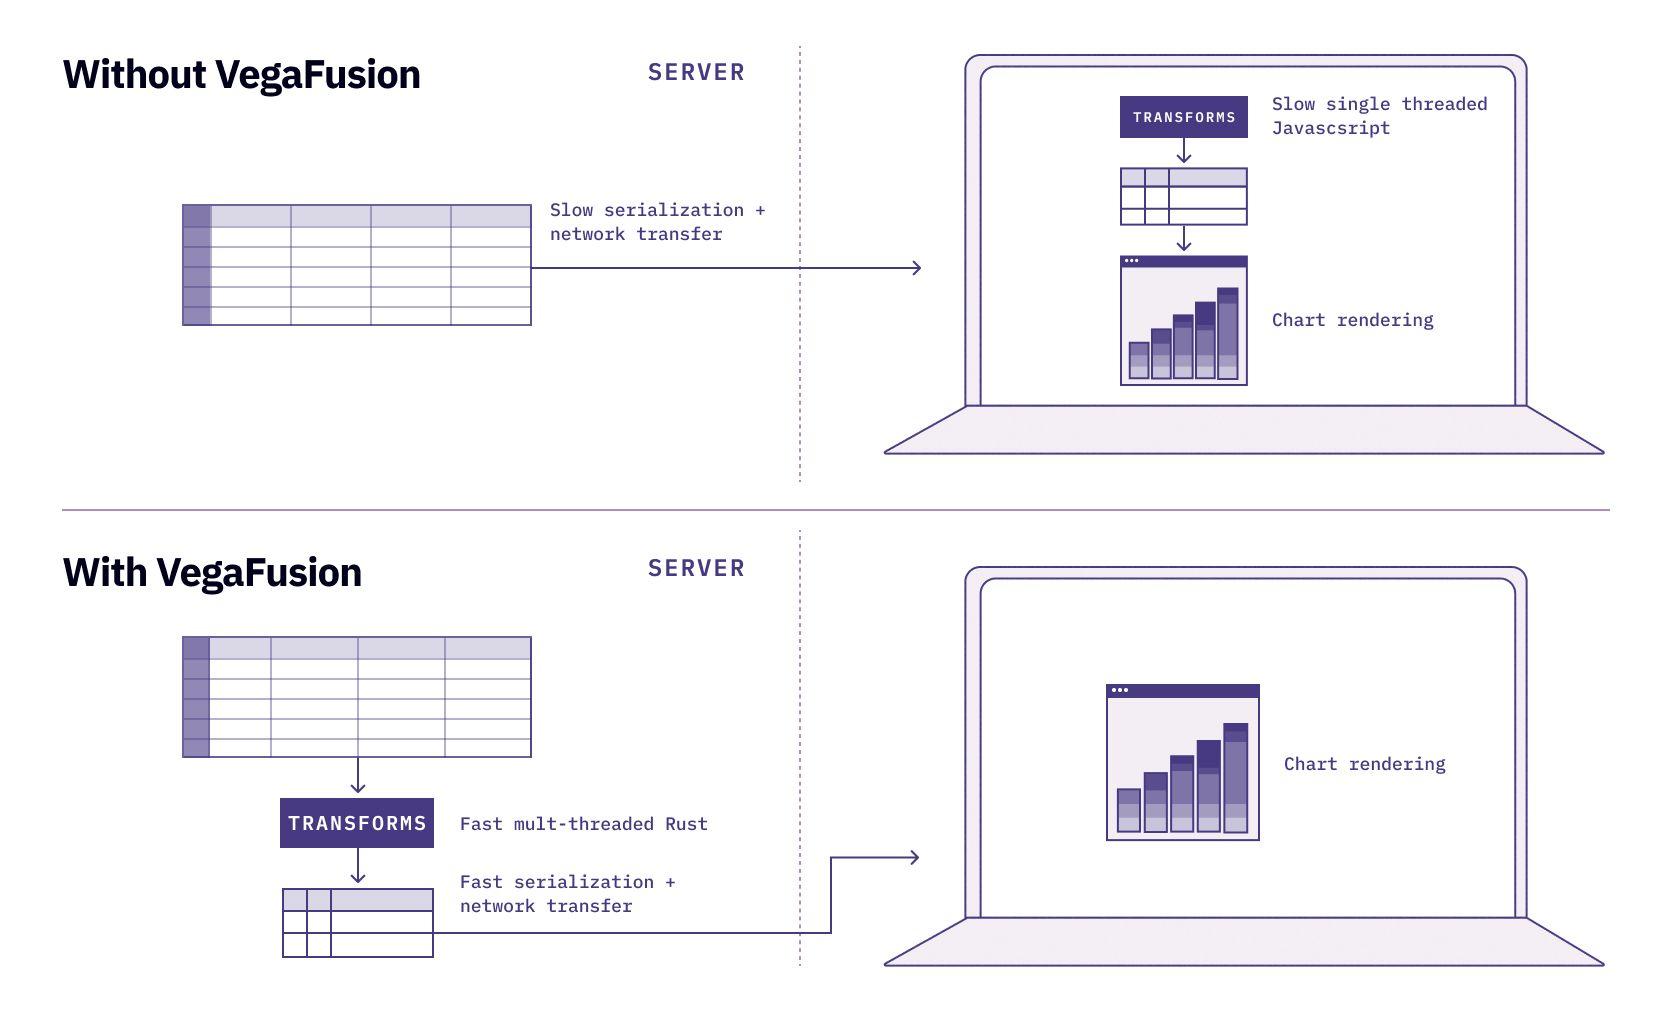
- Interactive visualization libraries, like Vega, Plotly, and Bokeh send all of the data points to the local client (i.e., the user’s computer), where the chart is then rendered using JavaScript. These outputs can be richly interactive, but are constrained by the memory of the client: if you try to visualize data tables over a few thousand rows, your browser is likely to slow down or crash.
This presents a difficult tradeoff between scale and interactivity. If you want things like tooltips, zooming, and drill-down, you are limited to only a few thousand points. If you want massive data scale, you’re limited to boring .png files.
Enter: VegaFusion
But what if you didn’t have to decide between interactivity and scale? In the words of the immortal Taco Bell commercial, “¿por que no los dos?”
This is the magic of VegaFusion. It allows interactive data visualizations to work at much, much higher scale. VegaFusion accomplishes this by pushing the aggregation for charts down to server-side operations, allowing operations on large datasets while also minimizing the amount of data pushed to the client, and still enabling full frontend interactivity.
We have long been fans and users of Vega-Lite – a powerful, high-level visualization grammar – and built our original chart cell around it. So when VegaFusion first came on the scene, we quickly incorporated it into the product, and were thrilled with the results. When you use a Chart Cell in Hex, you don’t have to worry about the scale – just pick a dataframe, build a chart, and it will Just Work™, even if it’s millions of rows.
Here’s an example of rendering a 1,000,000 point dataset:
VegaFusion is joining Hex!
As we got deeper with the VegaFusion technology - and started working with Jon Mease, the human behind it - we realized that the best way to scale our contributions would be incorporating both of them into our team.
Today, we’re announcing that VegaFusion is now part of Hex, and the project is becoming a Hex open source project. Jon has joined us full-time to lead our data visualization architecture, and continue his contributions to the Vega ecosystem.
Announcing VegaFusion 1.0
We’re also thrilled to share the first major version of VegaFusion: 1.0. This brings much of the work we did to back our new interactive chart editor into VegaFusion core, including better support for Altair – the VegaLite bindings for Python.
Now, it’s possible for Altair users – whether in Hex, or other notebooks like Jupyter – to take advantage of VegaFusion to automatically pre-evaluate and optimize their charts, all without requiring a clunky Jupyter Widget extension.
It also contains a ton of other great stuff, and lays the foundation for what’s next – including aggregate pushdown to SQL!
Re-licensing for fun
As part of this, we’re re-licensing VegaFusion to be much more permissive (to BSD-3 from AGPL). Our hope is that this will spur creativity and unlock the power of VegaFusion for others in the community (yes, including competitors 😄).
We’d love to see everyone who is interested join the community, and consider contributing to the project. There’s tons to do!
If this is is interesting, click below to get started, or to check out opportunities to join our team.