Blog
Caching is all you need
Our cache hit rate looked great. Our cost data disagreed. Here's what we found when we stopped trusting the average.

As a team building an agent, it’s impossible to ignore the pressure every customer is feeling to be more thoughtful about their AI spend. Therefore, it’s become really important to our team that our agent maximizes our customers’ AI credits.
By every metric we were watching, it was hard to figure out where we needed to improve. Our cache hit rate was 94%, and the average cost of a given thread was relatively low. Yet even with that, we were still hearing cases of users experiencing very high costs - something wasn’t adding up!
The obvious levers
Our first thought was to reach for the obvious lever: use a cheaper model.
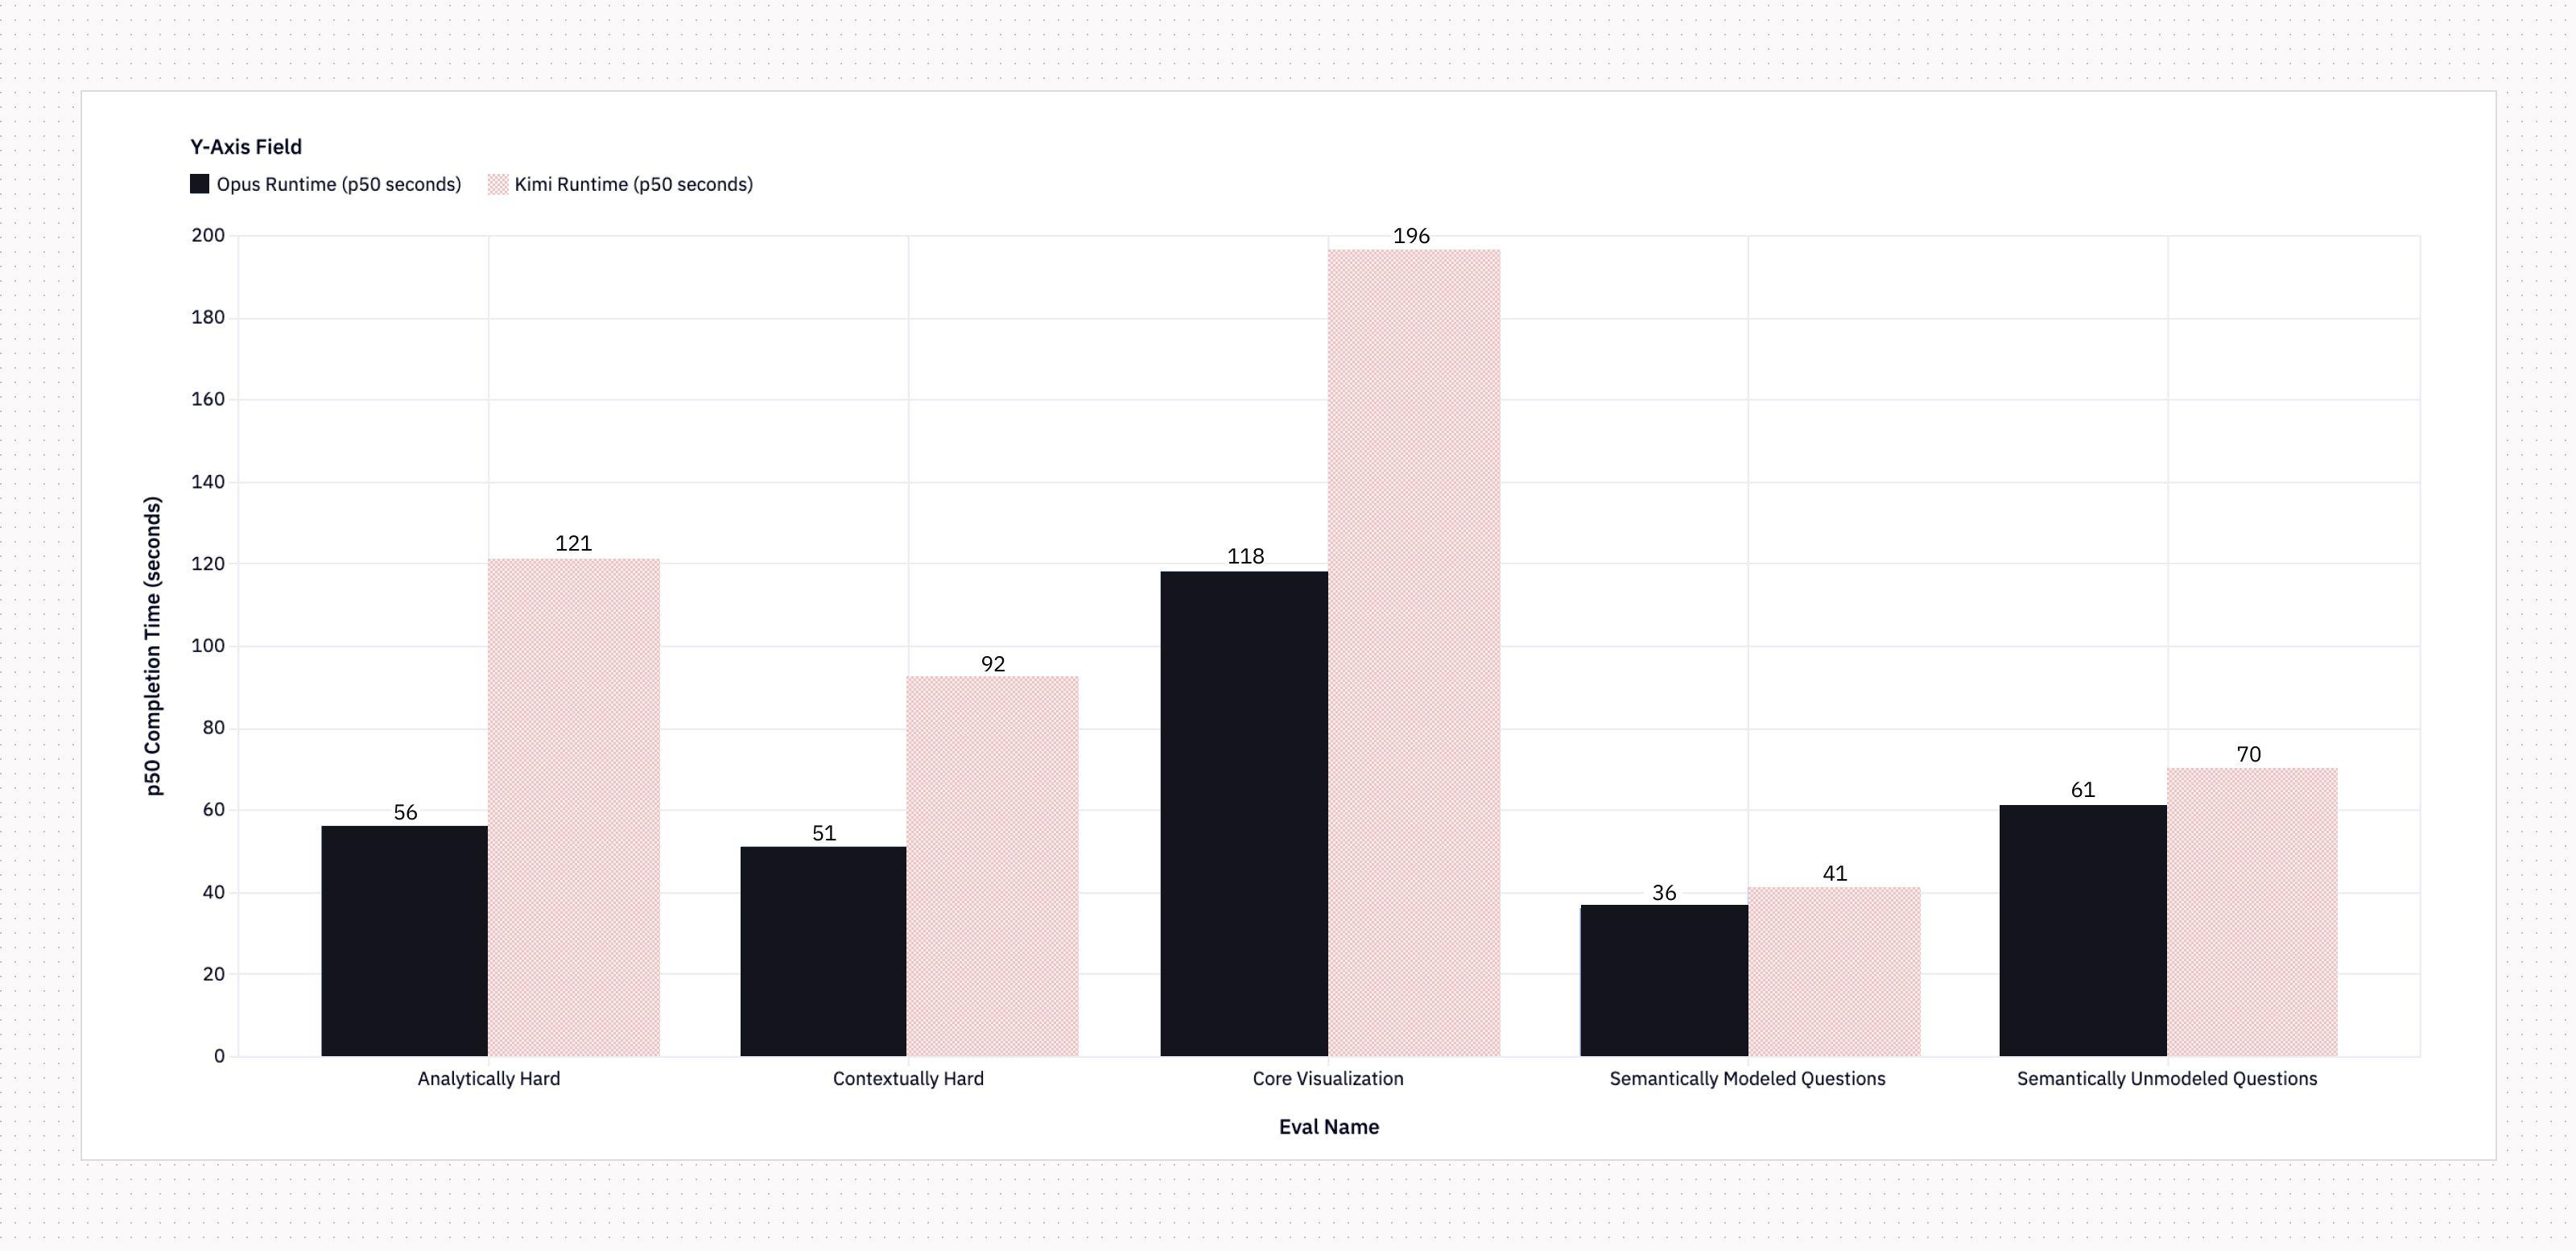
The timing was perfect since we’d just finished deploying our self-hosted Kimi model. However, while Kimi was incredible for quick, simple questions, we learned that it took substantially longer to answer questions on net. This was because for more complex and harder questions, Kimi would churn for up to 10x longer than a frontier model.

So our team started investigating what else we could do to move the needle. The answer was underrated: pay a lot more attention to caching.
A high cache hit rate isn’t enough
That 94% cache hit rate gave us false confidence; we thought caching was a solved problem. Spoiler, it wasn’t :’)
In order to investigate thread costs, we built a “cache visualization” tool that showed a breakdown of how many input tokens were cached each iteration and how that impacted the total cost of calling the LLM.
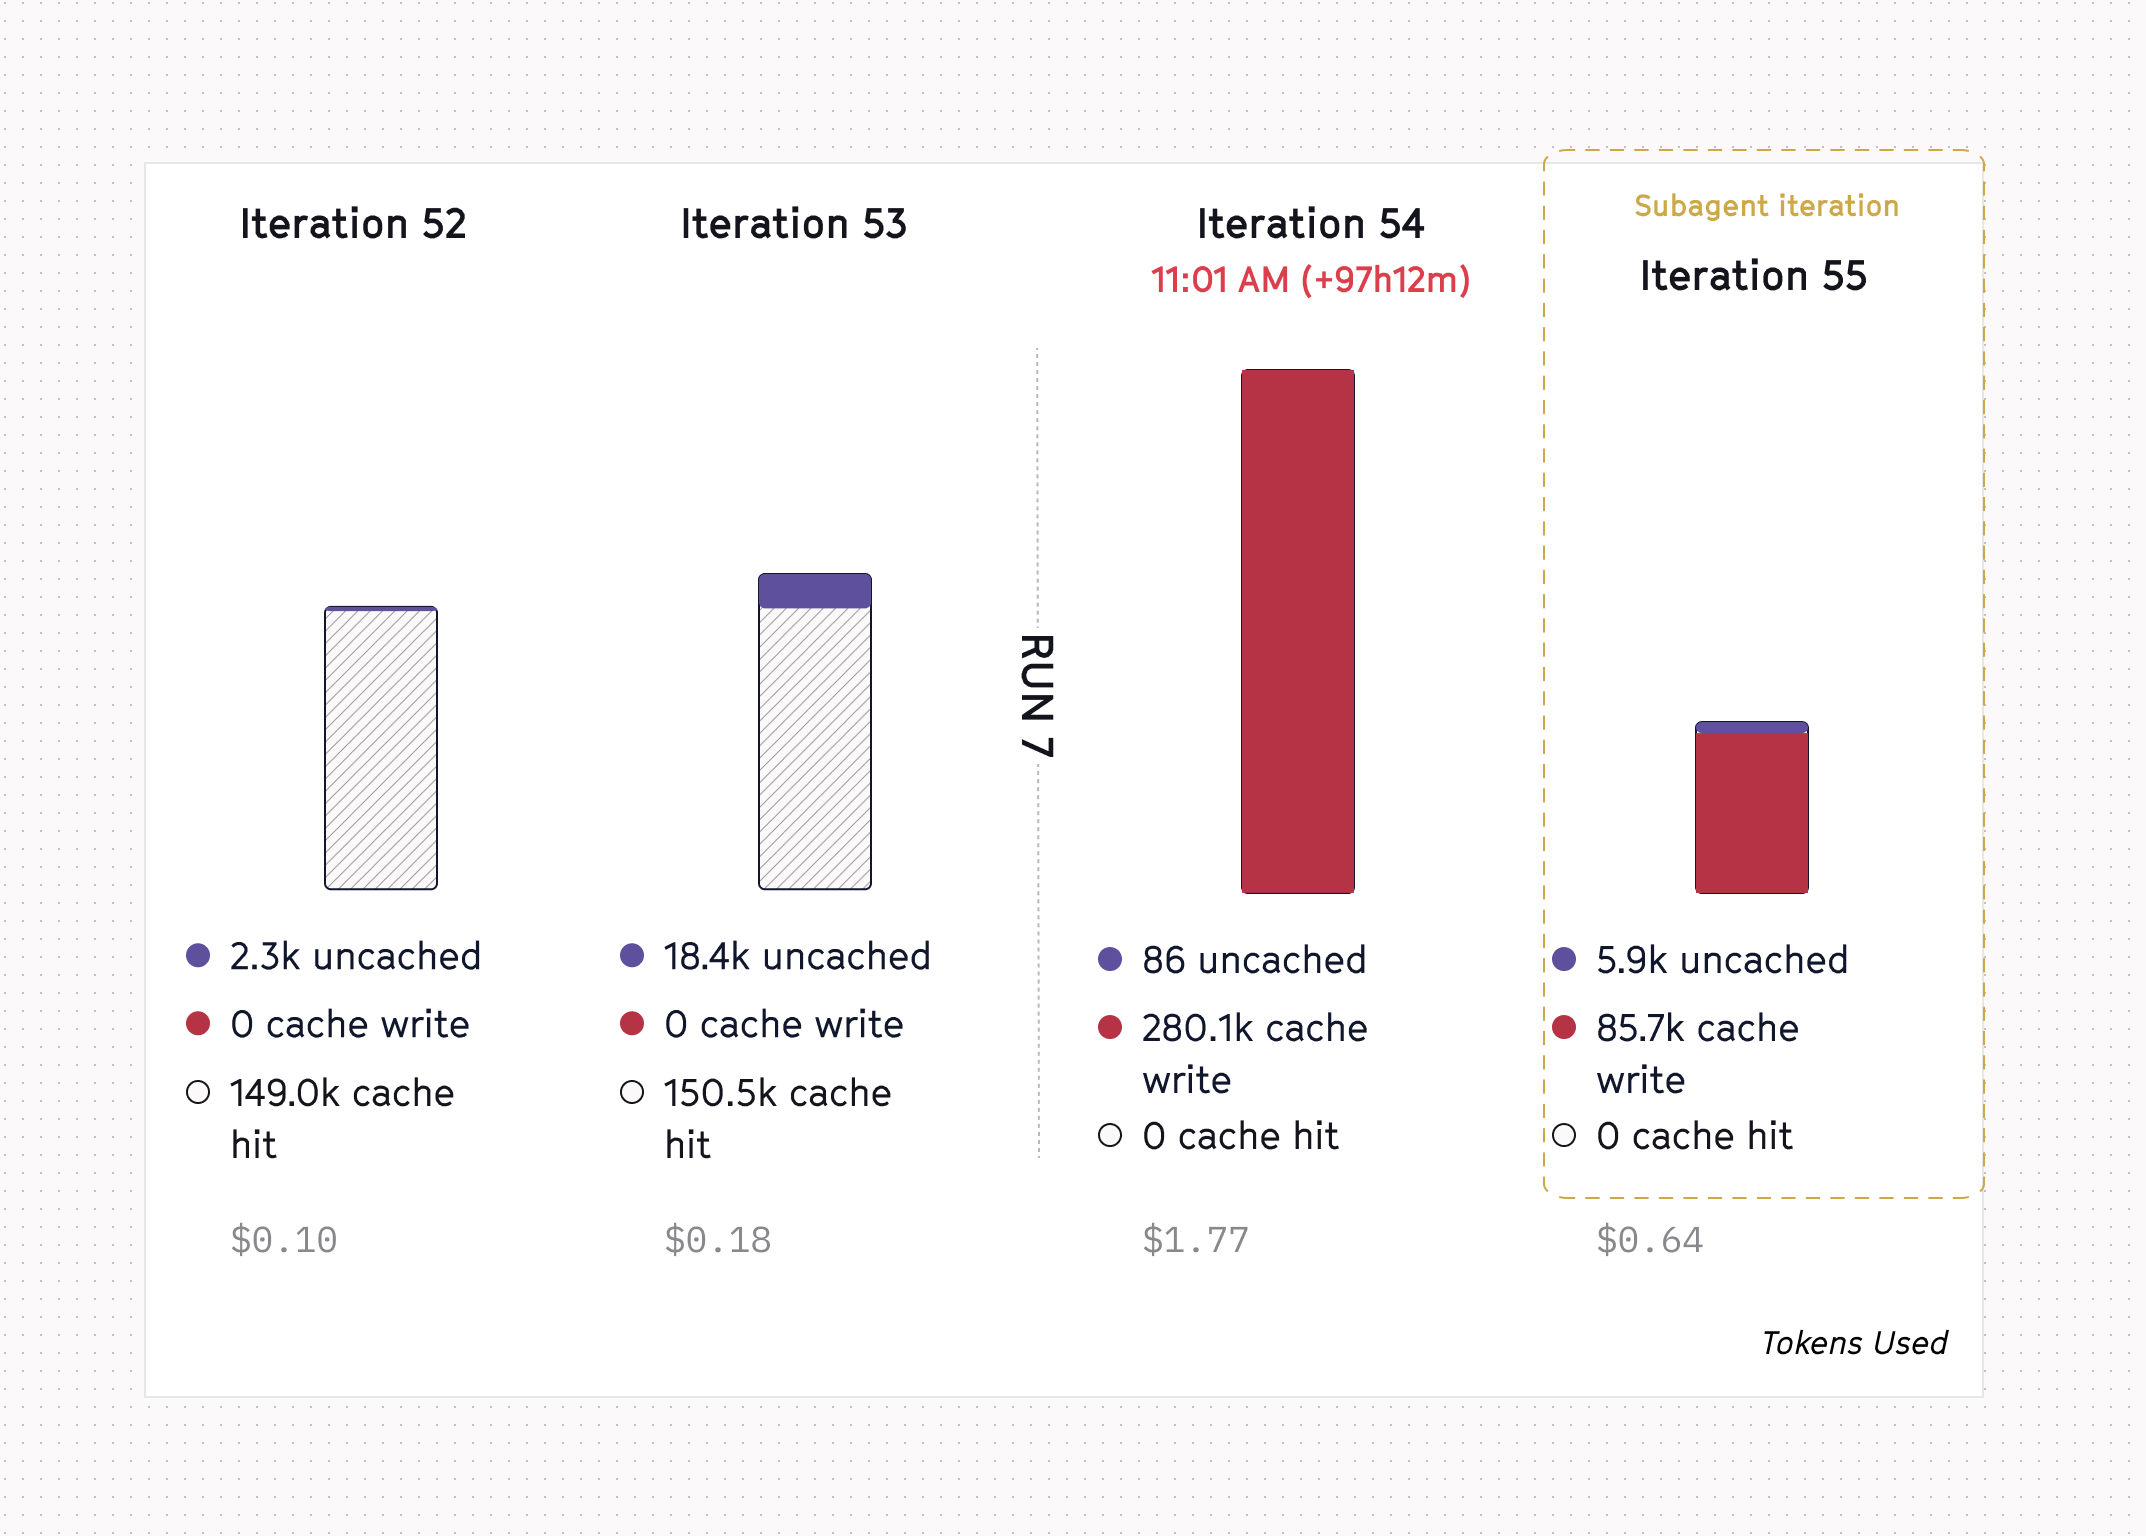
Each visual shows a single thread with our agent. Each bar is an iteration (i.e., a request we sent to the LLM provider) with the total cost and breakdown of cache writes and reads. The “run” boundary is the start of a single loop with the agent, which we kick off after the user sends a new prompt.
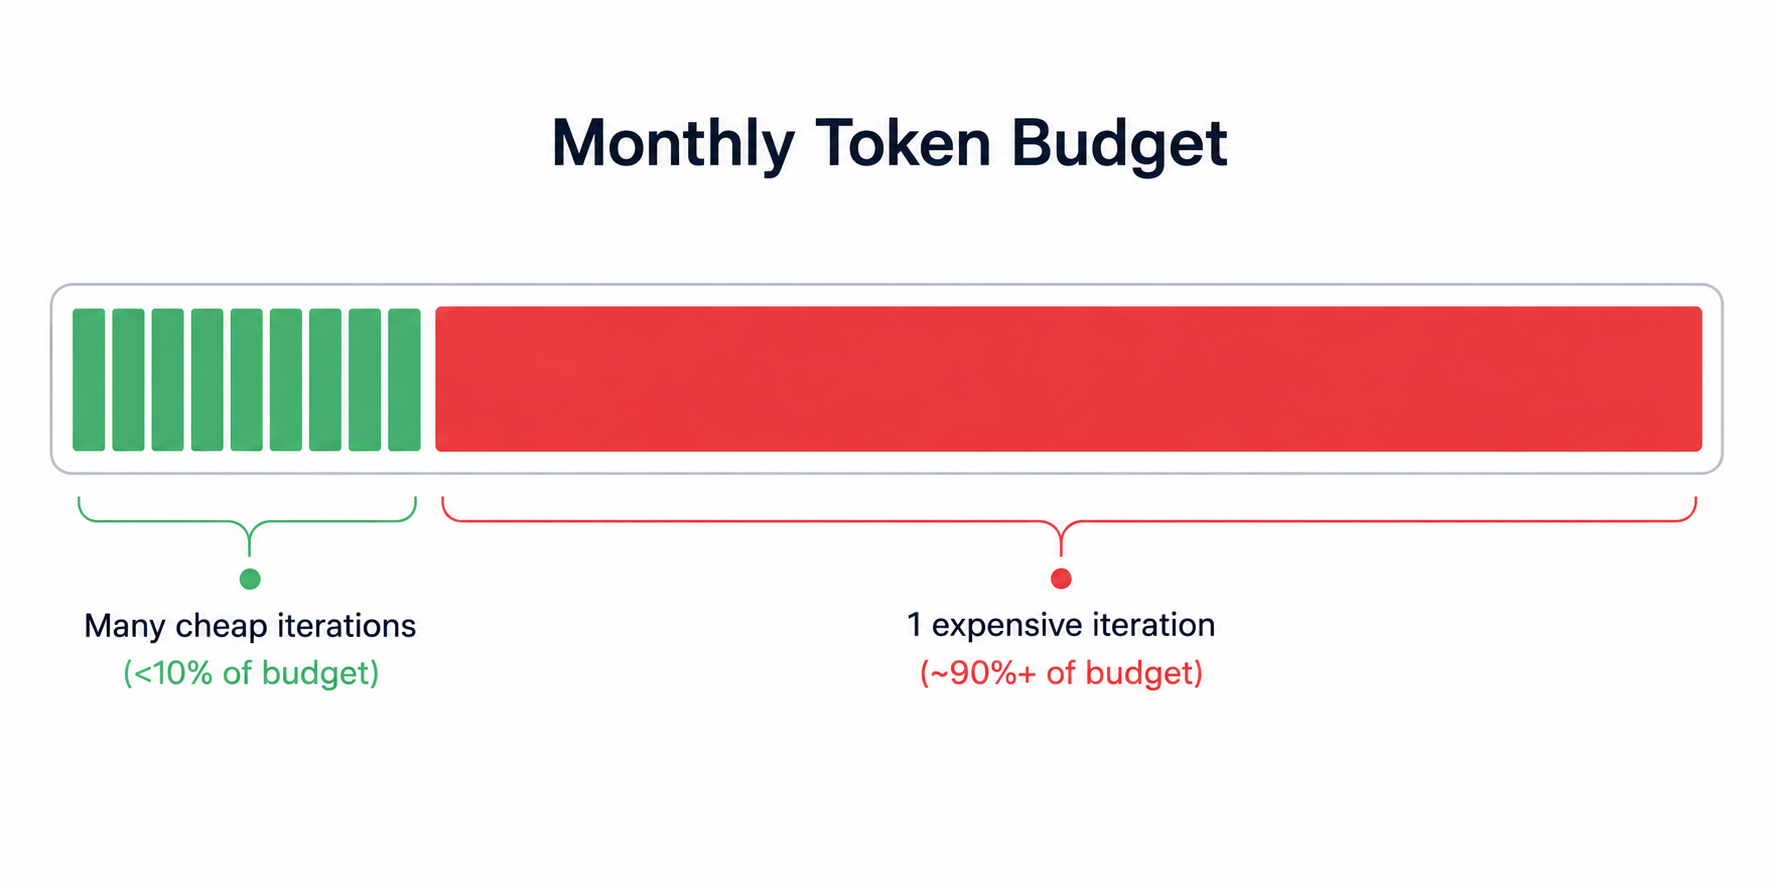
Using this tool, we quickly discovered that looking at the aggregate percentage was a bad metric. Even if 90% of agent interactions were dirt cheap, it only took one expensive thread to blow up a user's credit usage for the entire month. The average was quietly hiding where the real user pain lived.
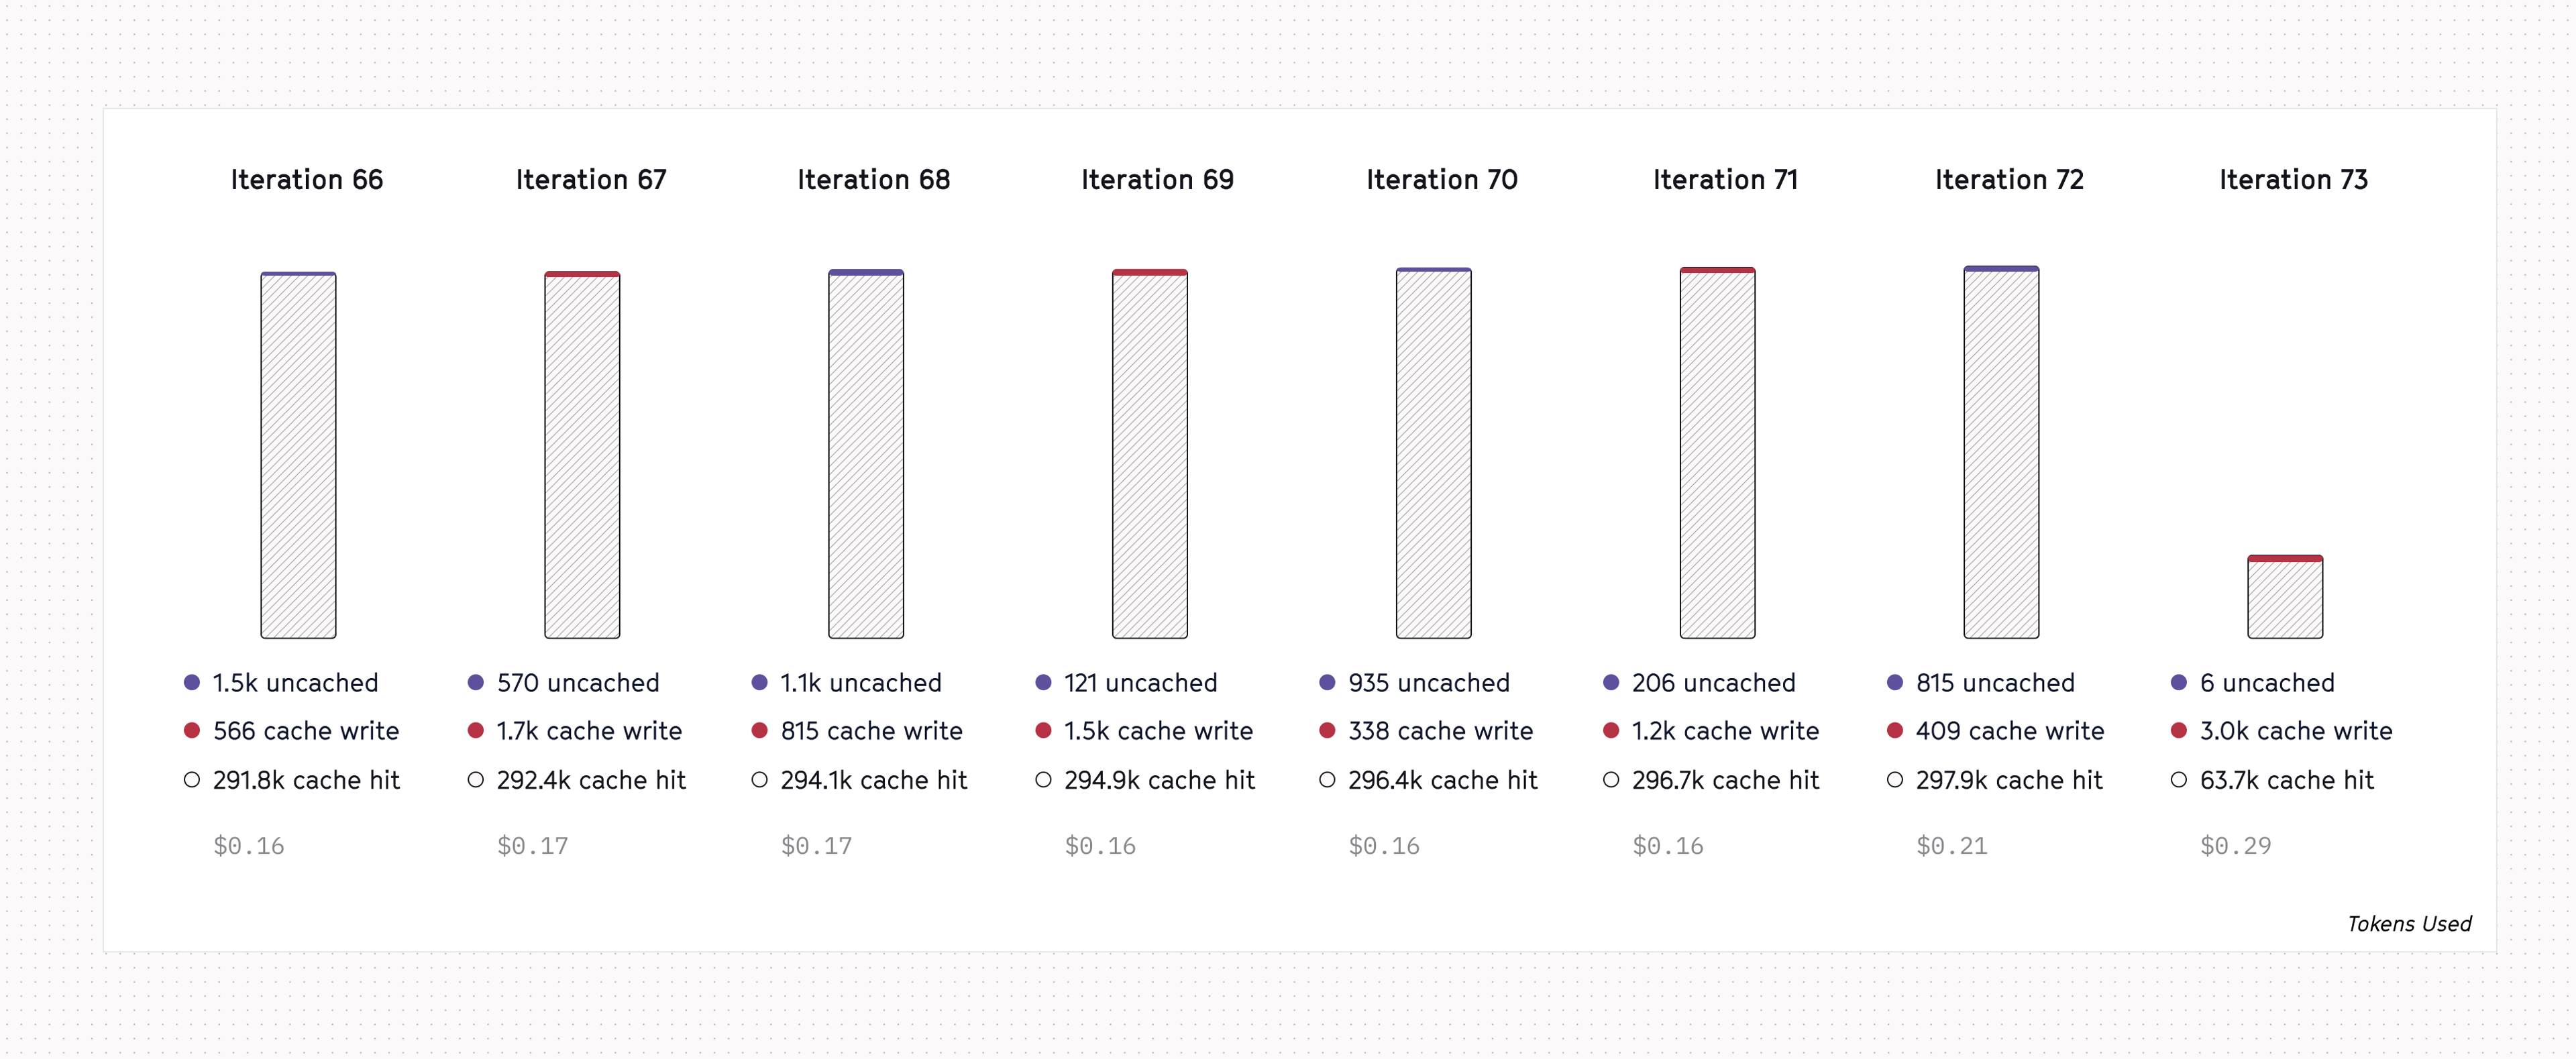
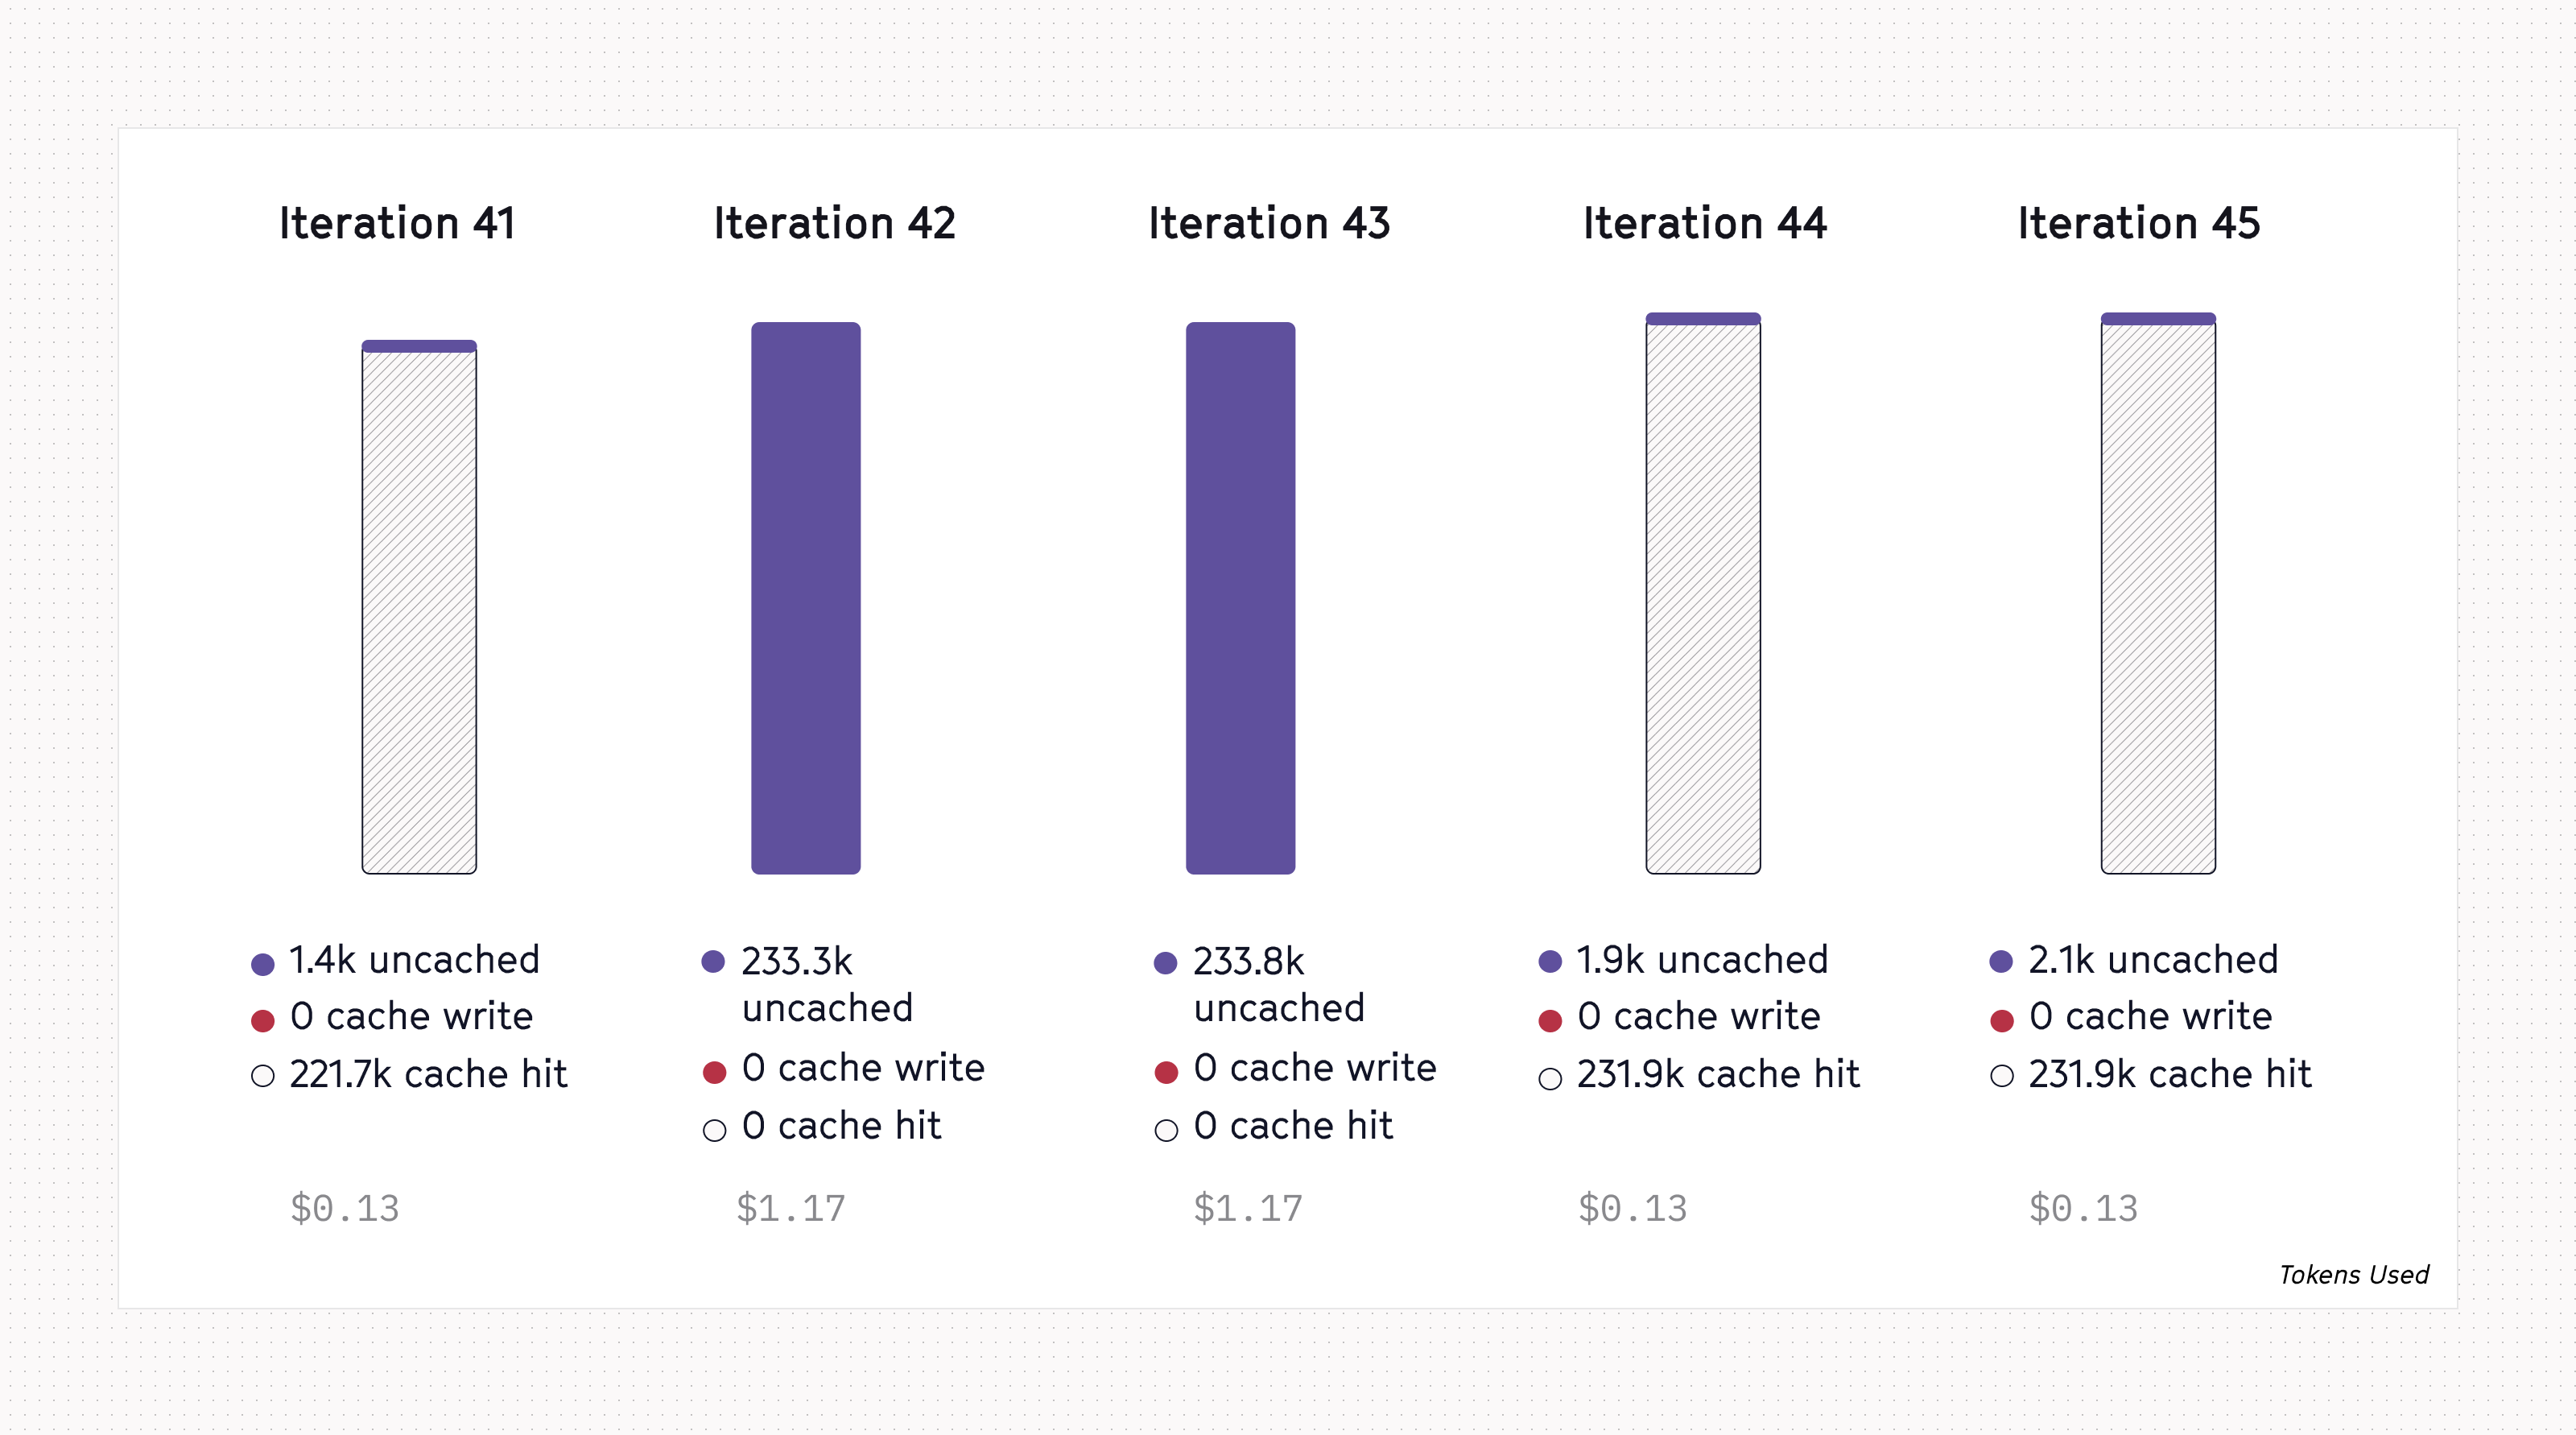
Even more surprisingly: a very long conversation is shockingly cheap when it's fully cached.
Here’s an example of a run that was fully cached until compaction (meaning it was as large as it could possibly be).
In contrast, here’s a fully uncached response that’s much smaller but more expensive! This makes sense since cached input is usually 10x cheaper than uncached input tokens.
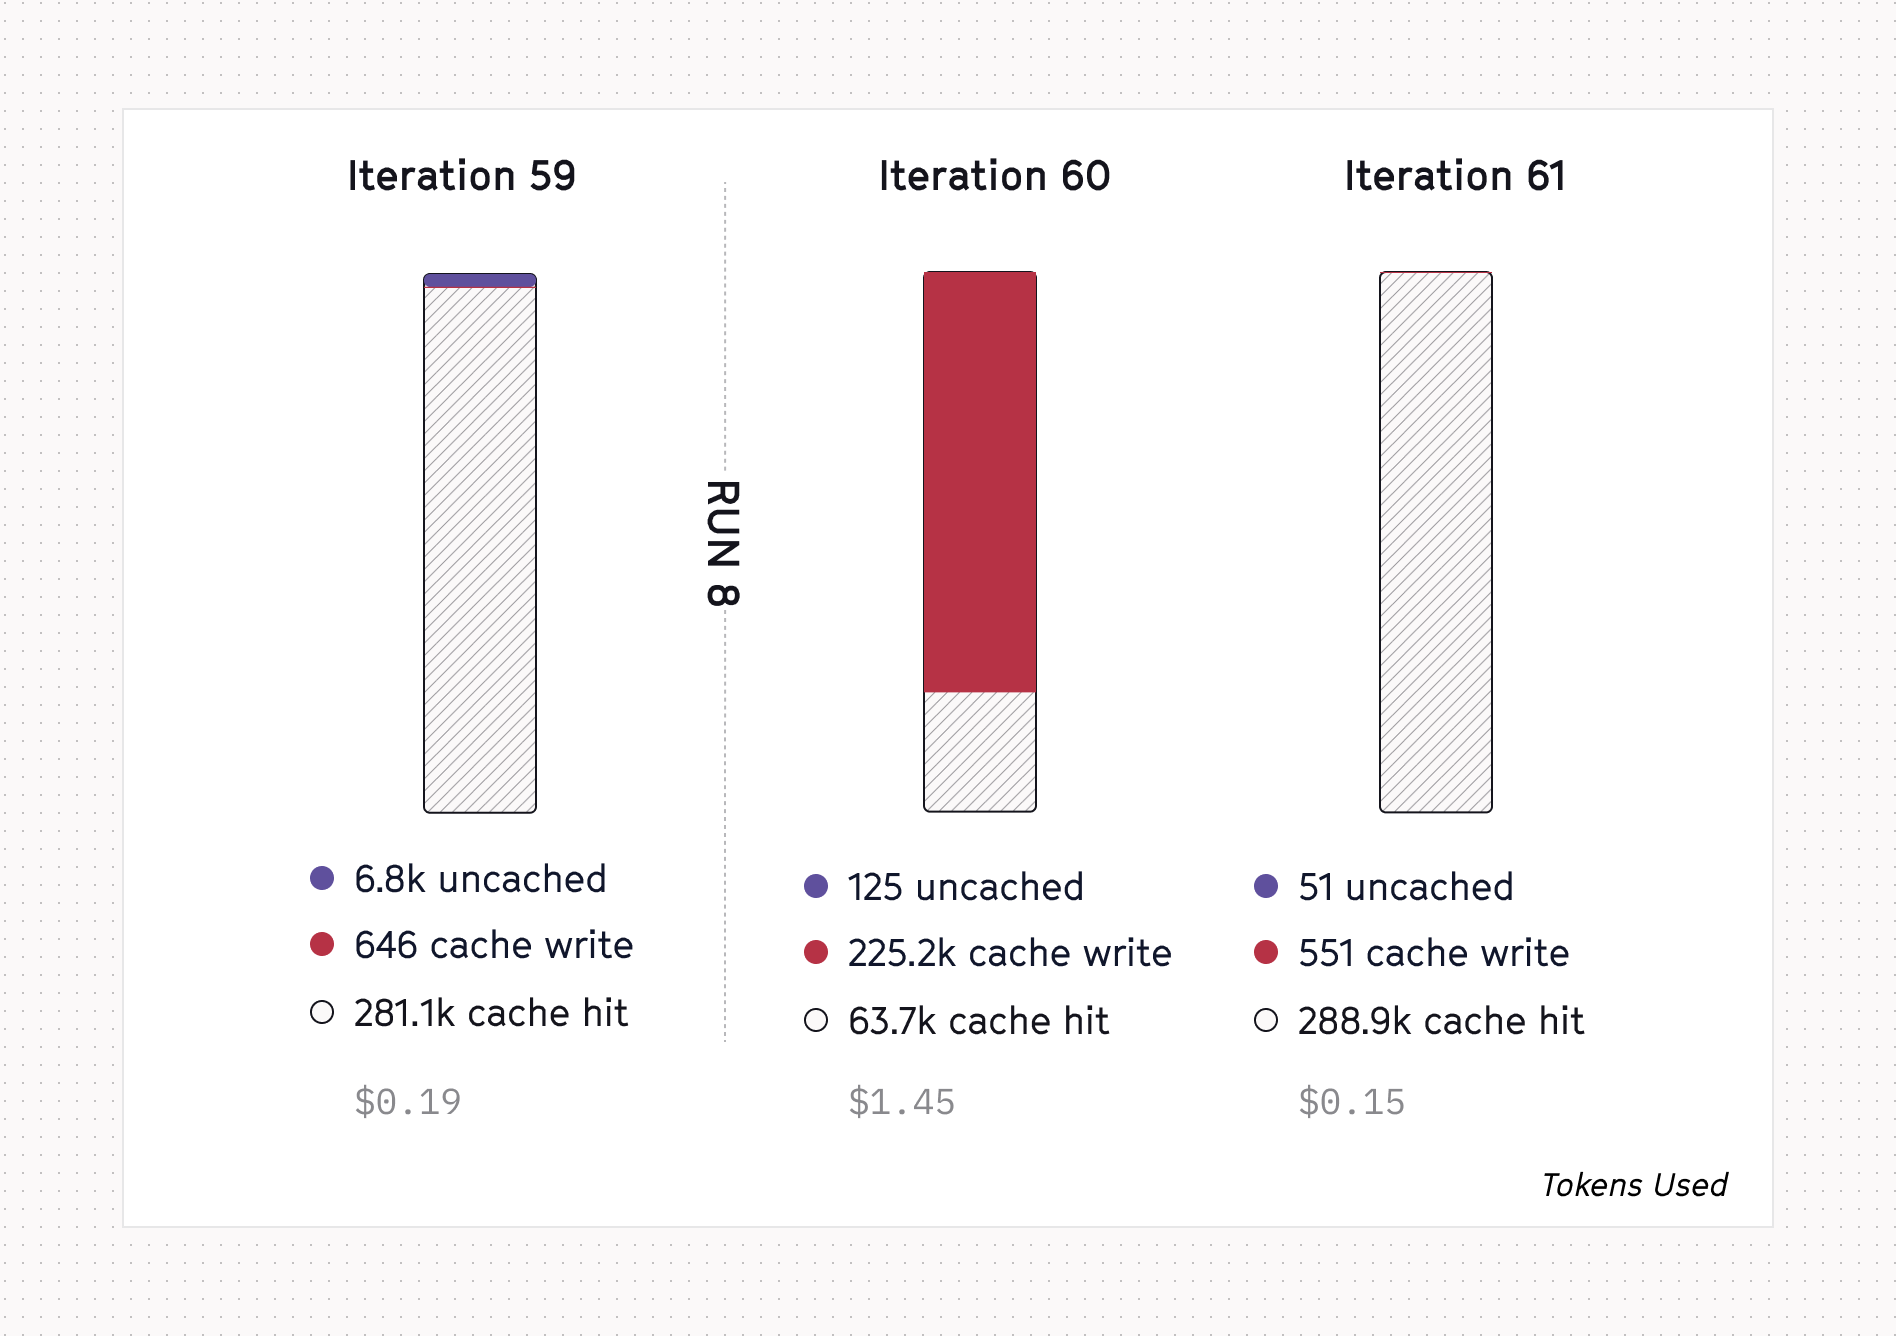
In other words, 10 cached tokens cost the same as one uncached token.
While reviewing the highest cost threads, we found the same pattern over and over. It wasn’t a conversation using model max effort, or even the longest conversations. It was a large context window that was completely uncached. These periodic cache misses resulted in the lion's share of the cost for an agent conversation. A single miss could end up costing several dollars.
This insight pointed us to three fixes.
A better default user experience
When users revisit threads after the cache has gone cold, their next message is mostly or completely uncached. We saw this happen two ways.
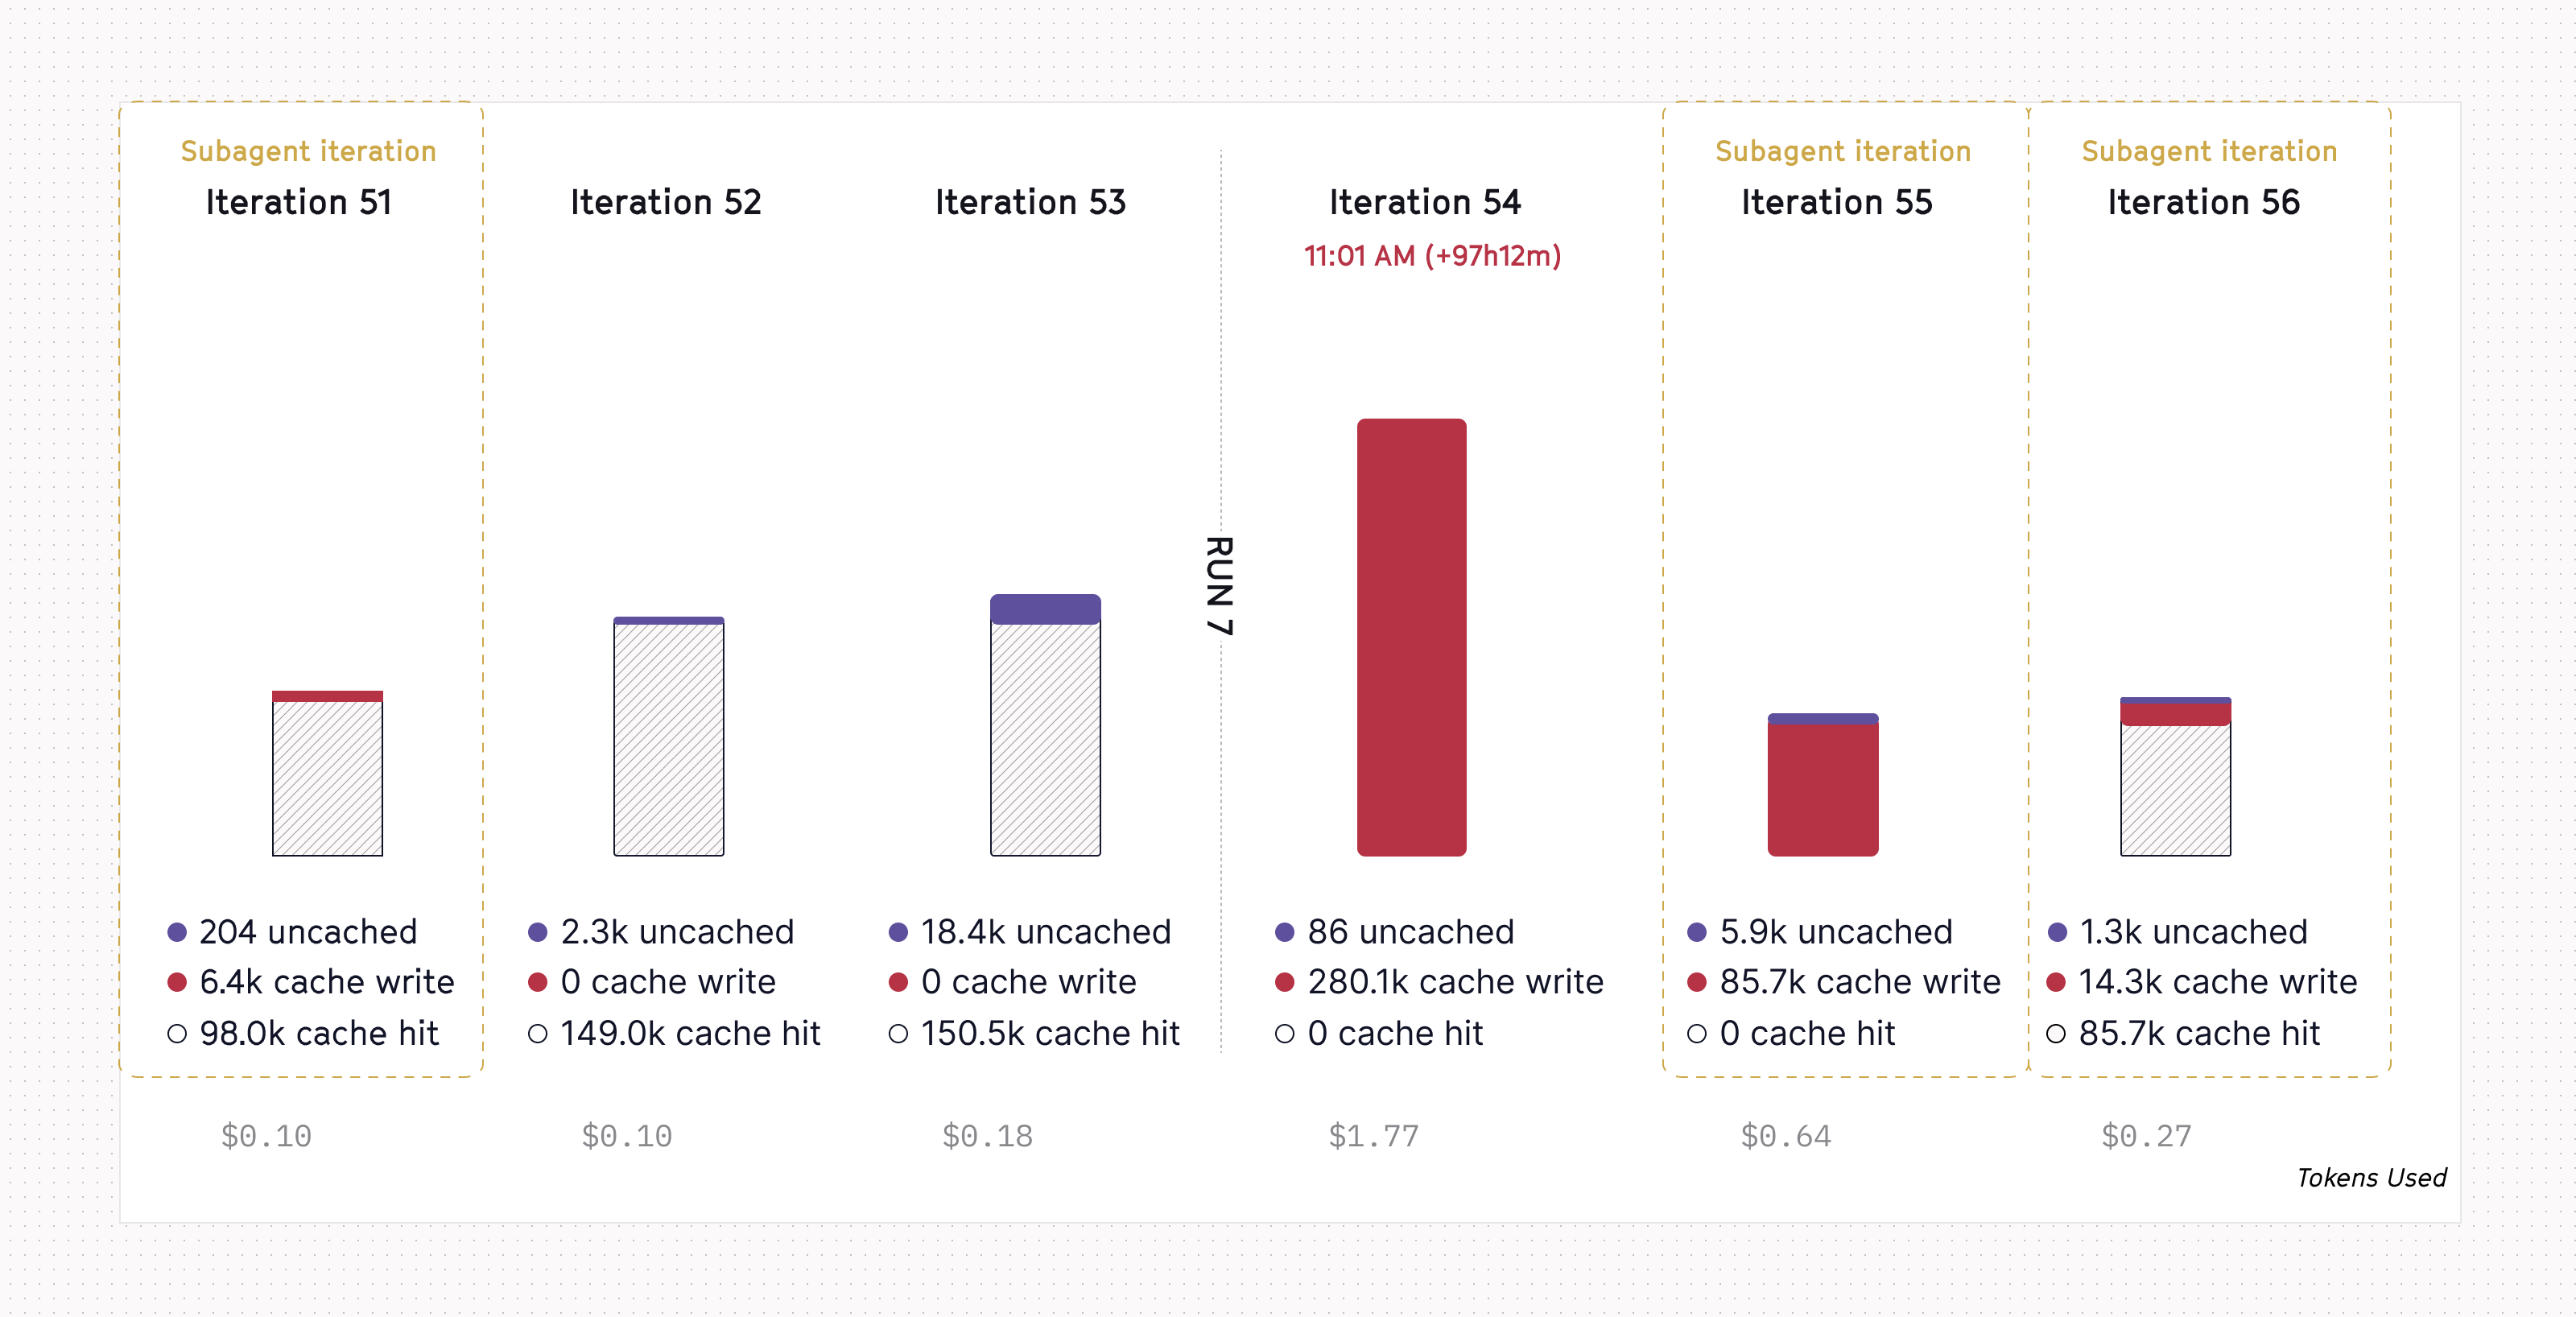
(1) A user lets the agent work but doesn’t notice that it either needs input or is done running. By the time they come back to the thread the cache is already cold and their next message is expensive. This is especially frustrating since users have no ability to discern the cost.
To address this, we built auto-approve mode (coming soon) and enabled desktop notifications when the thread was ready for user input. That improved time-to-response and keeps the cache hot while someone's actively working.
But still, this wasn’t enough!
(2) A user revisits a thread after a long gap (for example, more than 1 day). There's no notification that can keep their cache warm, and we have to accept that some of their next request will be uncached.
But we can still lift the hit rate by structuring the prompt so that other threads keep the shared parts of the cache warm. We ranked our prompt into four levels of stability, earlier parts more stable than later ones:
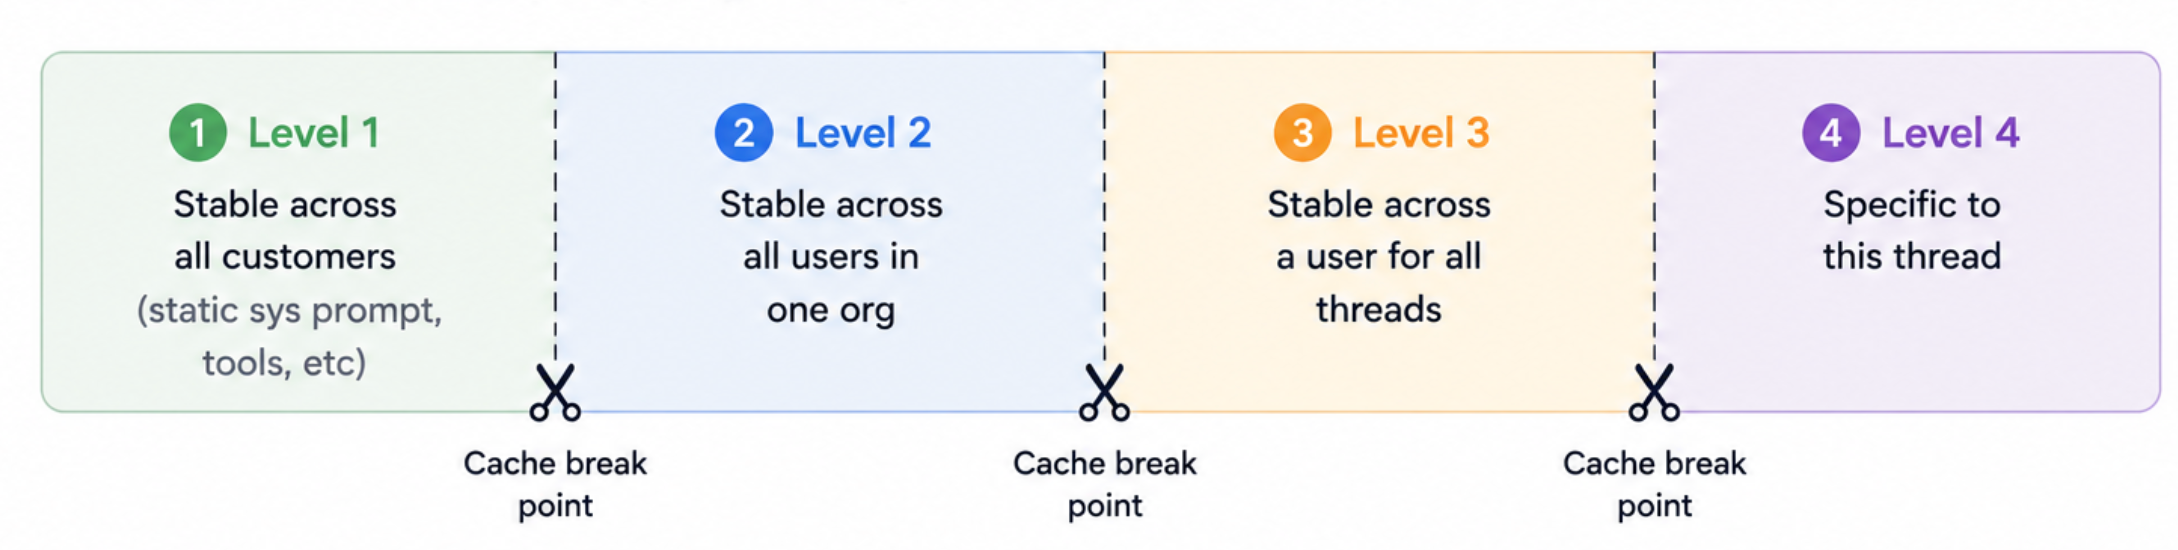
Then we added cache break points on our Anthropic calls along each boundary. Now our entire user base keeps level 1 warm, everyone in a given org keeps level 2 warm, and so on.
Sounds easy right? Shockingly easy to break! Quite literally the day after we merged this, another engineer added a dynamic tool to the system prompt that broke this method.
The real fix was automated review to catch these regressions before they ship. We distilled a set of cursor rules for our bug bot to follow when reviewing PRs that touch any of our prompt files. Between human review and bug bot, we’ve managed to catch any regressions before they’ve gone out.
Long running subagents
The Hex agent is powered by a few very robust subagents, one for building generative apps, one for designing complex charts, etc. Over time, these have gotten sophisticated enough that they behave less like traditional subagents and more like their own driver agents. Which means they can run for a long time. So long, in fact, that by the time they finish, the driver agent's cache has gone cold.
Here you can see the driver agent delegated to the sub agent after the first iteration.
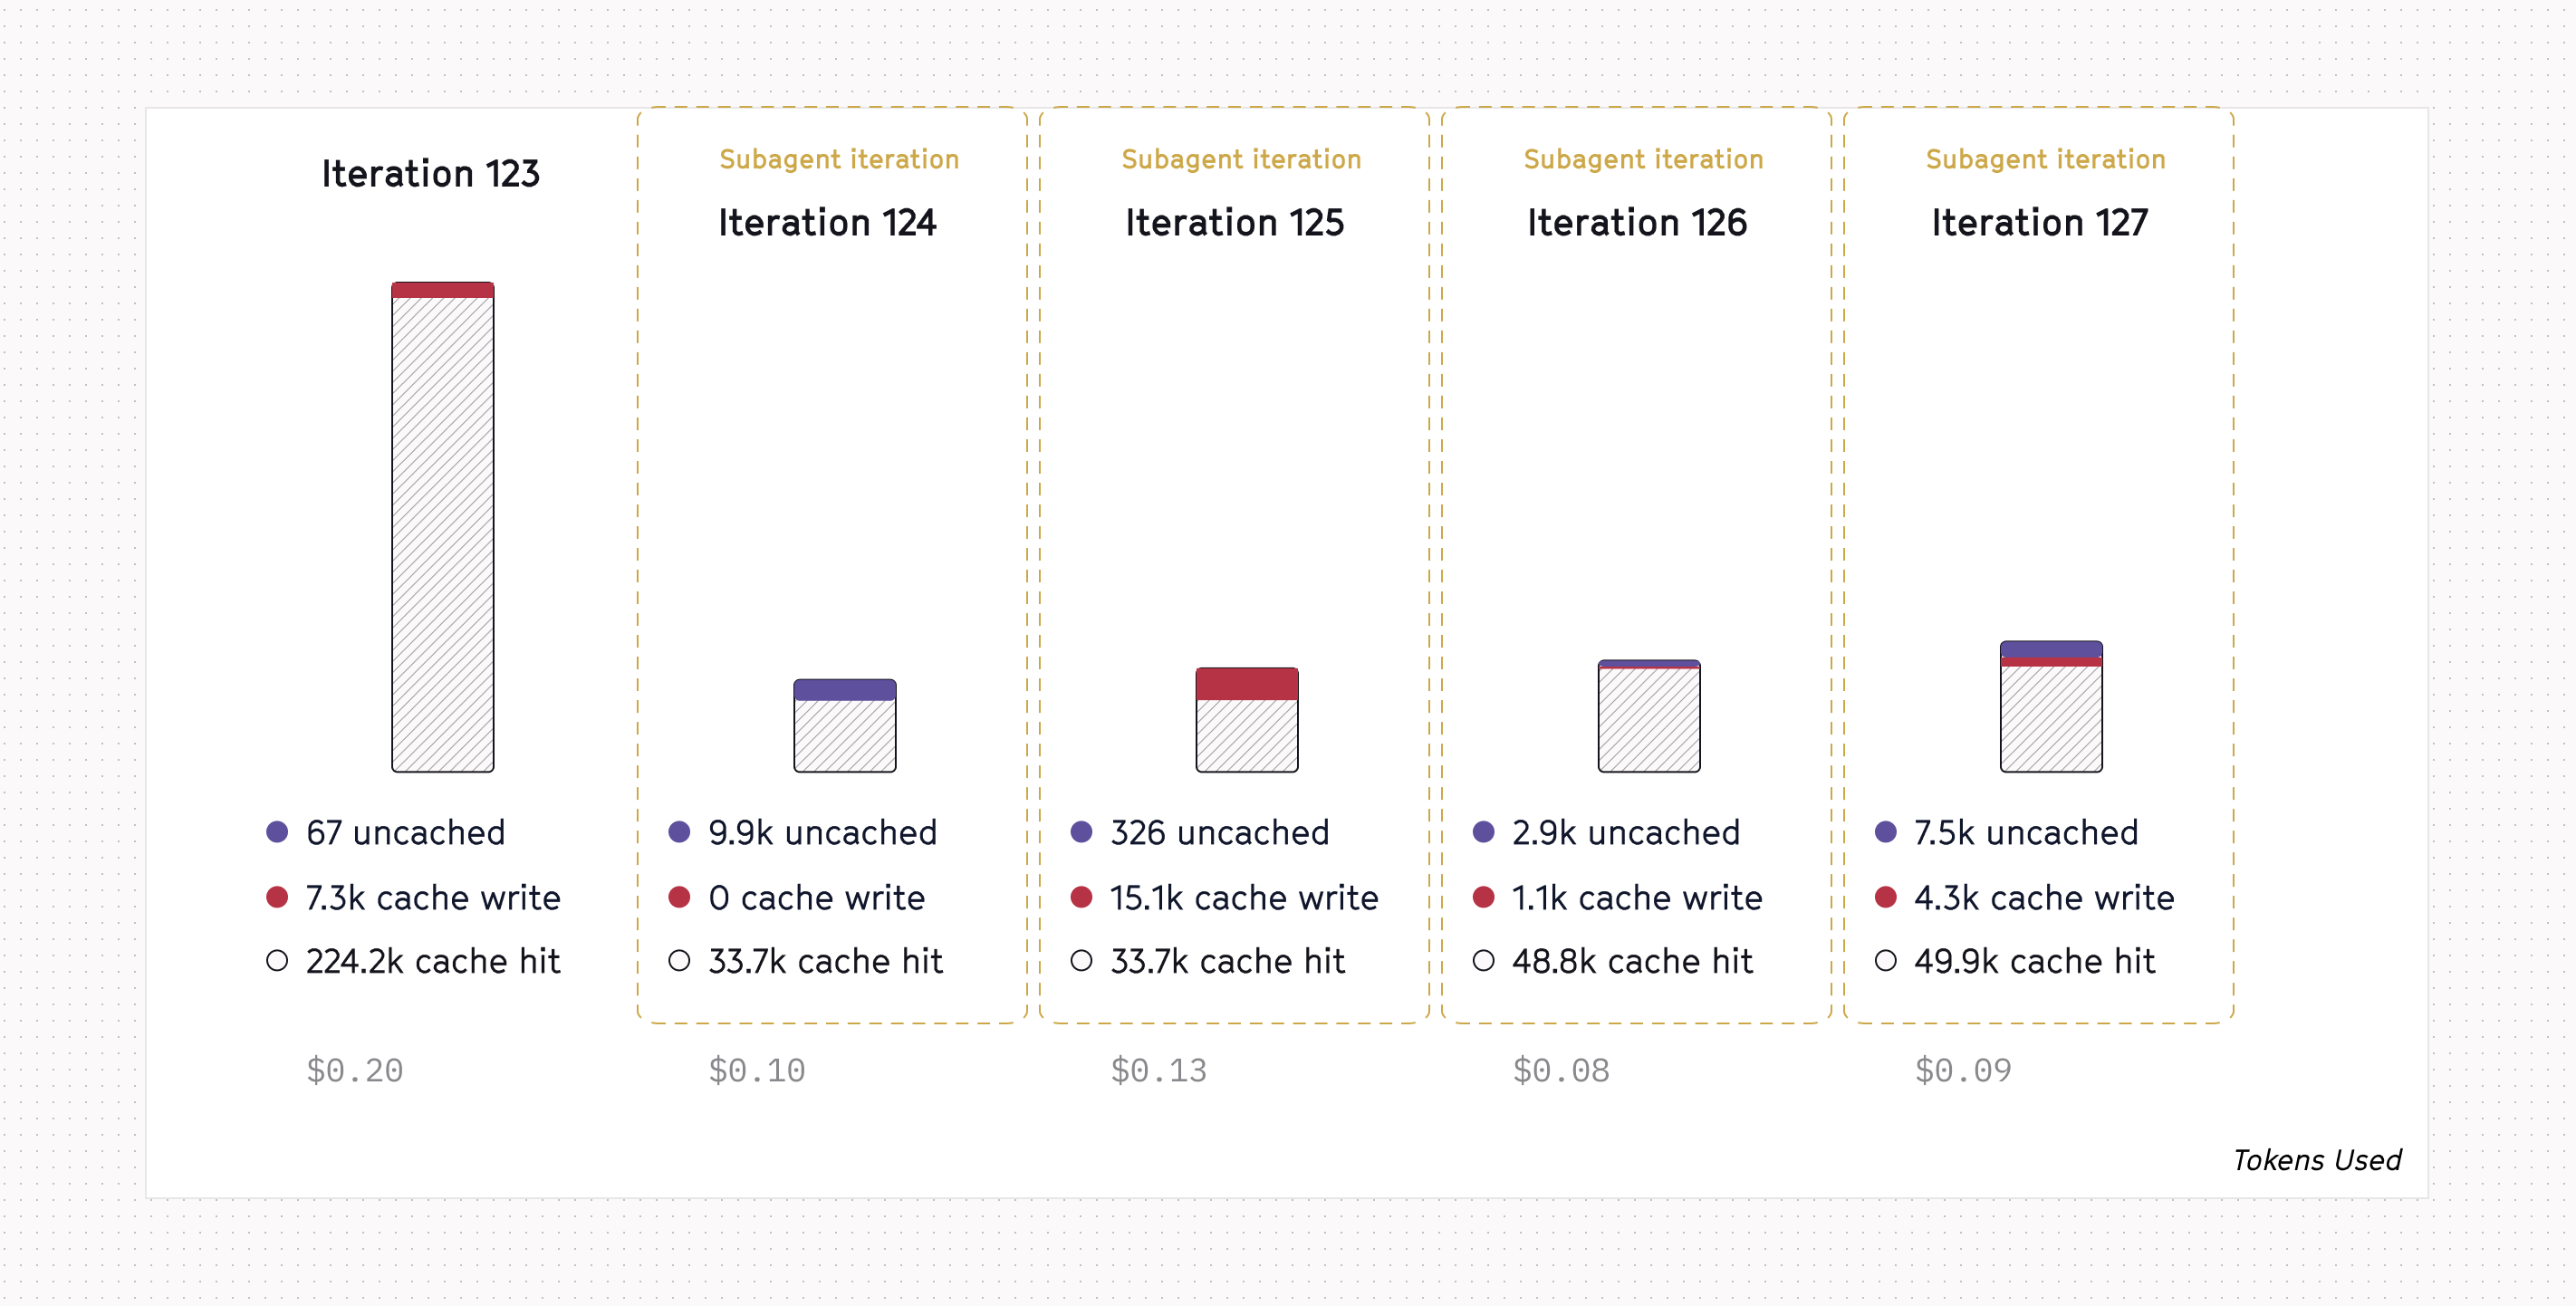
The subagent finished ~17 minutes later!
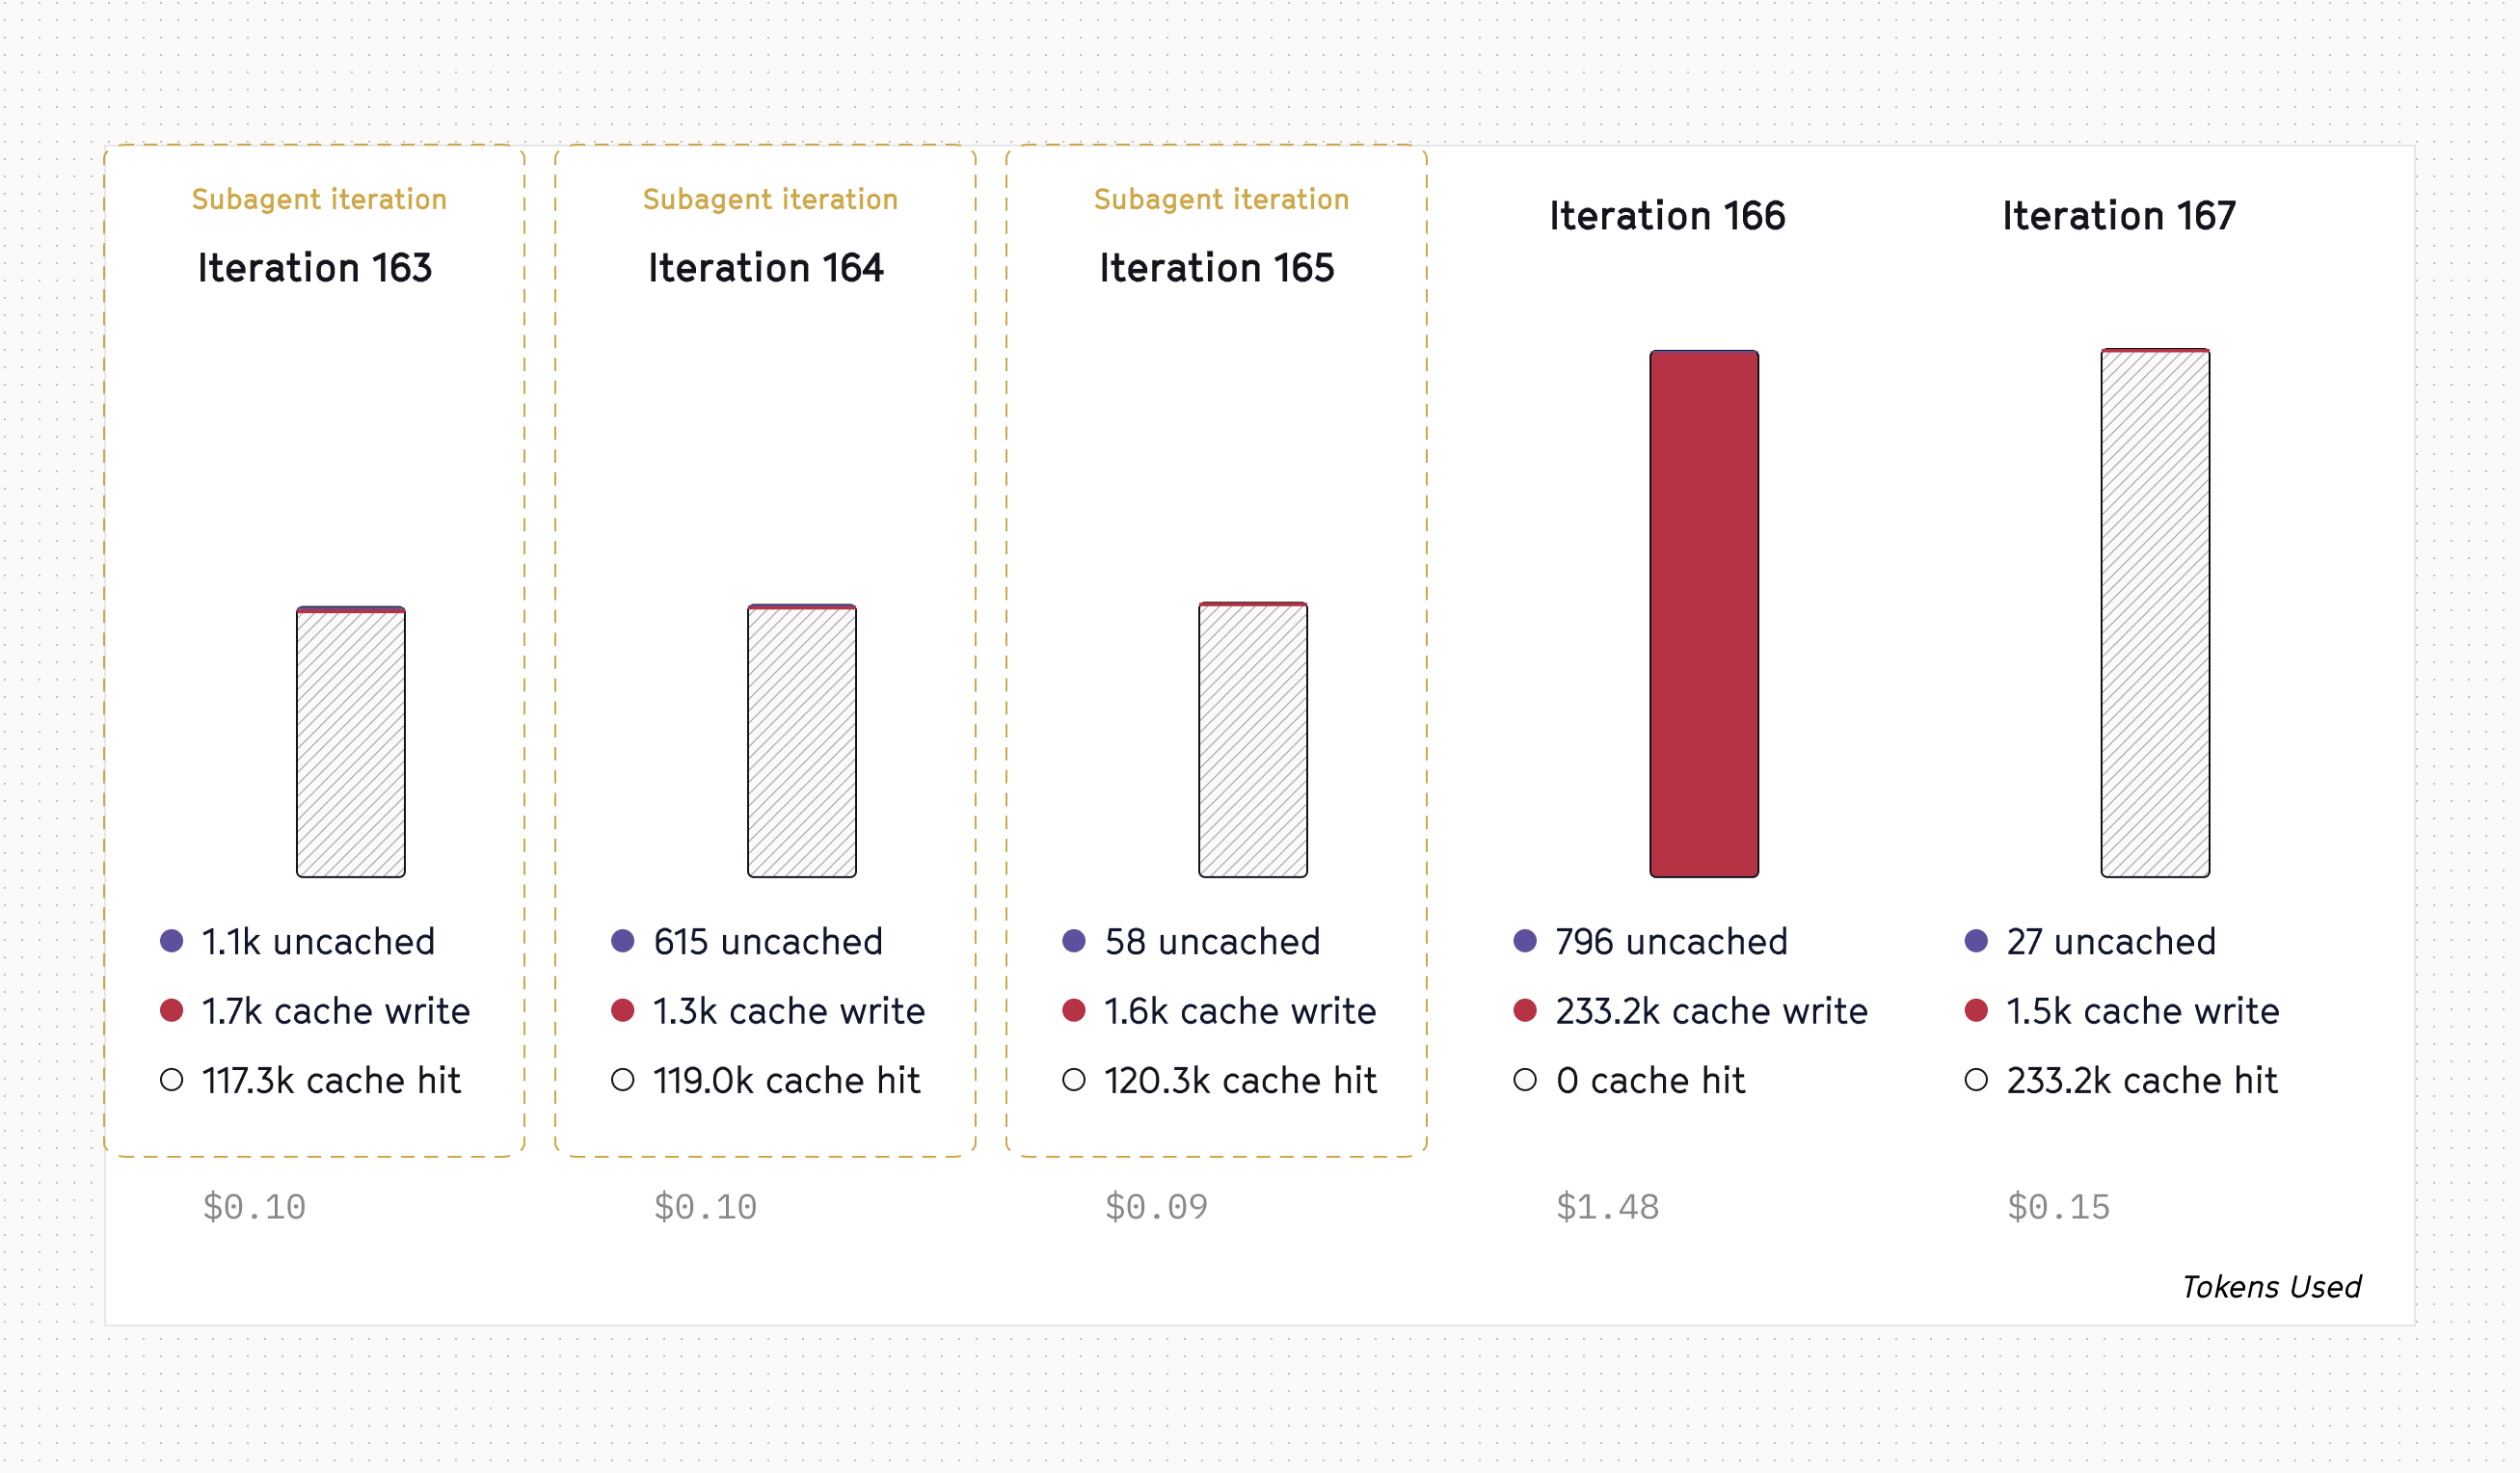
To solve this, we're working to migrate all of our subagents to faster models and enforce a hard time limit. If it runs longer than four minutes, we kill it and yield back to the driver agent to finish or re-invoke.
The lesson? There’s a price to pay when moving fast and optimizing only for quality.
A better cache route key
OpenAI uses a cache_route_key as a hint for which machine to route a request to. Requests have to hit the same machine to reuse a cache, so a bad route key means random mid-run requests come back completely uncached even with the same key. OpenAI will spread requests across machines once you're sending more than 15 per minute.
Originally, we were using the same cache key for all requests, which became problematic as our usage continued to grow. In order to reduce the number of “overflow” fully uncached requests, we needed to pick a new cache key.
To do so, we ran a simulation testing a few different cache keys:
- (Control) Static key: what we had already
- Thread key: unique route key per thread
- Bucket key: a “middle ground” cache key that bucketed requests from different users into N buckets.
The simulation ran a few thousand requests in intervals on a cheap OpenAI model for a few iterations. Every iteration would add a random amount of additional context.
Here are the results:
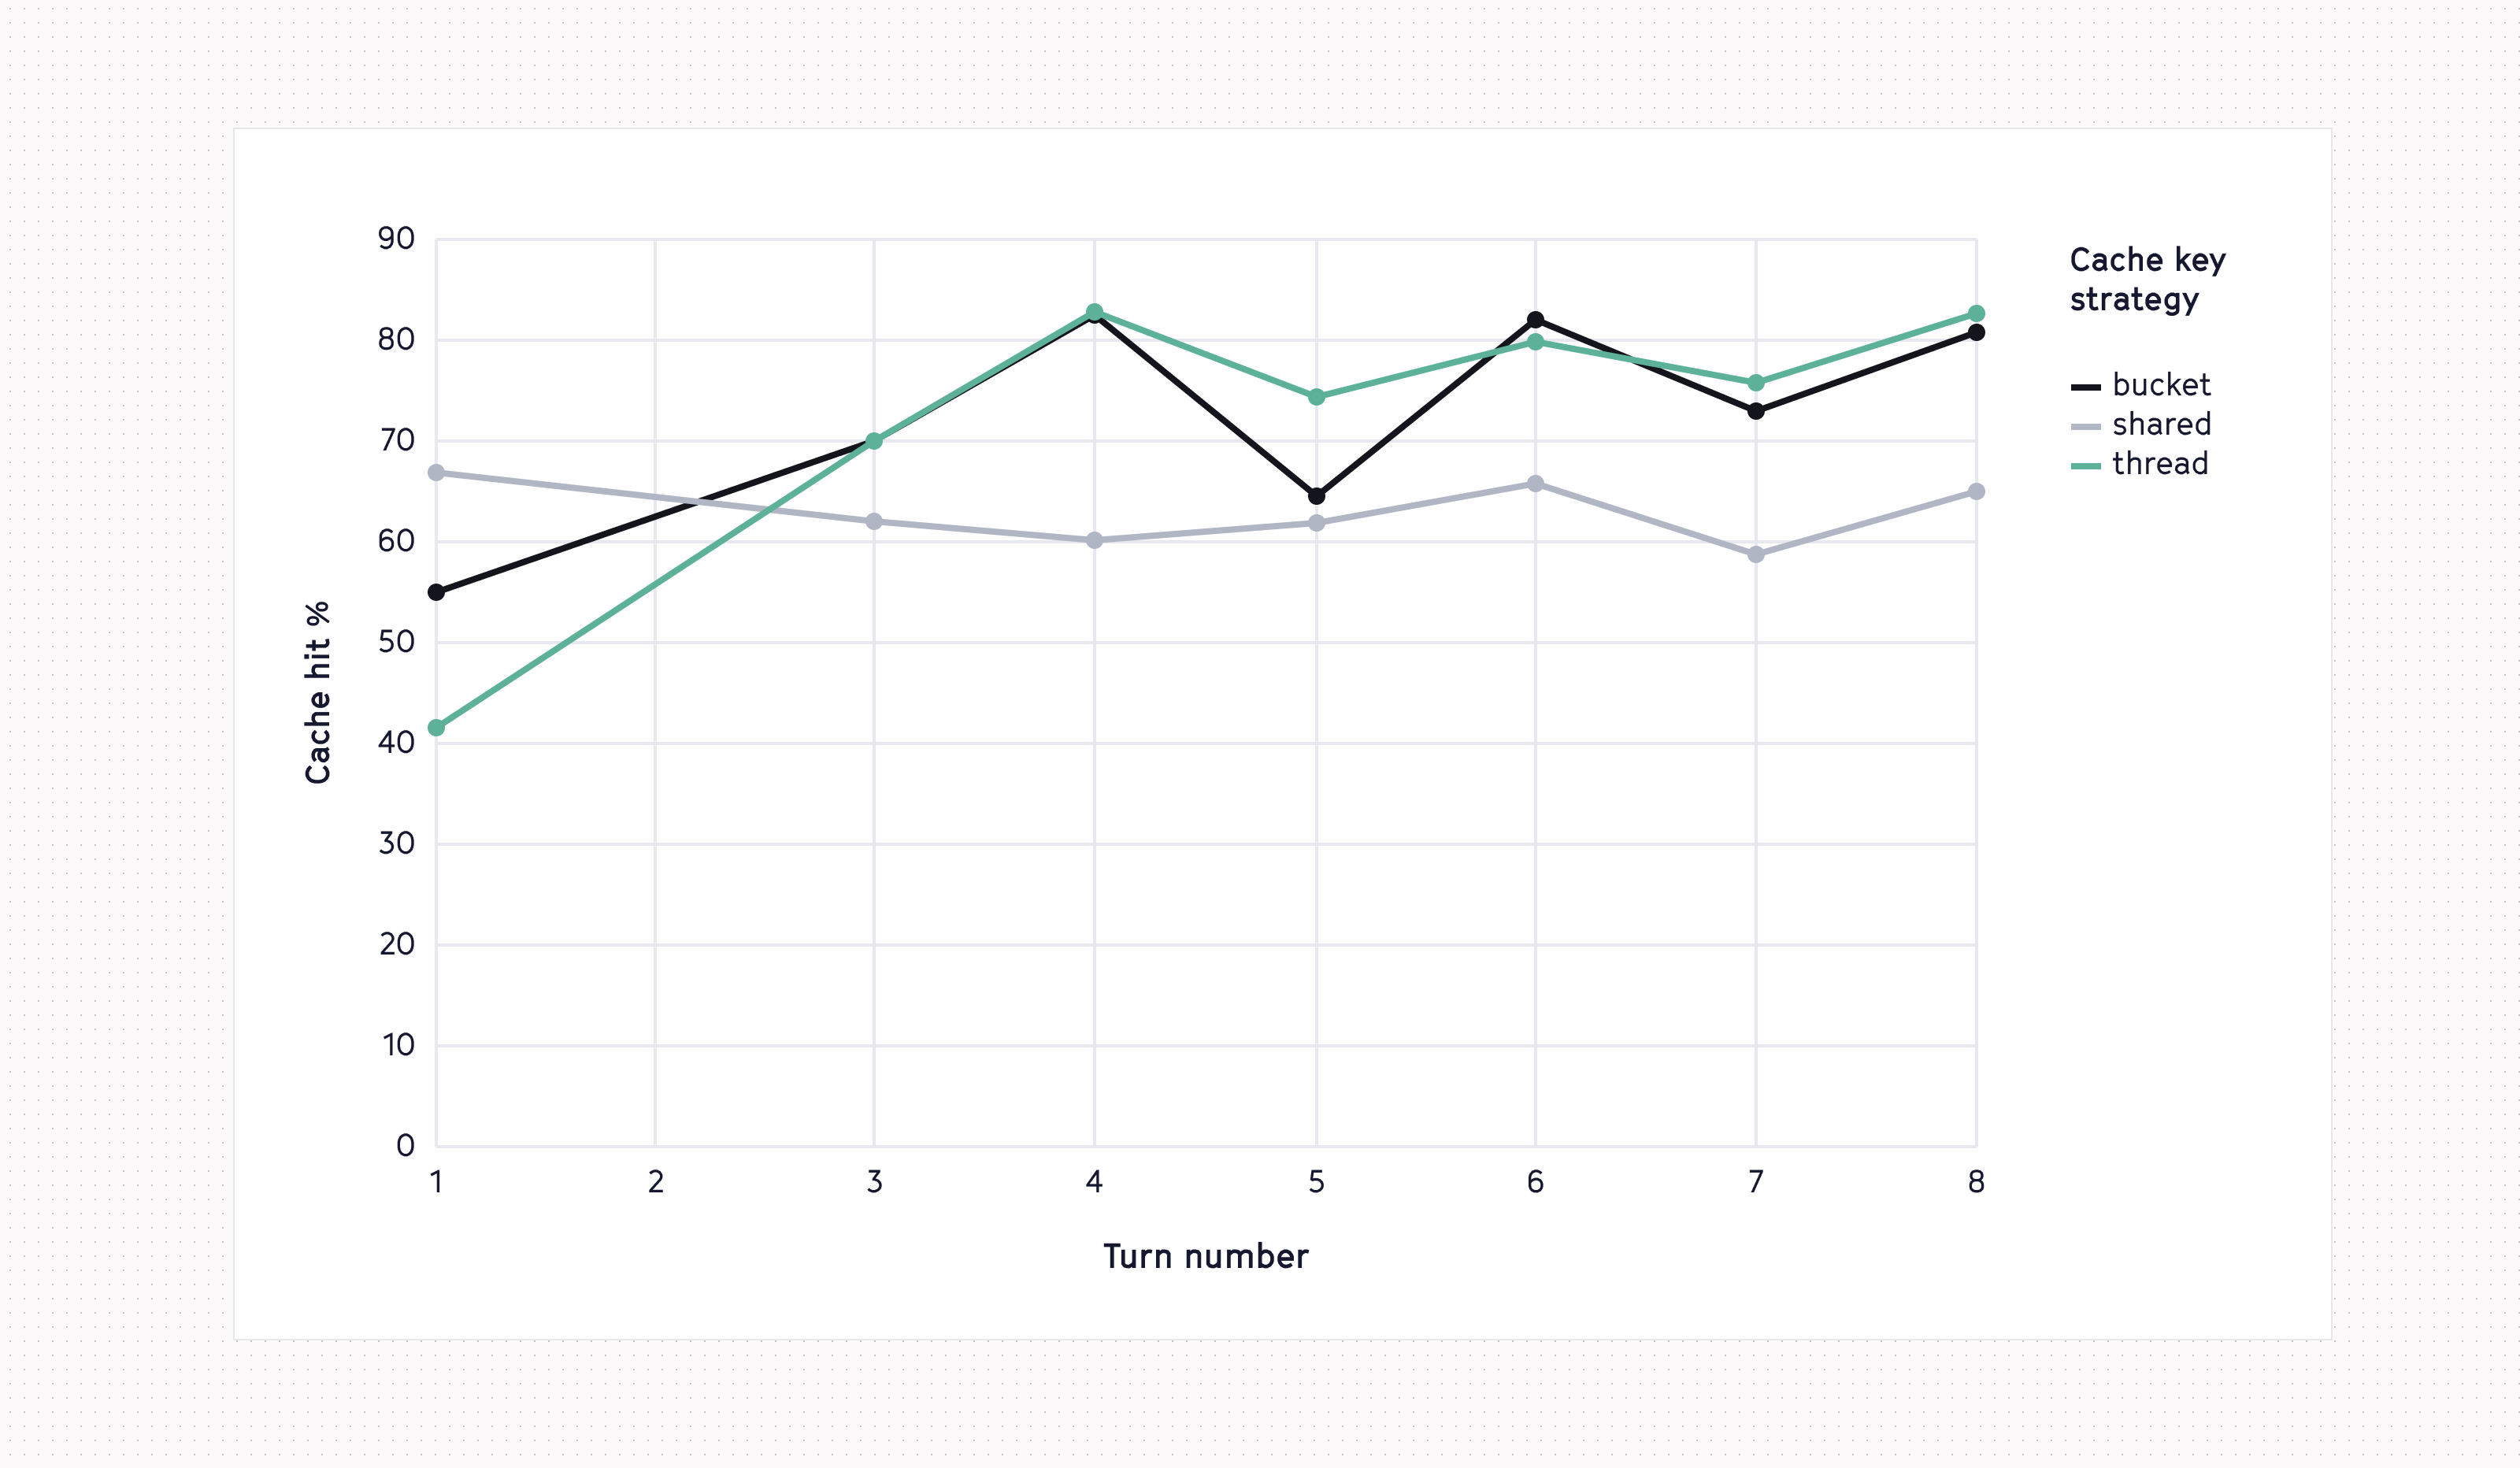
As you can see, the shared key had a roughly identical cache hit rate on every request. This makes sense in world where most requests aren’t actually routing to the same machine so the only thing that’s shared is the static part of the prompt and tools that are the same for every request.
The thread key started with a low cache hit rate but then slowly ramped up as the same threads got routed to the same machines, so a higher portion of tokens were cached as the context window grew. However, the thread cache key also had the lowest first iteration cache hit rate. This makes sense since virtually all requests were routed to different machines, meaning that very few of them were able to leverage the shared static parts of the prompt.
The bucket key followed a very similar trajectory as the thread key but had a higher first iteration hit as more of the requests were routed to the same machine. In the end, this was the key structure we opted to pick since we have a large volume of low or single iteration threads. Roughly, we landed on a cache key that looked like: hex_${modelType}_${orgId % N}_${userId % M}. We experimented with different values of N and M and were able to reduce mid-run full cache misses on OpenAI requests by 30%.
Cost is trickier than you’d think
With AI changing this fast, there's constant pressure to ship more features and move at the speed of light. That makes it dangerously easy to vibe-check your way into feeling like you have a good handle on cost — or (like us!) to lean too hard on metrics that don't tell the whole story. A 94% cache hit rate sounded great right up until we looked at what the other 6% was costing.
You need to measure the outliers, not the averages. The obvious levers underdelivered too. Cheaper models have their own fair share of gotchas and optimizing for fewer tokens didn’t move the needle.
And the lesson we keep re-learning building AI features: just look at the actual data. Going through expensive threads one by one gave us far more intuition than any metric and a stark reminder that real user behavior rarely looks like the eval runs.
Turns out caching really is all you need. Or at least, it's where we'd suggest starting!
If this is is interesting, click below to get started, or to check out opportunities to join our team.