Ad-hoc exploration

Izzy Miller, Dev Advocate at Hex
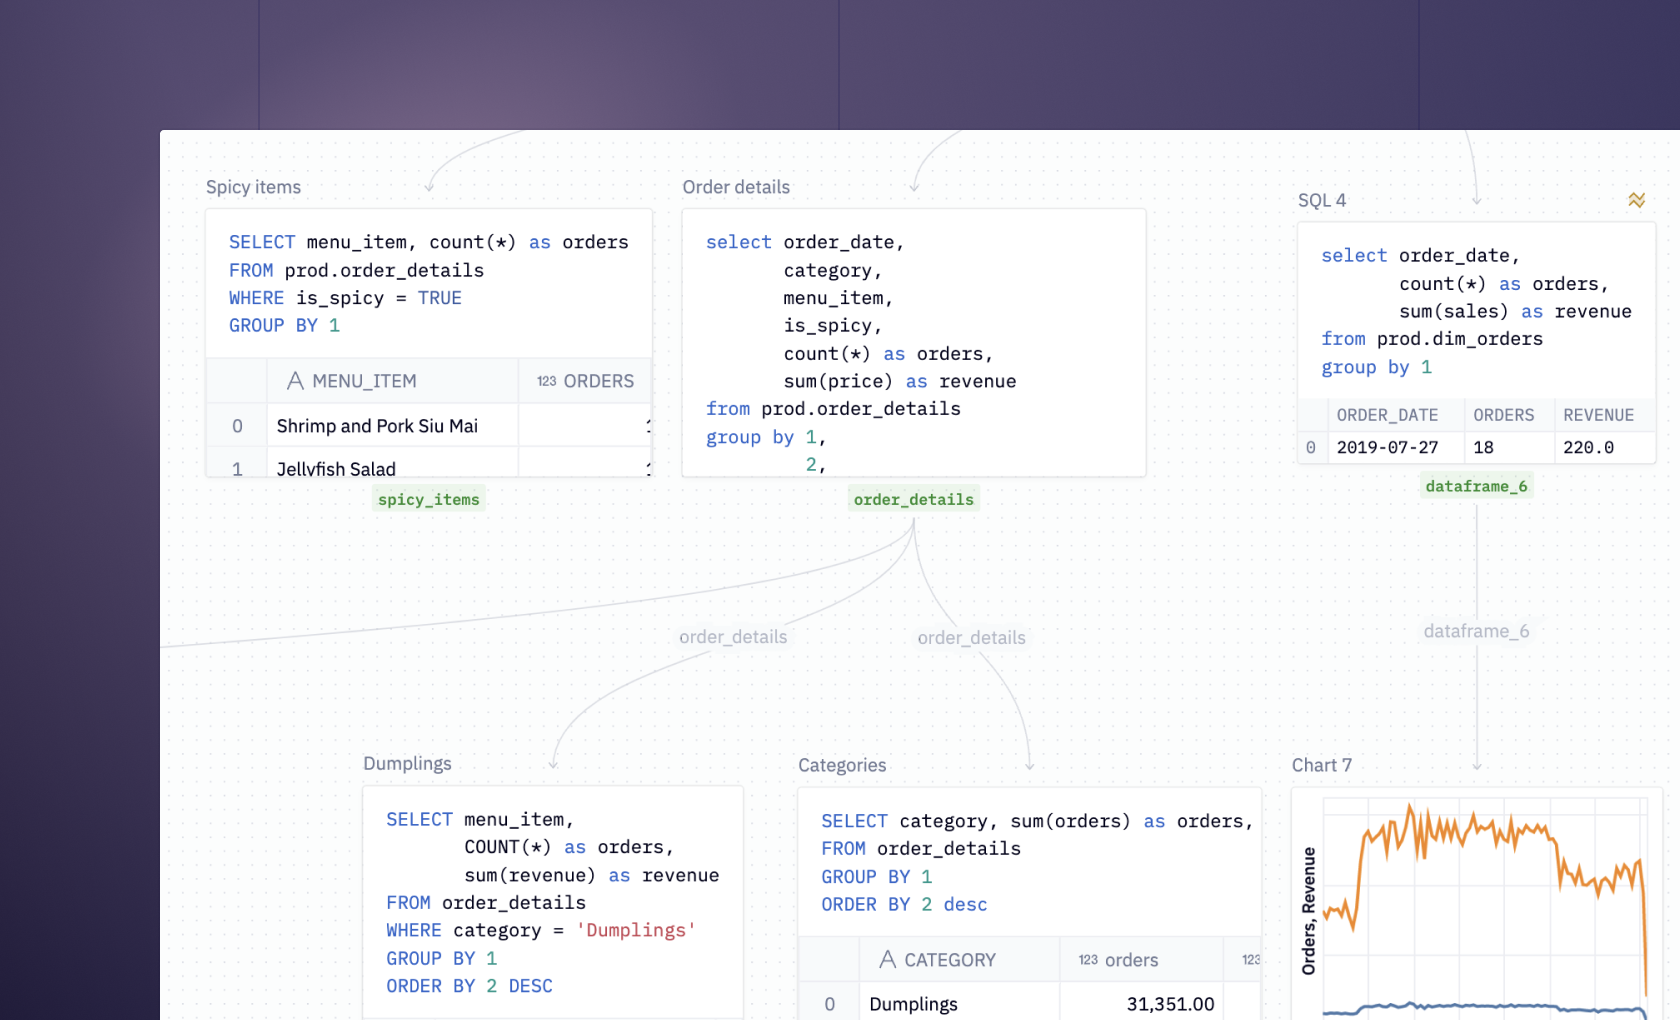
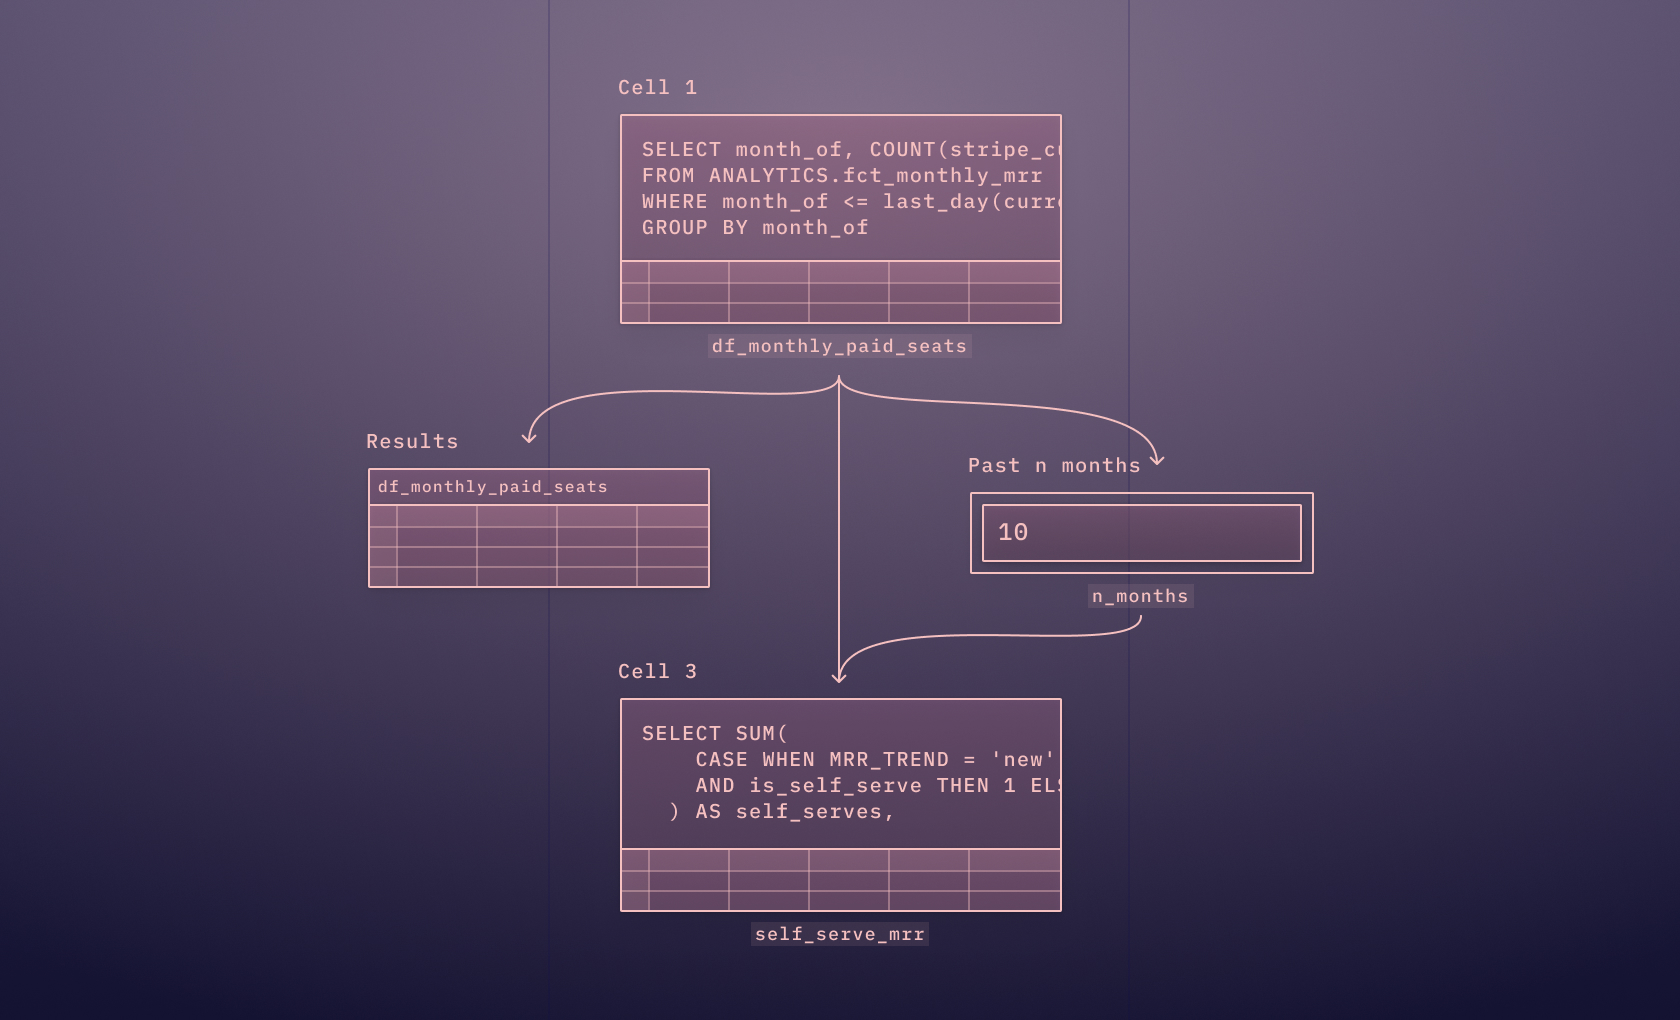
Ad-hoc exploration in Hex is like no other tool you've used before. SQL, Python, rich text, and a library of no-code tools are right at your fingertips in the same worksp...
How to build: Ad-hoc exploration
People think every data analysis you do should look beautiful and be based on well-modeled data after hours of planning meetings.
Of course, that isn’t the life of a data analyst. The reality is you get messy data and are asked to make sense of it, often by people with complex questions they want answered by that data. In these situations, data analysis isn’t about building great dashboards, it’s about building something that clearly articulates the question, the data, and the answer. It’s about ad-hoc analysis focusing on just that question-data-answer triumvirate to get the answer quickly.
Notebooks are a great option for this type of exploration as they let you easily see the results of any query or analysis and build up a report to answer the question easily.
Ad-Hoc vs Systematic Data Exploration
Ad-hoc analysis is a fascinating process where you start with a question and some scattered data, aiming to unearth the answer. It's a scenario where your data isn't neatly organized or centrally located—just a collection of information waiting to be explored and understood.
Ad-hoc analysis is characterized by a flexible and spontaneous approach:
Flexible Goals: Unlike pre-defined objectives, ad-hoc analysis often starts with a broad question or a general area of interest, which may evolve or become more specific as the analysis progresses.
Dynamic Approach: Instead of a planned method, ad-hoc analysis uses an exploratory and often improvisational approach. Analysts may need to adapt their methods as new data or insights emerge.
Adaptability Over Reproducibility: While systematic analysis emphasizes reproducibility, ad-hoc analysis prioritizes adaptability and the ability to pivot based on new findings or changing circumstances quickly.
Responsive Reporting: Ad-hoc analysis reports are typically generated as needed, often in response to immediate questions or developing situations, rather than on a regular schedule.
Ad-hoc analysis is particularly useful in scenarios requiring rapid insights, dealing with new or unexpected data, or exploring uncharted or innovative areas where established methodologies might not exist.
The opposite of ad-hoc data exploration is typically structured or systematic data analysis. While ad-hoc data exploration involves spontaneous, unstructured investigation of data, often driven by immediate questions or curiosity, structured data analysis follows a pre-defined plan or methodology.
In structured data analysis:
Pre-defined Goals: Objectives and questions are defined before the analysis begins.
Systematic Approach: A planned method or procedure is used, often following a specific framework or model.
Reproducibility: The steps in the analysis are documented and can be repeated, ensuring consistent results.
Scheduled Reporting: Reporting and insights are often part of a scheduled process, such as monthly business reports, rather than being generated spontaneously.
Both are necessary for modern data analysis in companies. You want long-term reporting of defined goals for the company but also have the ability to spin up individual analyses as needed for specific questions teams may have.
The Uses of Ad-Hoc Data Exploration
The versatility of ad-hoc analysis lends itself to use across a huge range of fields of industries—anywhere there is data, ad-hoc data exploration can help uncover insights and inform decision-making processes.
Business intelligence. Ad-hoc analysis allows companies to understand market trends and consumer preferences quickly. This instant analysis is vital for adapting marketing strategies, pricing, and product development in real time. Businesses utilize ad-hoc analysis to discover customer data, uncovering patterns and preferences that inform targeted marketing campaigns, product enhancements, and personalized customer experiences.
Scientific research. Researchers often use ad-hoc analysis during the initial stages of their work to explore datasets and identify interesting patterns or anomalies. This exploration can guide the direction of their research and hypothesis formulation. Ad-hoc analysis helps generate hypotheses by allowing researchers to interact with the data in an exploratory manner, often leading to serendipitous discoveries and new research questions.
Healthcare. In healthcare, ad-hoc analysis of patient data can assist in making swift diagnoses. Analyzing patient symptoms, history, and test results on the fly can lead to faster and more accurate treatment decisions.
Retail and eCommerce. Ad-hoc analysis helps retailers understand purchasing patterns and seasonal trends, enabling effective inventory management and optimization. By analyzing customer data, retailers can segment their customer base and tailor marketing strategies to different groups, enhancing customer engagement and sales.
Finance and banking. Financial institutions use ad-hoc analysis to assess credit risk, detect fraudulent activities, and manage financial risks in real-time. Ad-hoc exploration of market data also allows investors and analysts to identify investment opportunities and trends, supporting informed decision-making in a fast-paced market.
Logistics and supply chain management. Ad-hoc analysis helps optimize delivery routes and schedules based on real-time traffic data, weather conditions, and customer demand. Analyzing supply chain data helps identify bottlenecks and inefficiencies, enabling businesses to streamline operations and reduce costs.
A Quick Ad-Hoc eCommerce Analysis Example
Let's work through how ad-hoc data exploration might work in one of those industries: eCommerce.
We’ll take a hypothetical scenario inspired by the Dune universe. Imagine you're analyzing data for a Product Manager at a company akin to a futuristic corporation from Dune, which has recently launched a new suit featuring an integrated headlamp. This is similar to introducing any new product feature.
The goal? To analyze usage data and determine whether this innovation warrants further research and development.
Connect your data sources
First, we want to connect our data sources. In ad-hoc data exploration, unlike systematic data analysis that relies on consistent data sources, you may need to pull data from diverse sources.
Data warehouse: A data warehouse is a centralized repository of integrated data from one or more disparate sources, normally production databases. If you have a systematic data analysis set-up, it will probably pull data from a warehouse.
CSV files. CSV (Comma Separated Values) files are a common format for storing tabular data. They are easy to generate from various tools and are ideal for importing data into analytical tools for quick, ad-hoc analysis.
APIs. APIs enable real-time data access from various online services and databases. They are crucial for gathering up-to-date information from web-based platforms, social media, and other online platforms.
Spreadsheet Applications: Tools like Microsoft Excel or Google Sheets are often used for ad-hoc data analysis. They are particularly useful for smaller datasets and can be a quick and accessible way to explore and visualize data.
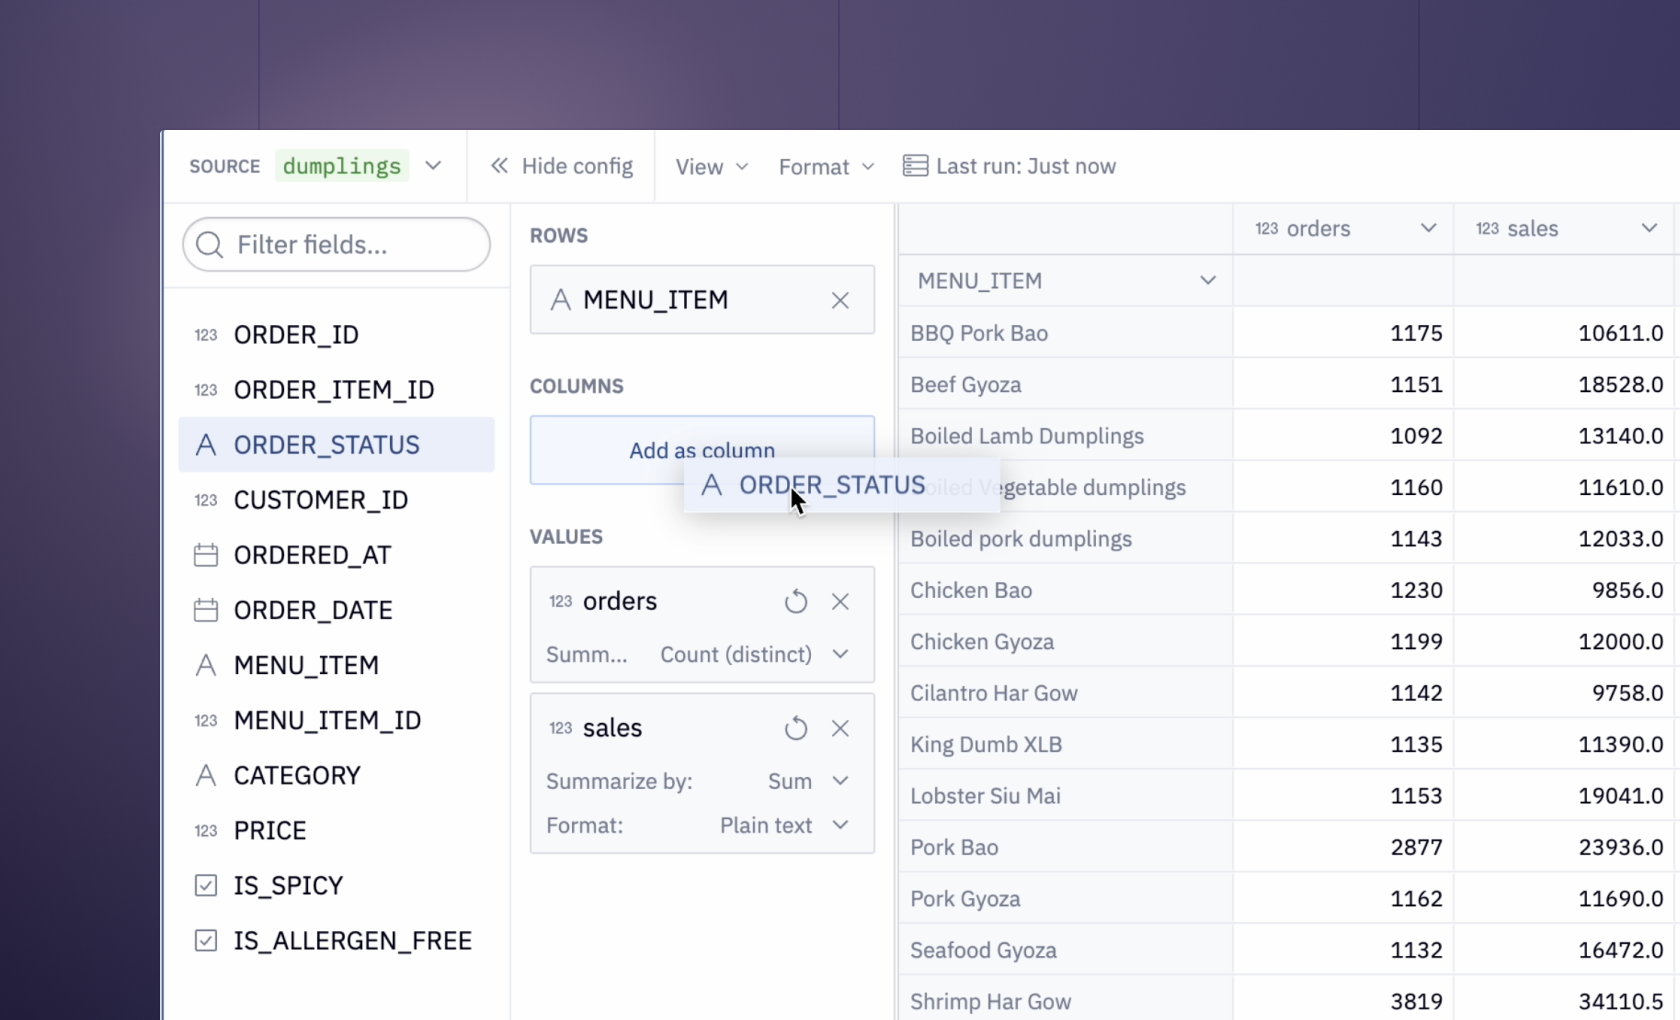
Here, we have this data in a data warehouse. A key benefit for data analysts is that it allows us to query the data using SQL, a language data analysts are familiar with.
Initial analysis
Our first step in this exploration is to assess headlamp usage. We initiate this by querying our database for relevant events, like instances when someone activated their headlamp.
SELECT DATE_TRUNC(e.time,WEEK) AS week,
       COUNT(DISTINCT e.expedition_id) AS expeditions,
       SUM(CASE WHEN s.EVENT_NAME = 'engage_headlamp' THEN 1 ELSE NULL END) AS headlamp_usage
FROM stillsuit_events.expeditions e
LEFT JOIN stillsuit_events.suit_events s ON s.EXPEDITION_ID = e.EXPEDITION_ID
GROUP BY 1
ORDER BY 1 ASC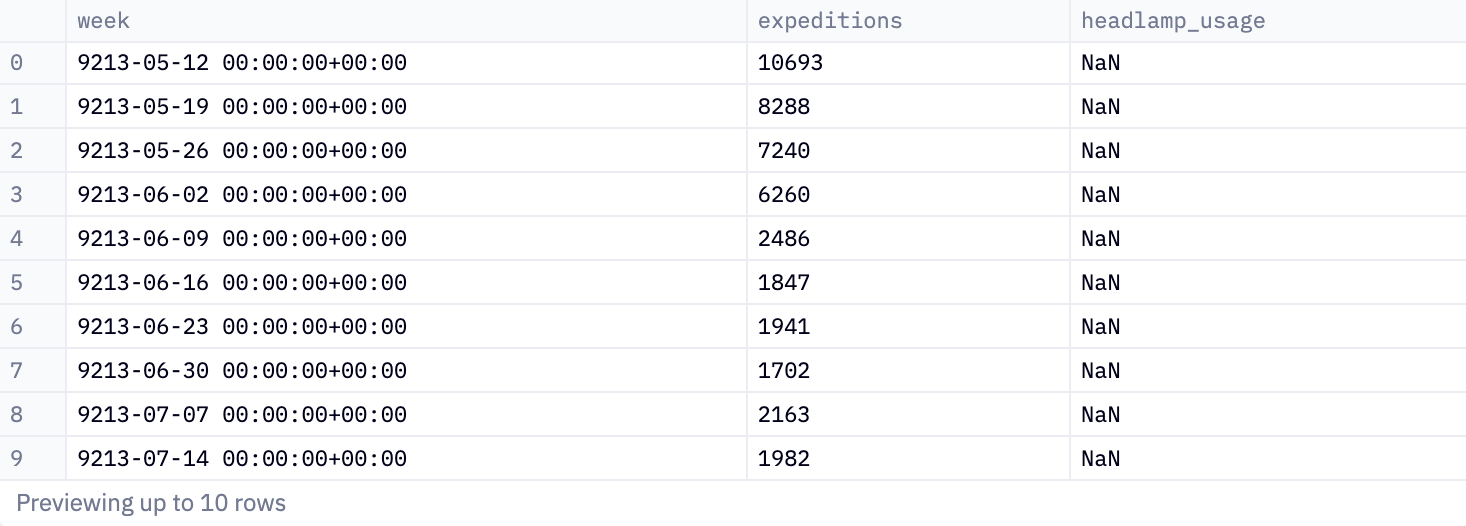
This query provides a weekly summary of expeditions and headlamp usage. It gives the number of unique expeditions and counts how often headlamps were used in these expeditions, grouped by each week.
In Hex, this outputs a Pandas DataFrame, making it versatile and usable across various platforms like Python. This is ideal because, whereas SQL is the de facto language of databases, Python is the de facto language of data analysis. Being able to seamlessly switch between the two makes quick data analysis easier. Without this polyglot option, you end up with:
Always using SQL: This is good for querying data but not good for data analysis because SQL lacks the advanced statistical and analytical functions found in Python. While SQL excels at data retrieval and basic aggregation, it falls short in complex data manipulation, machine learning capabilities, and sophisticated data visualization, which are essential for in-depth data analysis.
Always using Python: This is good for analysis, and you can use database connectors to query databases, but it can be less efficient for large-scale data processing directly from databases. Python, while powerful for analysis and data manipulation, may not be as optimized as SQL for handling large datasets directly from a database, potentially leading to slower performance and higher resource consumption during data extraction and initial processing.
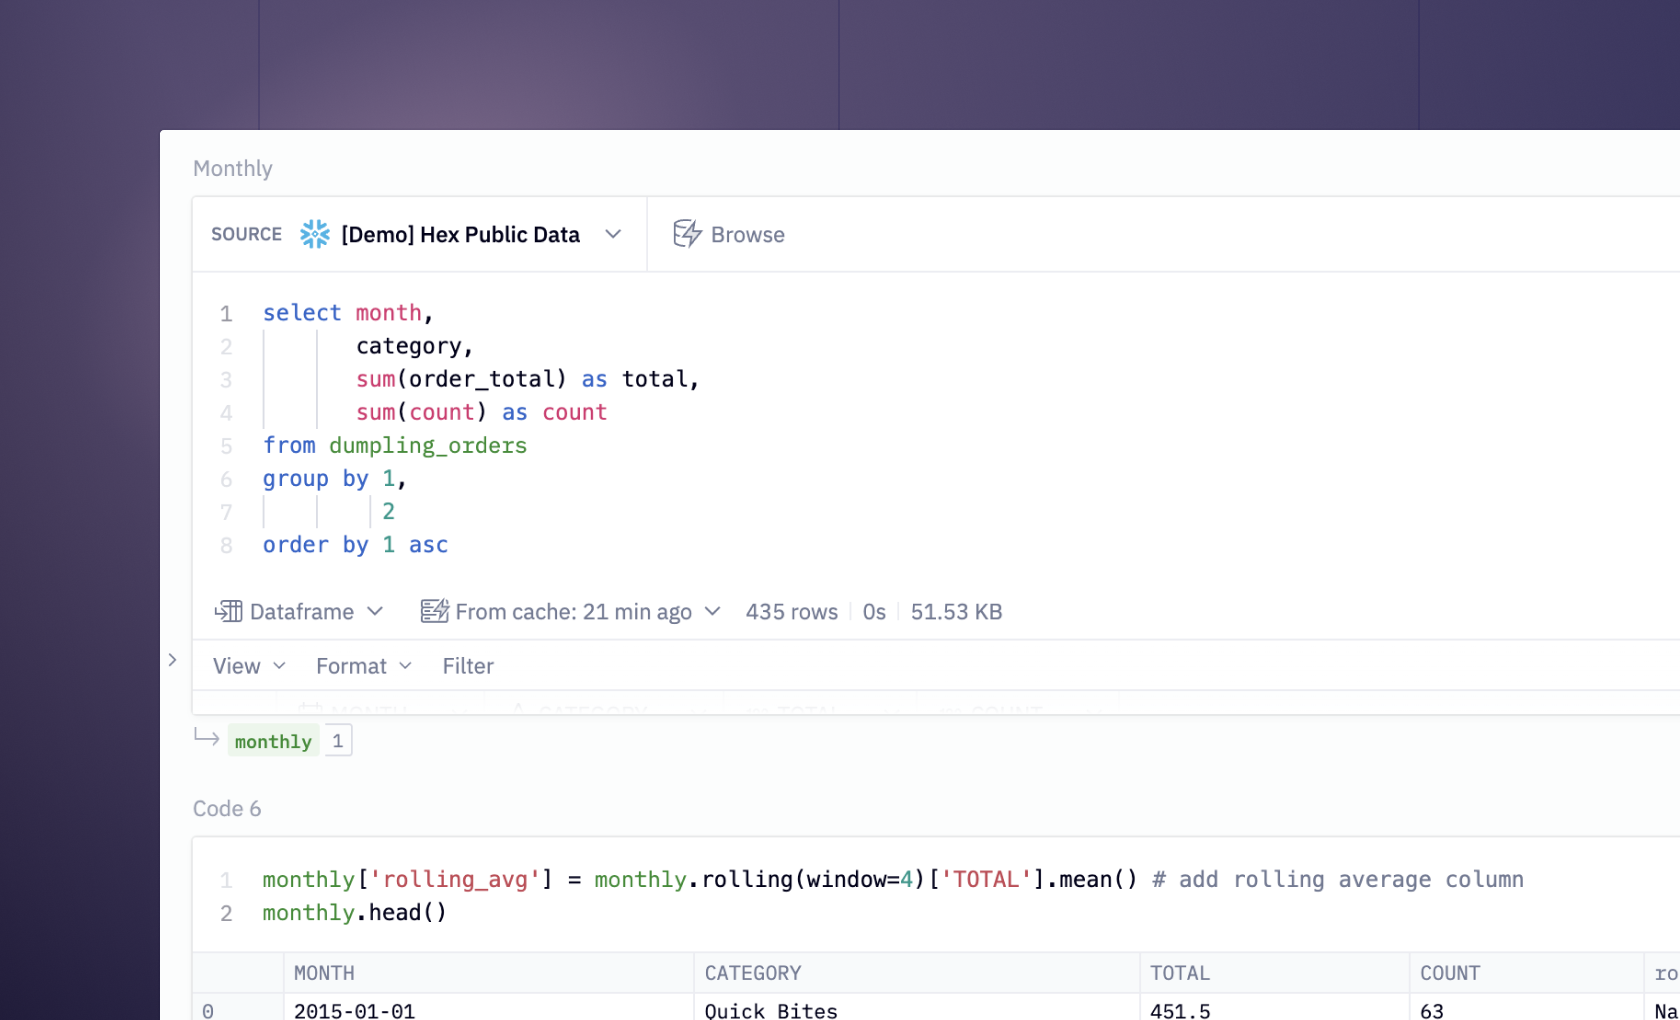
In Hex, you can chain SQL queries, enabling iterative, SQL-based analysis in a familiar notebook format without heavy reliance on Python. For example, we can quickly refine our search to the past couple of weeks, aligning with the recent introduction of headlamps.
SELECT * FROM headlamp_usage
WHERE date(week) > CAST('9214-01-28' AS date)
ORDER BY 1 ASC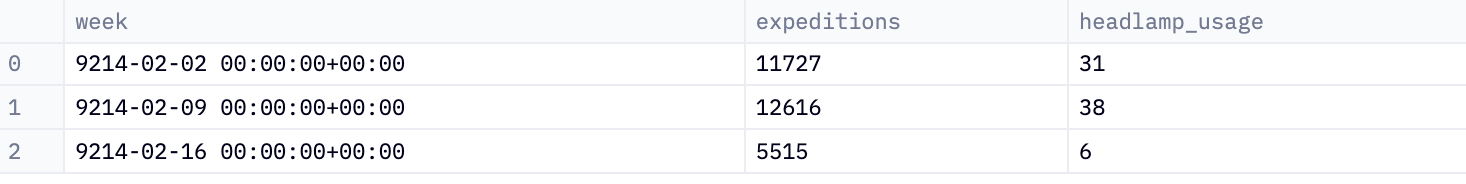
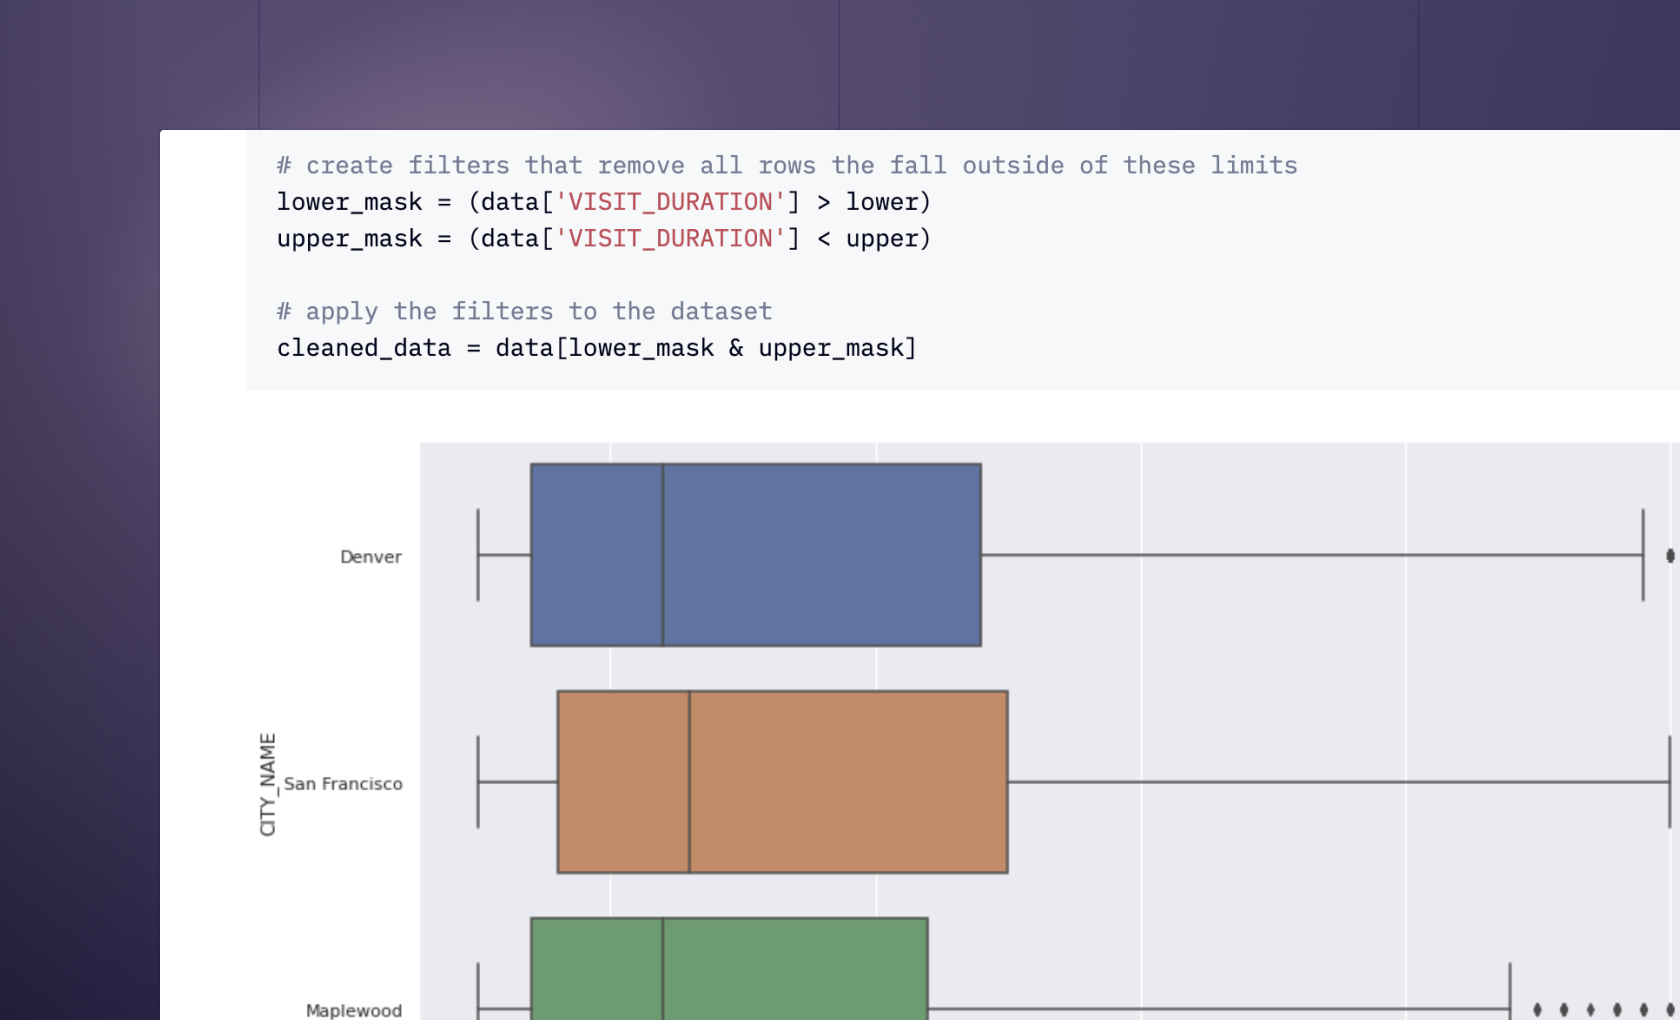
We then pivot to Python for some quick data cleanup:
headlamp_usage = headlamp_usage.drop(headlamp_usage.tail(1).index) ## drop most recent entry as it's incomplete, week still goingAnother query helps us examine field expedition frequencies:
WITH EXPEDITIONS AS (
    SELECT e.expedition_id,
    SUM(CASE WHEN s.EVENT_NAME = 'engage_headlamp' THEN 1 ELSE NULL END) AS headlamp_usage
FROM stillsuit_events.expeditions e
LEFT JOIN stillsuit_events.suit_events s ON s.EXPEDITION_ID = e.EXPEDITION_ID
WHERE s.TIME > CAST('9214-01-16' AS TIMESTAMP)
GROUP BY 1
)
SELECT COUNT(*) AS recent_expeditions FROM expeditions WHERE headlamp_usage > 0
Which we then display using Python and single-value cells:
recent_expeditions_with_headlamps = int(recent_headlamp_using_expeditions['recent_expeditions'].sum())
all_recent_expeditions = int(headlamp_usage['expeditions'].sum())
ratio = recent_expeditions_with_headlamps / all_recent_expeditions
Which we then display using Python and single-value cells:
recent_expeditions_with_headlamps = int(recent_headlamp_using_expeditions['recent_expeditions'].sum())
all_recent_expeditions = int(headlamp_usage['expeditions'].sum())
ratio = recent_expeditions_with_headlamps / all_recent_expeditions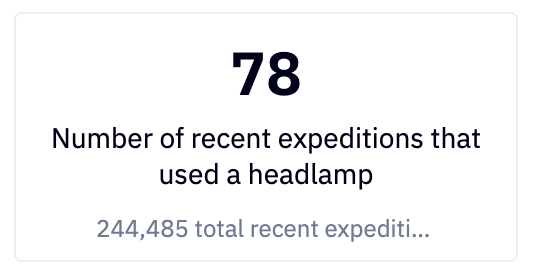
Visualizing the Data
The use of Hex single-value cells brings us neatly on to a core part of any ad-hoc data exploration: visualization of the data.
In ad-hoc analysis, visualization serves two distinct purposes:
Visualization for the Analyst: This involves creating visual representations of data to help the analyst identify trends, patterns, and outliers during the exploratory phase, helping them gain a deeper understanding and guiding further analysis.
Visualization for the Audience: This focuses on presenting data in an accessible and comprehensible manner to end-users and decision-makers, highlighting key findings and insights in a clear, engaging, and persuasive way.
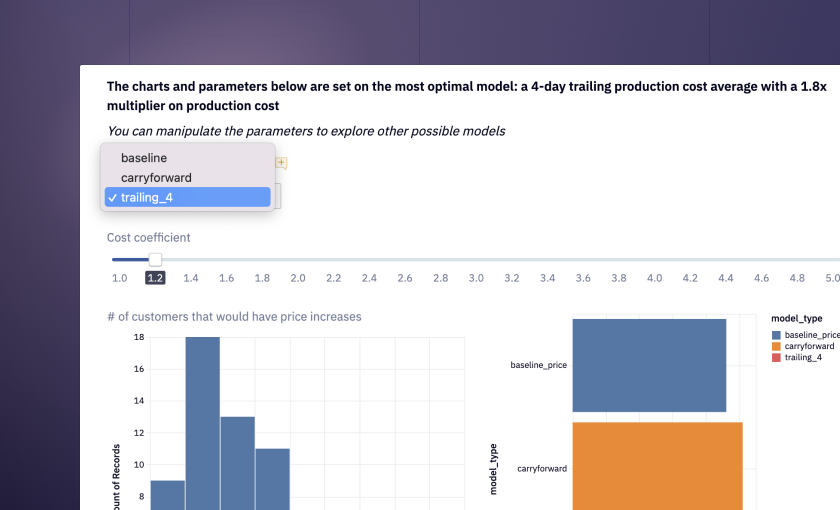
The single-value cell is a great example of the latter. We can also plot out a bar chart showing the output from our Python analysis:
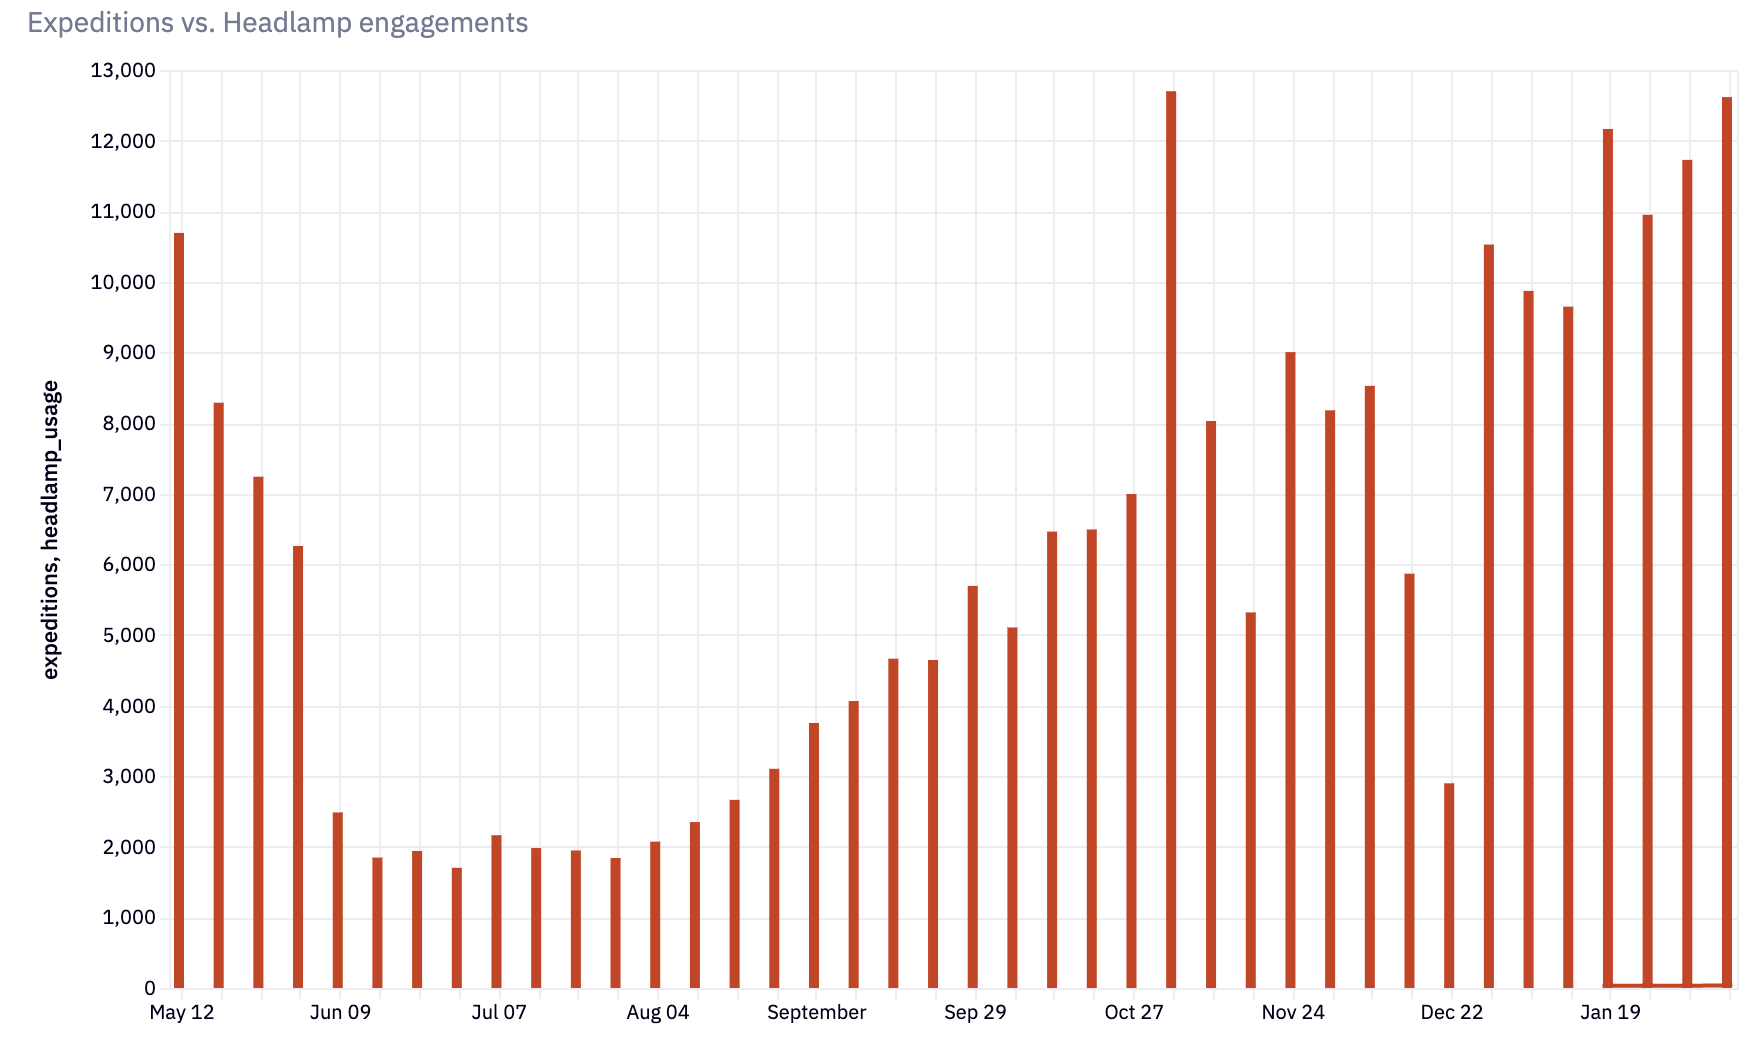
This is a useful graph for both analyst and end user. For the end-user it gives a good insight into headlamp usage throughout the year. A good product manager will see that nice demand curve increasing through the year and be thinking about what marketing or product work needs to be done to maximize use during the winter months.
A good analyst will be thinking about how to break down the data further to understand dark mode usage.
Creating a narrative
Let’s perform that analysis while looking at another key component of ad-hoc data exploration—the story.
A flaw you find in too much ad-hoc analysis is a lack of narrative. Analysts think that just showing the data is enough in these circumstances. Narrative is for more systematic reporting. But the narrative is critical to ad-hoc data exploration because it contextualizes the data, transforming raw numbers and findings into a coherent story that explains why these insights matter. It helps in connecting the dots between disparate data points, making the analysis more meaningful and actionable for decision-makers who may not be as data-savvy.
The beauty of Hex lies in its ability to integrate markdown cells directly into the logic view environment. This feature helps structure your research and allows you to pose questions in simple language, creating a clear outline to guide your investigation.
Say the analyst wants to highlight the nighttime nature of this product use. They can use the data plus visualization plus narration to get the point across. First, they break down the data further into hourly use with a chained SQL query:
SELECT EXTRACT(HOUR from e.time) AS hour_of_day,
       COUNT(DISTINCT e.expedition_id) AS expeditions,
       SUM(CASE WHEN s.EVENT_NAME = 'engage_headlamp' THEN 1 ELSE NULL END) AS headlamp_usage
FROM stillsuit_events.expeditions e
LEFT JOIN stillsuit_events.suit_events s ON s.EXPEDITION_ID = e.EXPEDITION_ID
WHERE s.TIME > CAST('9214-01-16' AS TIMESTAMP)

GROUP BY 1
ORDER BY 1 ASC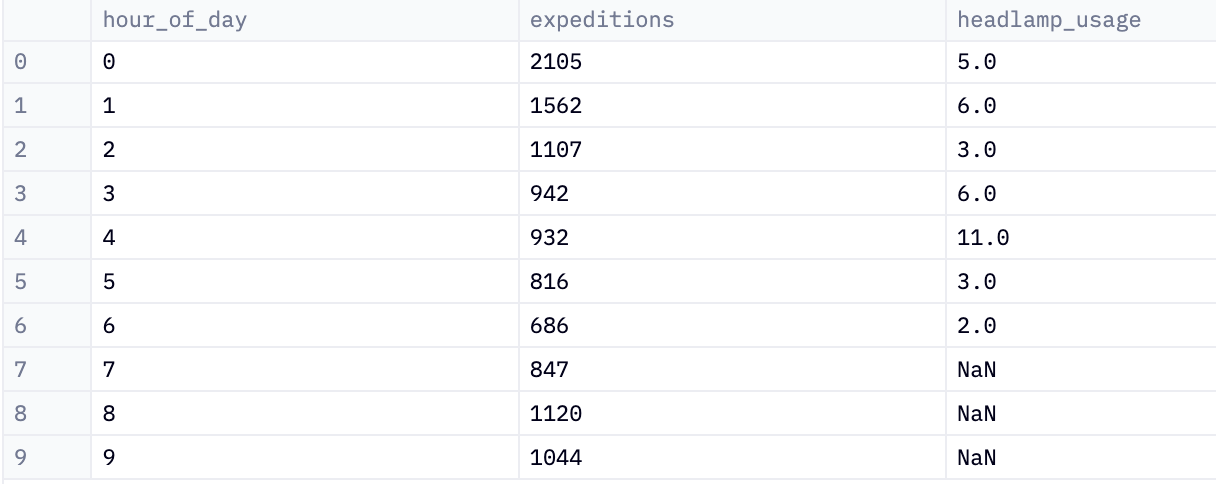
Then they can visualize this data, adding markdown to build the narrative:
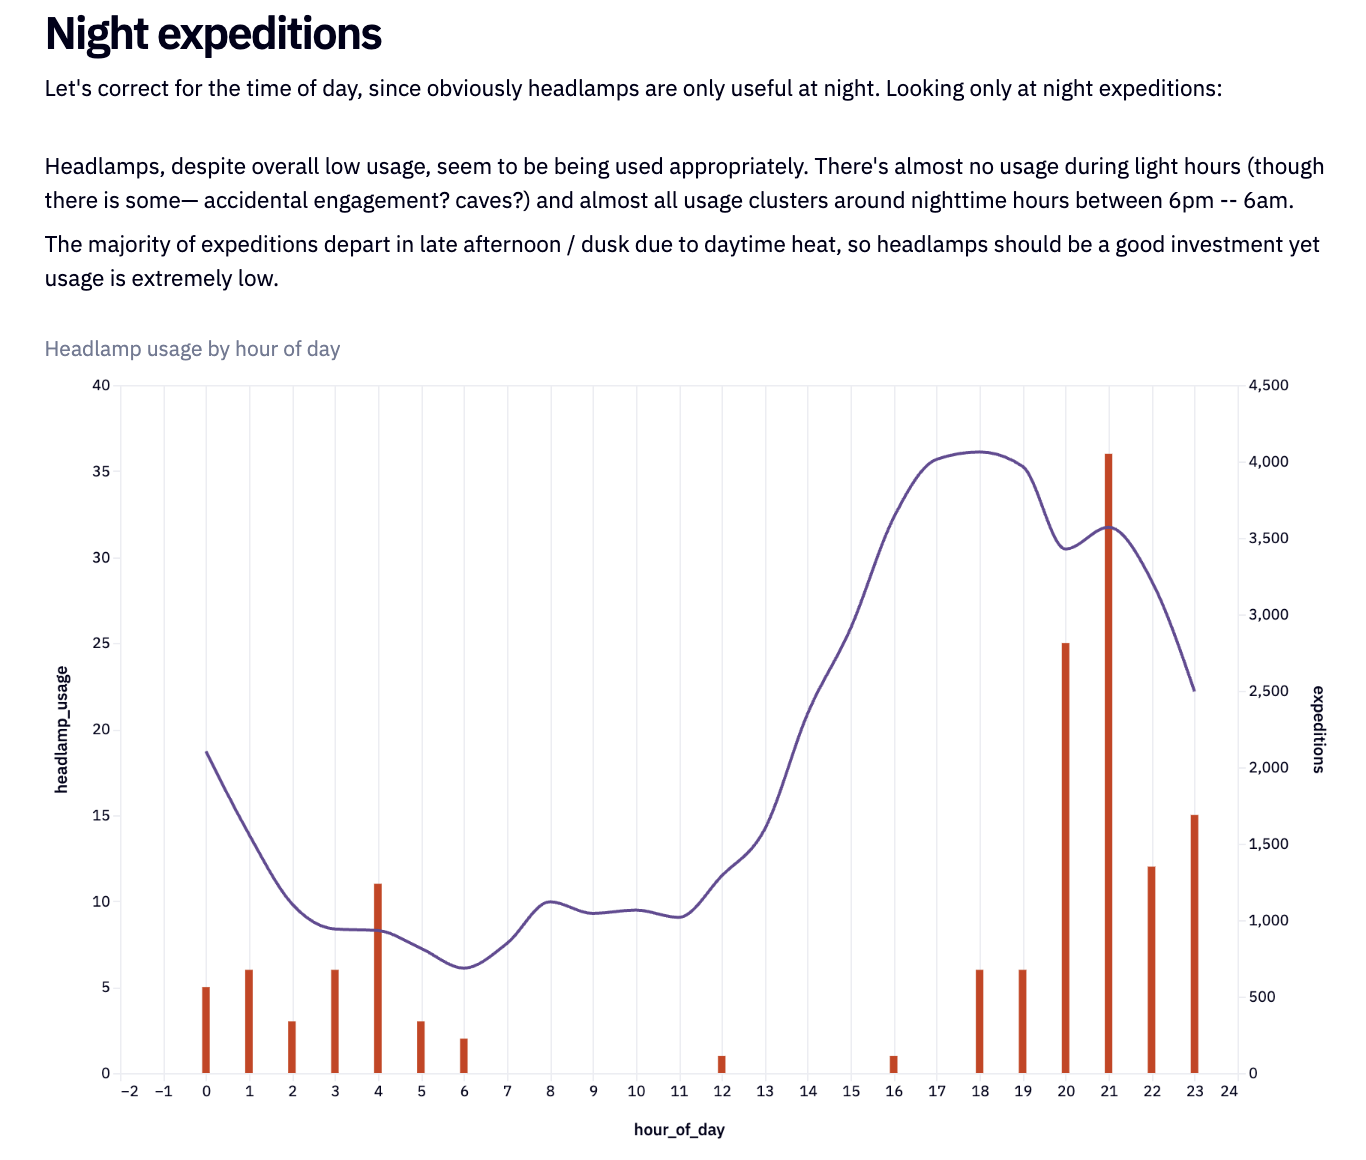
This now gives the product manager all they need to know about headlamp usage. We can then use the same steps for other insights. Let’s look at user adoption within our dataset:
SELECT CAST(s.WEARER_ID AS STRING) AS wearer_id,
       COUNT(DISTINCT e.expedition_id) AS expeditions,
       SUM(CASE WHEN s.EVENT_NAME = 'engage_headlamp' THEN 1 ELSE NULL END) AS headlamp_usage
FROM stillsuit_events.expeditions e
LEFT JOIN stillsuit_events.suit_events s ON s.EXPEDITION_ID = e.EXPEDITION_ID
WHERE s.wearer_id IS NOT NULL AND EXTRACT(HOUR from s.TIME) IN(0,1,2,3,4,5,6,20,21,22,23,24) AND s.TIME > CAST('9214-01-16' AS TIMESTAMP)
GROUP BY 1
HAVING SUM(CASE WHEN s.EVENT_NAME = 'engage_headlamp' THEN 1 ELSE NULL END) > 0
ORDER BY 3 DESC

# Then compute the ratio of headlamp usage per expedition
SELECT wearer_id, headlamp_usage::float/expeditions::float*100 AS ratio
FROM user_usage
ORDER BY 2 DESC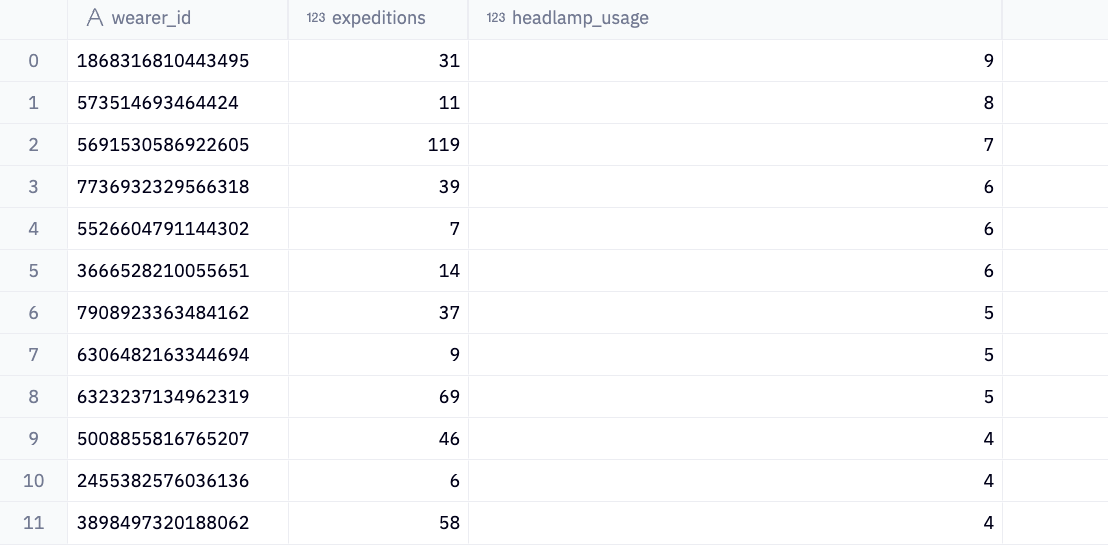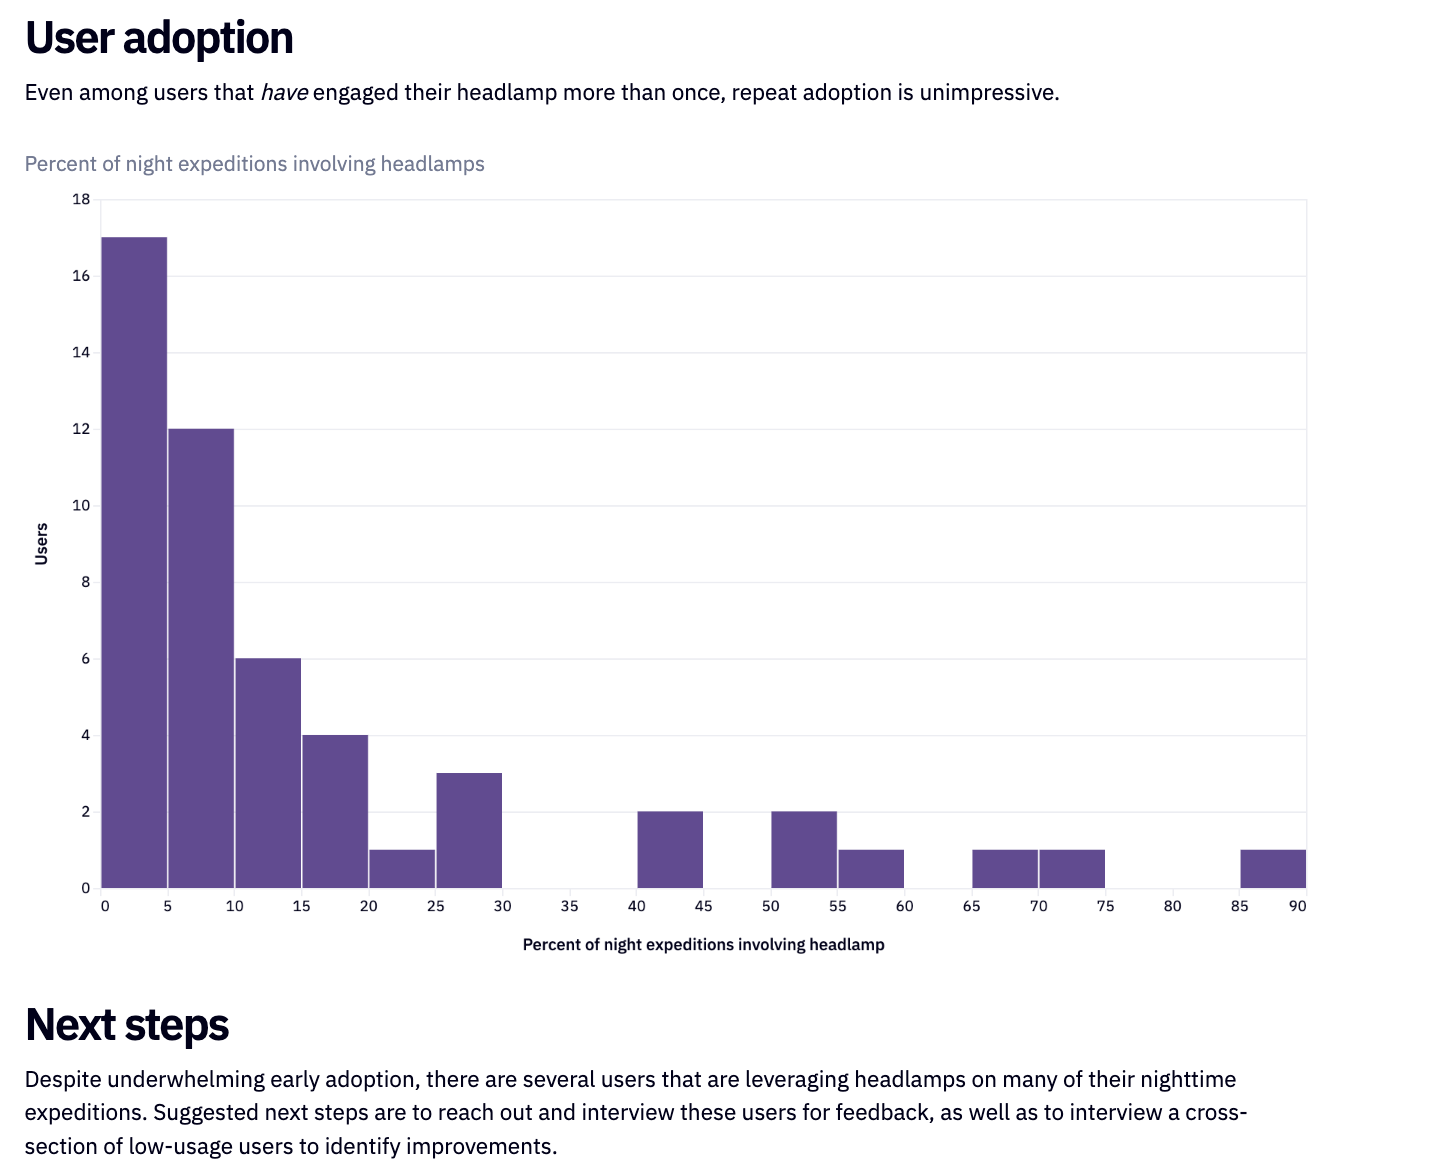
Hex enables us to document these findings, creating an easy-to-understand write-up swiftly. The final product isn't just a static report but an interactive document or app. This allows readers to comprehend our conclusions and actively engage with the underlying data.
What began as a simple question paired with unstructured data quickly transformed into a comprehensive, interactive document. This document doesn't just provide an answer; it narrates the journey of discovery, available for anyone in the company or the public (if based on public data) to view and interact with. This exemplifies the power of ad-hoc data exploration–turning raw, unstructured information into insightful, accessible knowledge.
How to Perform Ad-Hoc Data Exploration
How do you go about performing the same type of analysis as above at a high-level?
First define the objective. You need to understand the question being asked. This might require you sitting down with the end-user (the PM in this case) and getting a clear understanding of what you want to know or the problem you need to solve.
You also need to set the scope at this stage. Determine the scope of your analysis–what's included and what's not.
Next, gather and integrate the data. Determine where your data will come from (e.g., databases, spreadsheets, APIs). and connect to these data sources. In Hex, this is easy, but in a Jupyter notebook you will have to use tools or scripts to connect to these data sources. Then consolidate the data from different sources and clean it for consistency. This may involve removing duplicates, handling missing values, and ensuring correct data types.
Yo can then start to explore the data. This doesn’t need to be sophisticated. The initial exploration should just use basic statistics and visualization (like histograms, scatter plots) to understand distributions, trends, and anomalies in your data. Then get into performing operations like filtering, grouping, or creating new calculated fields to refine your analysis.
Depending on your question, you might need to use more advanced analytical techniques such as regression analysis, clustering, or time series analysis. But rather than focus on the sophistication of the techniques, it is more important to perform iterative exploration, as ad-hoc analysis often involves going back to the data to refine your queries or explore new angles based on initial findings.
While doing this, you need to visualize your results. Depending on your findings, select the type of visualization (like line charts, bar graphs, heat maps) that best represents your data. Almost always, it makes sense to create interactive dashboards that allow for further exploration of the data by both you as the analyst and then the end-user.
As above, with the narration, you need to interpret and communicate your findings. Don’t be afraid to draw conclusions that answer your initial questions—that is what’s needed, and the whole point of using a notebook!
Throughout all this, a final recommendation is to document the process. This is obviously taken care of if you are using a cloud notebook like Hex—everything is saved. But if you are doing ad-hoc scripting you need to document the analysis process, including the queries used, transformations made, and insights found. Even in ad-hoc analysis, it's important to ensure that someone else could follow your steps and arrive at the same conclusions.
Best Practices
Always keep the end goal in mind and don't get lost in the data.
Be critical of your findings and validate them.
Be aware of and account for any biases in your data.
Remember that ad-hoc analysis is often a starting point for more systematic research.
By following these steps, you can effectively perform ad-hoc data exploration, turning raw data into actionable insights.
See what else Hex can do
Discover how other data scientists and analysts use Hex for everything from dashboards to deep dives.
"Hex has the best parts of using a Jupyter notebook without the limitations. I hadn’t really experienced being able to slip really quickly between the logic and the application builder view before Hex."
Nina Anderson
Infinite Lambda
Ready to get started?
You can use Hex in two ways: our centrally-hosted Hex Cloud stack, or a private single-tenant VPC.