SQL Notebooks

Izzy Miller
All the organizational power of code notebooks, tailor-made for your SQL workflows. Chain SQL queries, join across data sources, and access cloud-scale data in a collaborative SQL IDE.
How to build: SQL Notebooks
Python gets all the love in data analysis. It’s the language that lets you do something as simple as manipulating arrays or something as complex as building machine learning models. It is the de facto language of data analysis.
But it isn’t always the right choice and isn’t always the most powerful choice. Python’s power comes from its “jack of all trades” design. But if you work directly with data in a database or data warehouse, SQL, or Structured Query Language, is by far more powerful. Its structured nature allows analysts to quickly and accurately extract relevant data from databases. SQL is designed for data interaction, making it acutely effective for sorting, filtering, and summarizing data. This efficiency is crucial in data analysis where timely and precise data extraction is often required.
Most database systems, whether traditional relational databases like MySQL and Postgres, or newer, big data platforms like Hadoop, support SQL queries. This universality means learning SQL equips analysts with a tool applicable across various systems and organizations, enhancing their versatility and employability. SQL is instrumental in advanced data operations such as joining multiple tables, a frequent requirement in data analysis. Combining data from different sources into a coherent dataset is essential for comprehensive analysis. SQL easily handles these operations, facilitating complex data analysis tasks that would be cumbersome or inefficient in other languages.
So, let’s show why this language is so powerful and how you can perform entire exploratory analysis workflows using SQL.
Why You Should (Sometimes) Choose SQL Over Python
Choosing SQL exclusively over Python for data analysis can be justified by several reasons, each focusing on the unique strengths and appropriateness of SQL in specific data-related tasks:
- Optimized for Large Datasets: SQL is specifically designed to interact with databases. It excels in handling large datasets efficiently, which can be more resource-intensive in Python, especially when dealing with large databases. SQL commands are executed directly on the database server, reducing the need to transfer large volumes of data over the network, which can be a significant bottleneck in Python.
- Performance with Complex Queries: SQL is highly efficient in performing complex queries, especially those involving multiple tables and aggregations. While Python can certainly handle complex data manipulations, SQL's declarative nature allows it to optimize query execution at the database level, often resulting in faster performance for data retrieval and analysis.
- Transactional Integrity and Concurrency Control: SQL databases are designed with a strong emphasis on transactional integrity and concurrency control. These features are crucial in scenarios where data consistency and integrity are paramount, such as financial or transactional systems. While Python has libraries to interact with databases, the native transactional controls and concurrency mechanisms of SQL databases are often more robust and reliable.
- Universal and Standardized Language: SQL is a standardized language with a consistent syntax across various database management systems. This universality means you can apply SQL across different platforms once you learn it. In contrast, Python's data manipulation requires specific libraries (like pandas), which might have different syntax and functionalities.
- Direct Database Operations: SQL is executed directly on the database server, enabling more direct and efficient manipulation and retrieval of data. This is particularly beneficial when working with very large databases where transferring data to a local machine for processing in Python would be impractical or too time-consuming.
- Less Overhead for Small to Medium Data Tasks: For small to medium-sized data analysis tasks, the overhead of setting up a Python environment, loading data into data frames, and then processing it can be more cumbersome compared to writing a few SQL queries. SQL can be a more direct and efficient choice for these tasks.
SQL Data Analysis Commands
A problem with SQL is that, though the language is standardized, as we said above, it isn’t quite as clear as Python. Python was designed to be easy to use. SQL is more difficult to grok, but definitely not impossible. And with just a few basic commands, you can start to chain together sophisticated SQL queries to interrogate your data. Here are a few core data analysis-related SQL commands to get you started.
1. JOIN
Joining tables is crucial when you need to combine data from multiple sources. SQL provides various types of joins, but the most commonly used are INNER JOIN, LEFT JOIN, and RIGHT JOIN.
Suppose you have two tables, Orders (with columns OrderID, CustomerID, and OrderDate) and Customers (with columns CustomerID, Name, and Location). To view the order details along with customer information, you would use:
SELECT Orders.OrderID, Customers.Name, Orders.OrderDate
FROM Orders
INNER JOIN Customers ON Orders.CustomerID = Customers.CustomerID;
Be mindful of the join type. An INNER JOIN returns only the records with matching keys in both tables, while LEFT JOIN and RIGHT JOIN can return all records from one table and matching records from the other.
2. GROUP BY with Aggregation Functions
Grouping data and using aggregate functions like SUM(), AVG(), MAX(), MIN(), etc., are essential for summarizing data. To find the total amount spent by each customer:
SELECT CustomerID, SUM(Amount)
FROM Orders
GROUP BY CustomerID;
Every column in the SELECT clause that is not an aggregate function must be included in the GROUP BY clause. Failing to do so can result in an error or misleading results.
3. Window functions
Window functions perform calculations across a set of table rows related to the current row. They are useful for running totals or moving averages. To calculate a running total of orders by date:
SELECT OrderDate,
       Amount,
       SUM(Amount) OVER (ORDER BY OrderDate) as RunningTotal
FROM Orders;
Window functions can be computationally intensive on large datasets. Also, the ORDER BY within the OVER clause is crucial for correct results.
4. CASE
The CASE statement is SQL's way of handling if/then logic. It’s very useful for categorizing data into custom groups. To categorize orders based on their amount:
SELECT OrderID,
       CASE
           WHEN Amount > 500 THEN 'Large'
           WHEN Amount BETWEEN 200 AND 500 THEN 'Medium'
           ELSE 'Small'
       END as OrderCategory
FROM Orders;
Ensure all possible outcomes are covered to avoid unexpected nulls. Also, the order of conditions is important as the CASE statement stops at the first true condition.
5. SUBQUERIES
Subqueries can be used to perform operations that require multiple steps, like filtering on an aggregate. To find customers who have spent more than the average:
SELECT CustomerID, SUM(Amount) as TotalSpent
FROM Orders
GROUP BY CustomerID
HAVING SUM(Amount) > (SELECT AVG(Amount) FROM Orders);
Subqueries can be slower, especially if the dataset is large. Also, readability can be an issue with nested subqueries.
6. COALESCE
The COALESCE function returns the first non-null value in a list. It's particularly useful in data analysis for handling missing or null values. Suppose you have a table Employees with columns EmployeeID, FirstName, LastName, and MiddleName (which may contain nulls). To create a full name column without nulls:
SELECT EmployeeID,
       COALESCE(FirstName, '') || ' ' || COALESCE(MiddleName, '') || ' ' || COALESCE(LastName, '') as FullName
FROM Employees;
Remember that COALESCE stops evaluating its arguments as soon as it hits the first non-null value.
7. CAST
The CAST function is used to convert one data type into another. This is essential when dealing with different types of data and ensuring compatibility between columns in operations. To convert a string date into a date data type:
SELECT CAST('2023-01-01' AS DATE) as NewDate;Be cautious about data loss or format issues when casting between incompatible types, like converting strings to integers.
8. DISTINCT
The DISTINCT keyword is used to return only distinct (unique) values in a SELECT statement. It’s particularly useful in identifying unique entries in a column. To find all unique customer locations in the Customers table:
SELECT DISTINCT Location
FROM Customers;
Using DISTINCT on multiple columns returns unique combinations of those columns, which can be misleading if not understood correctly.
9. LIMIT (or TOP in some SQL dialects)
LIMIT is used to constrain the number of rows returned by a query, which is especially useful for large datasets or when testing queries. To get only the first 10 orders:
SELECT * FROM Orders
LIMIT 10;
The rows returned are not necessarily in any specific order unless combined with an ORDER BY clause.
10. UNION and UNION ALL
These commands are used to combine the results of two or more SELECT statements into a single result set. To combine a list of all customer names and supplier names in two different tables, Customers and Suppliers:
SELECT Name FROM Customers
UNION
SELECT Name FROM Suppliers;
UNION removes duplicate records (only distinct values are selected), while UNION ALL will include duplicates. Also, the number and order of columns must be the same in all queries.
11. EXISTS
The EXISTS operator is used in a WHERE clause to check if a subquery returns any data. It's a great way to check for the presence of records in a subquery. To find customers who have placed an order:
SELECT * FROM Customers
WHERE EXISTS (SELECT 1 FROM Orders WHERE Orders.CustomerID = Customers.CustomerID);
Remember, EXISTS is used for its boolean result, and it stops processing as soon as it finds a match.
Each of these functions and queries plays a crucial role in different aspects of data analysis. Understanding when and how to use them effectively can greatly enhance your analytical skills and contribute to more efficient and insightful data exploration.
Exploratory Analysis With Only SQL
OK, now we have some foundation, let’s work through an entire example. No Python will be used in the making of this analysis. This is all SQL and Hex.
The setup here is that we’re performing an evaluation process for determining a new menu item for our up-and-coming Dumpling restaurant. We have a ton of data in our data warehouse on our current menu and sales, and want to use that to help us choose how to expand our offerings.
So, first we want to get all our data:
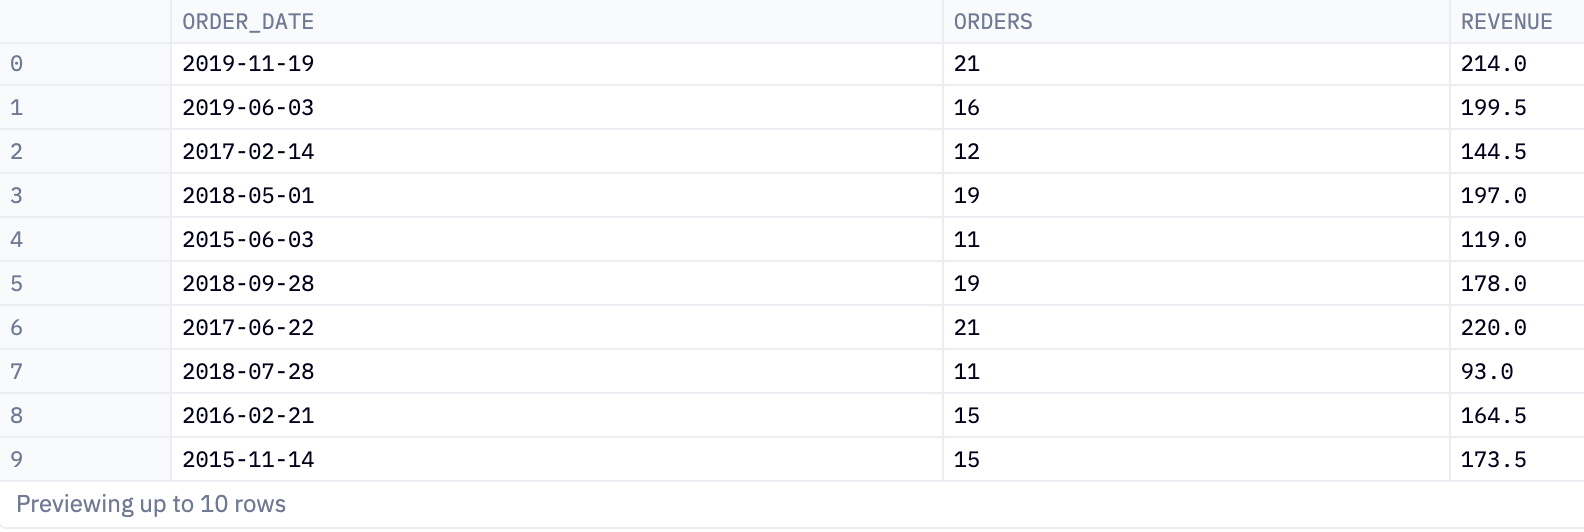
select order_date,
       count(*) as orders,
       sum(sales) as revenue
from prod.dim_orders
group by 1
This query retrieves and summarizes data from the table named dim_orders in a schema called prod. Here's a breakdown of the query:
- SELECT Clause
order_date: This selects theorder_datecolumn from thedim_orderstable. It means the output will include a column showing the dates on which orders were placed.
- Aggregate Functions
count(*) as orders: This counts the total number of rows (or orders) for eachorder_date. Thecount(*)function counts all rows, regardless of their content. The result is labeled asordersin the output.sum(sales) as revenue: This calculates the total sales for eachorder_date. Thesum(sales)function adds up the values in thesalescolumn. The result is labeled asrevenuein the output.
- FROM Clause
from prod.dim_orders: This specifies the table from which the data is retrieved. In this case, it's thedim_orderstable within theprodschema.
- GROUP BY Clause
group by 1: This groups the results by the first column in the SELECT clause, which isorder_date. Grouping byorder_datemeans that the count and sum operations are performed for each unique date in theorder_datecolumn.
This produces three columns, order_date, orders, and revenue. For each unique date in the dim_orders table, we get the total number of orders placed and the total revenue generated from those orders.
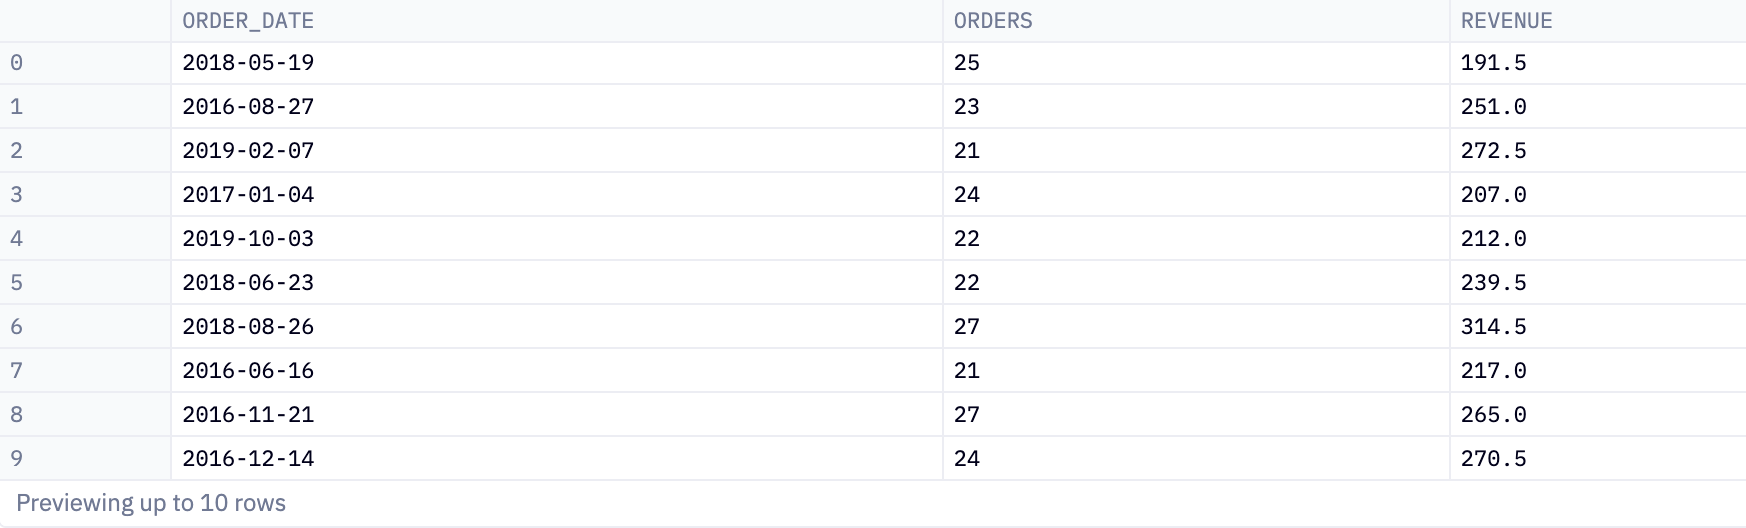
The next query uses this data along with the WHERE clause,where orders > 20. This is a conditional clause that filters the data. It tells the SQL engine to only include rows where the value in the orders column is greater than 20. Essentially, this filters out any records where the number of orders is 20 or less.
select * from dataframe_6 where orders > 20So we end up with a new dataframe where orders is greater than 20:
Next up, we’re going to plot some of this data. This would usually be a “gotcha” in SQL-only analysis, as SQL has no graphing capabilities. But when you use SQL in Hex notebooks, you can take advantage of Hex built-in charts. Here, we’re going to plot the orders and revenue over time:
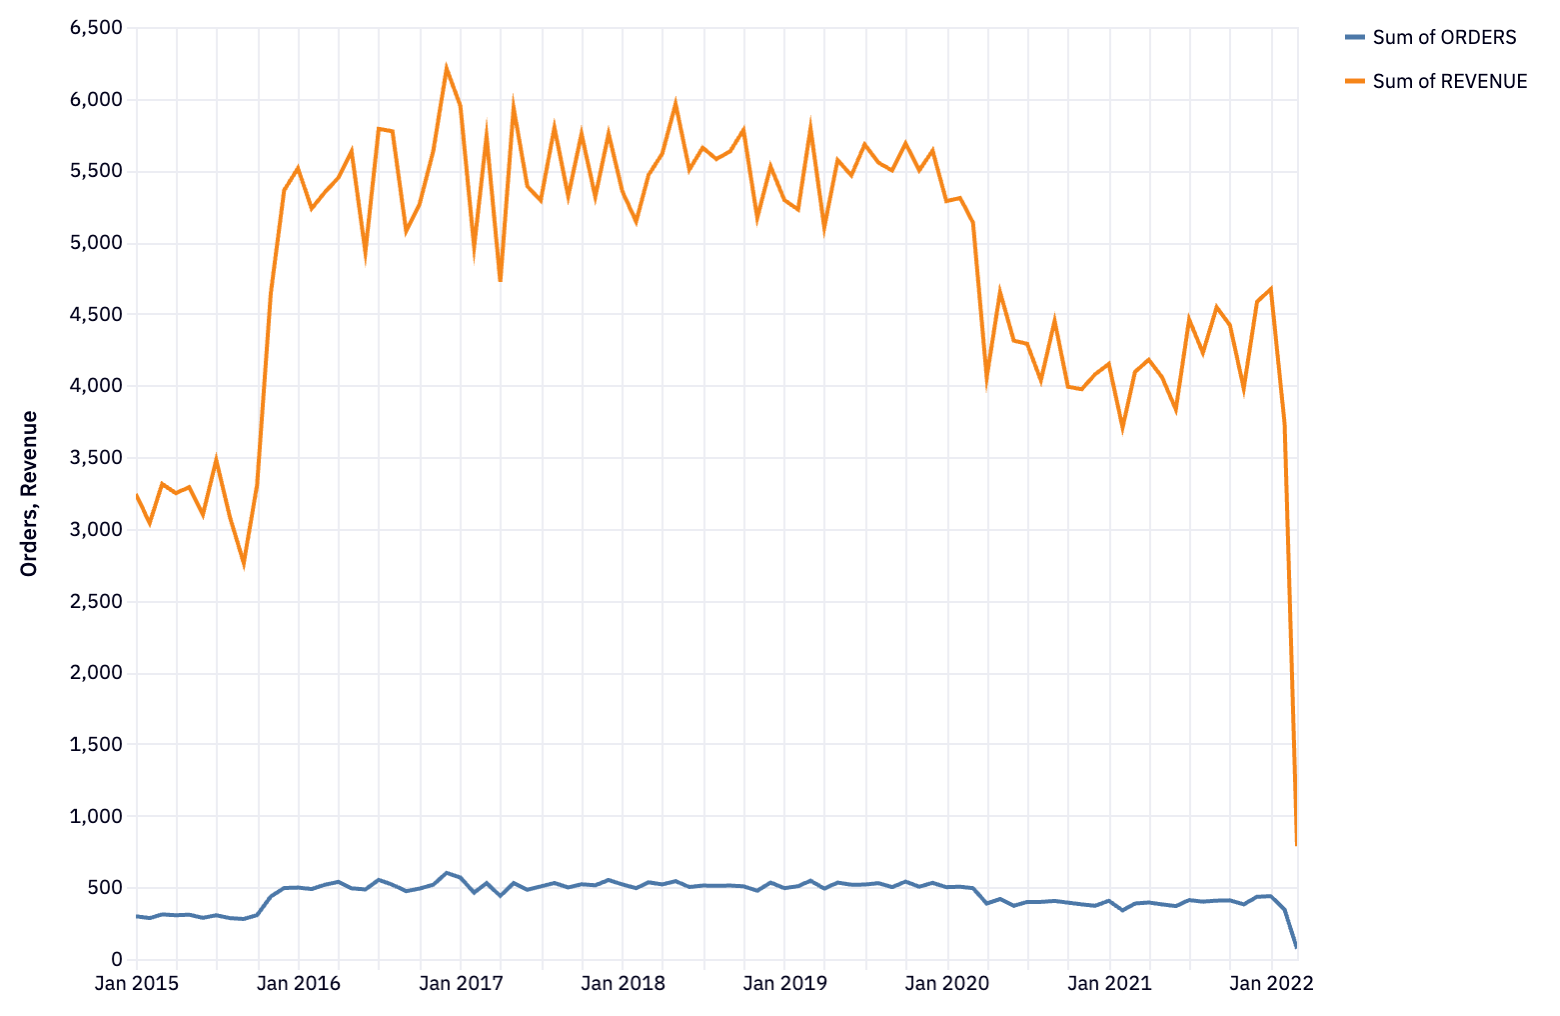
Orders and revenue decreased sharply since the beginning of the COVID-19 pandemic in March 2020. However, the business has held more or less stable at this reduced level, and has begun to rise back towards pre-pandemic sales. This is the type of insight you wouldn’t get from just the raw tabulated numbers—visualization is critical to exploratory analysis.
Let’s now go back to the database and pull some more data:
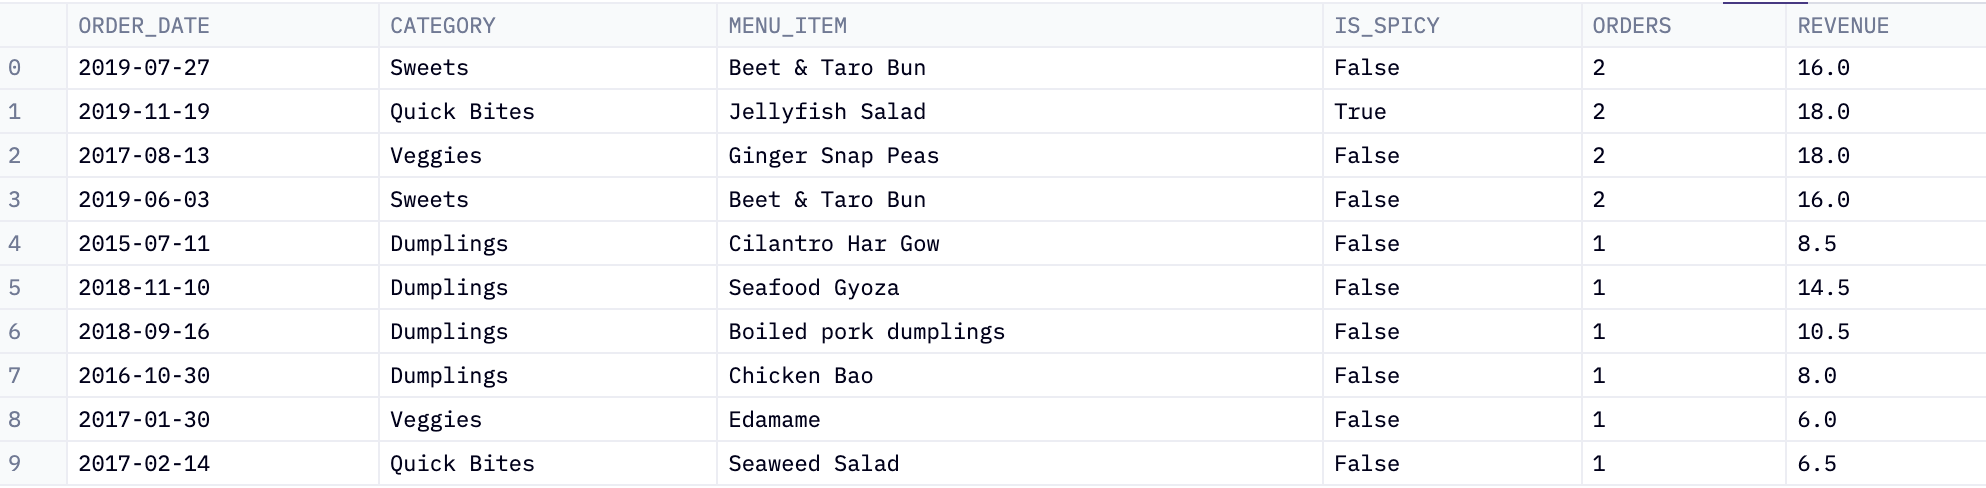
select order_date,
       category,
       menu_item,
       is_spicy,
       count(*) as orders,
       sum(price) as revenue
from prod.order_details
group by 1,
         2,
         3,
         4
This query generates a report that includes the order date, category, menu item, spicy status, total number of orders, and total revenue for each unique combination of those four criteria.
Here's a breakdown:
- SELECT Clause
order_date: This selects theorder_datecolumn from theorder_detailstable, showing the dates of orders.category: This selects thecategorycolumn, indicating the category of the menu item.menu_item: This selects themenu_itemcolumn, showing the specific item ordered.is_spicy: This selects theis_spicycolumn, which indicates whether the menu item is spicy (true/false).count(*) as orders: This counts the total number of rows (or orders) for each unique combination oforder_date,category,menu_item, andis_spicy. The result is labeled asorders.sum(price) as revenue: This calculates the total revenue (sum of thepricecolumn) for each unique combination oforder_date,category,menu_item, andis_spicy. The result is labeled asrevenue.
- FROM Clause
from prod.order_details: Specifies theorder_detailstable from theprodschema as the source of the data.
- GROUP BY Clause
group by 1, 2, 3, 4: This groups the results by the first four columns in the SELECT clause (order_date,category,menu_item,is_spicy). The numbers (1, 2, 3, 4) are shorthand for the column positions in the SELECT list. Grouping by these columns means that the count and sum operations are performed for each unique combination of these four columns.
We now have this table:
Next, we can use chained SQL, where you perform our query against the output of the previous query (here, orders and revenue), without needing to use common table expressions (CTEs) or subqueries.
SELECT category, sum(orders) as orders, sum(revenue) as revenue
FROM order_details
GROUP BY 1
ORDER BY 2 desc
This produces a table with three columns: category, orders, and revenue. It shows the total number of orders and total revenue for each category, with the categories sorted from the highest to the lowest number of orders:
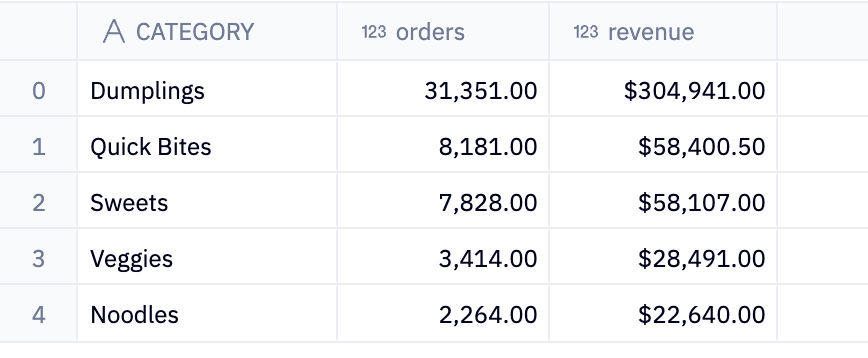
Now we have some very usable data. Unsurprisingly for our dumpling shop, dumplings are the most-ordered and most valuable category of food on the menu. More dumplings might be a good thing.
Let’s dive into that a little more:
SELECT menu_item,
COUNT(*) as orders,
sum(revenue) as revenue
FROM order_details
WHERE category = 'Dumplings'
GROUP BY 1
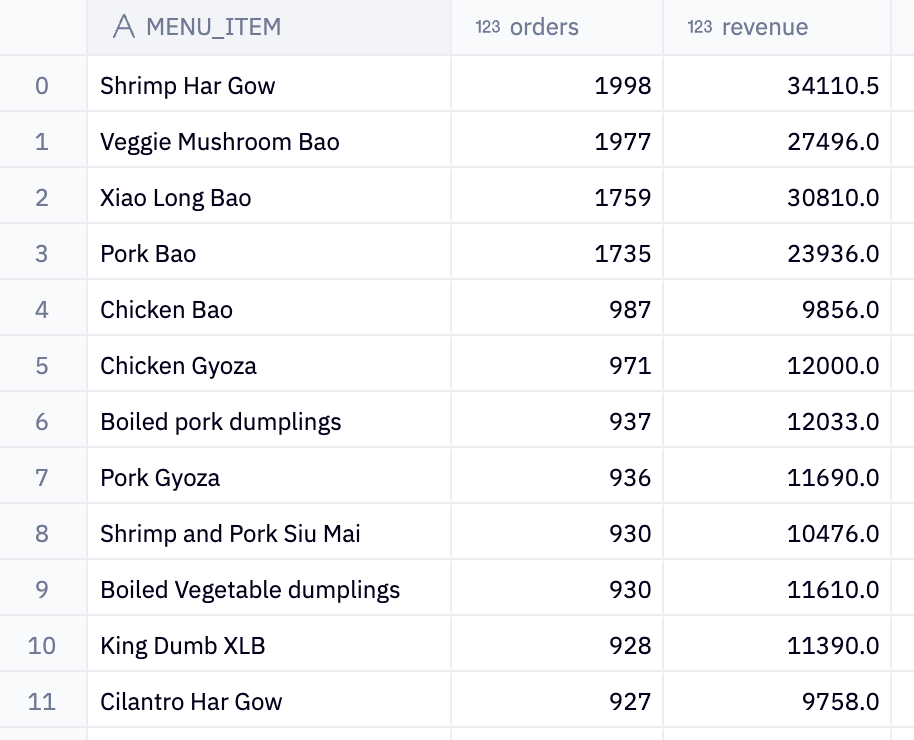
ORDER BY 2 DESCThis SQL code again uses chained SQL against the order details above, this time specifically focusing on items in the 'Dumplings' category. It uses the WHERE category = 'Dumplings' to filter data to only those rows where the category column has the value 'Dumplings'. It means that the query will only consider menu items classified under the 'Dumplings' category.
It shows the total number of orders and total revenue for each dumpling menu item, with the items sorted from the highest to the lowest number of orders. We can then see that Shrimp Har Gow, Veggie Mushroom Bao, Xiao Long Bao, Pork Bao, and Chicken Bao are the top 5 dumplings in the store by orders:
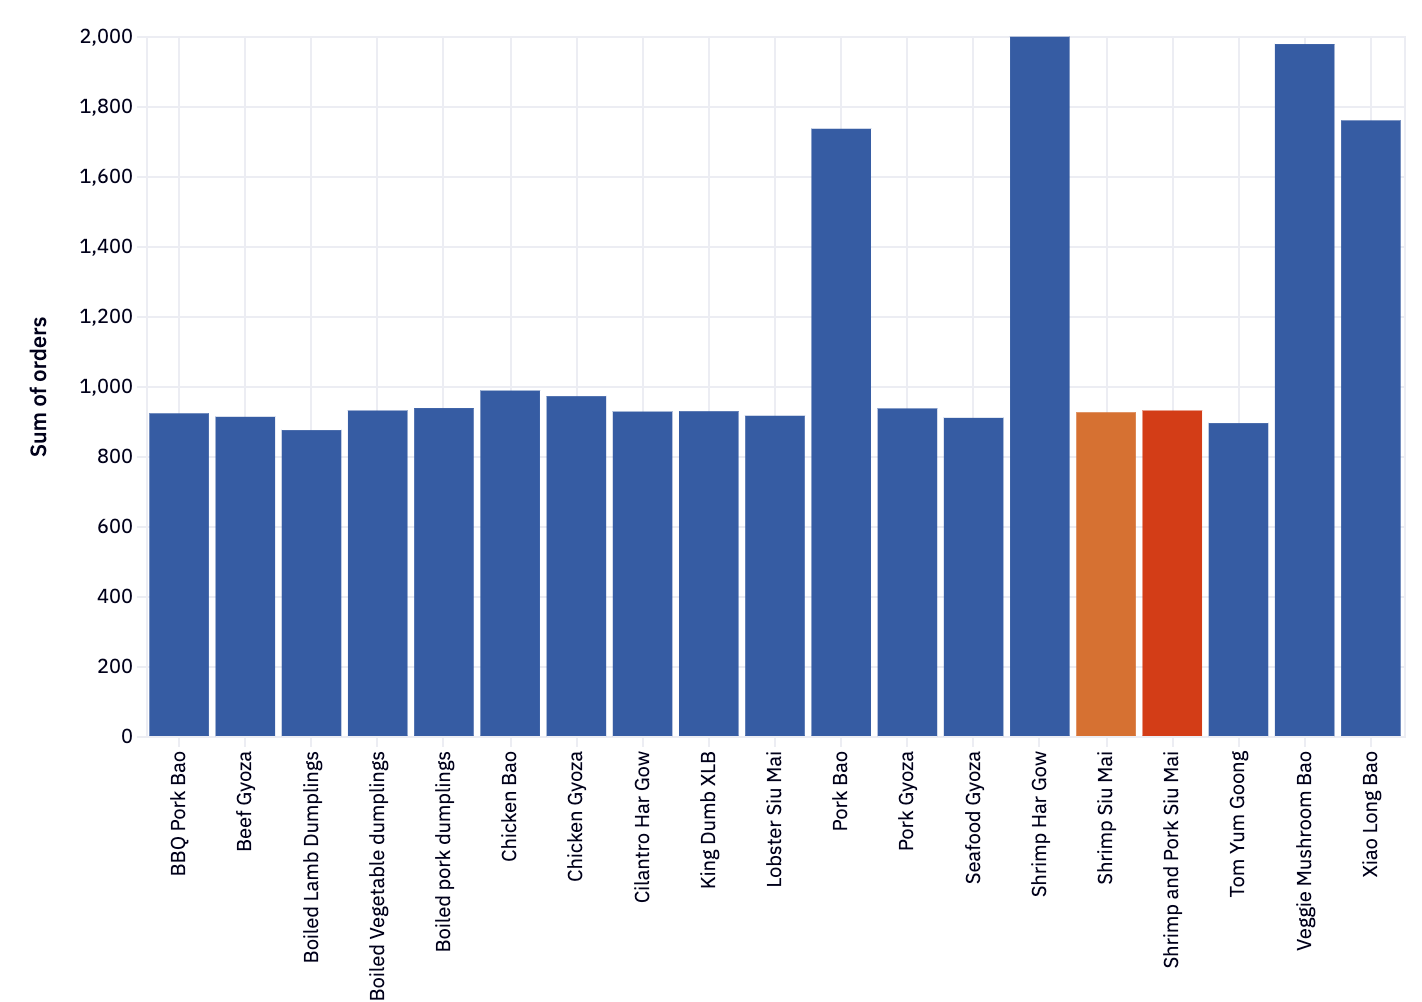
We can then also plot the revenue and orders from each of our dumplings to better understand which are performing well:
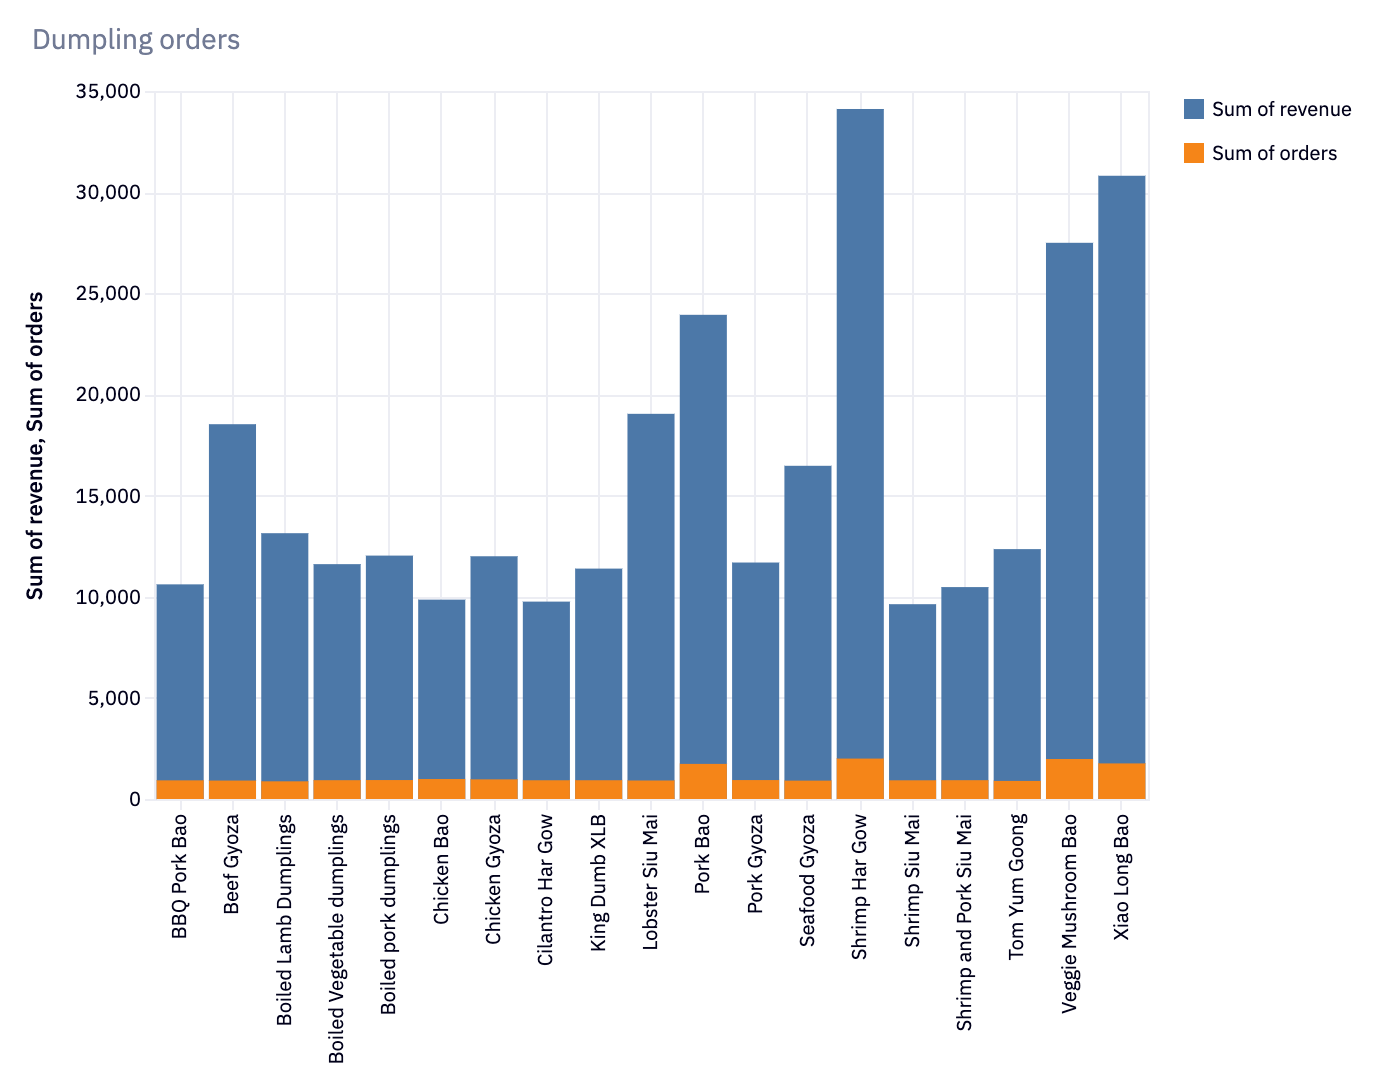
So far, our data shows that Bao’s are doing well, but we don’t have any concrete takeaways beyond that. Let’s hypothesize that it isn’t an ingredient, but a trait of the dumplings that help them sell well—spiciness:
SELECT is_spicy, count(*) as orders
FROM order_details
WHERE category = 'Dumplings'
GROUP BY 1
This code again retrieves and summarizes data about dumplings, but there also collates the data on spiciness, using count(*) as ordersto count the total number of rows (or orders) for each value in the is_spicy column within the specified category.
This will produce a tale with two columns: is_spicy and orders. It shows the total number of orders for each category of spiciness (spicy or not spicy) within the 'Dumplings' category. This is useful for analyzing how the spiciness of dumplings affects order volume and can help us understand if spicy dumplings are more popular than non-spicy ones.
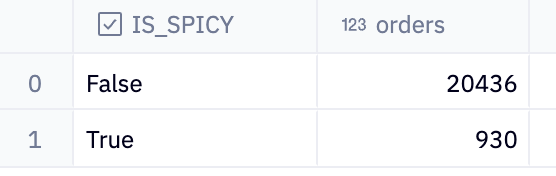
Hmm, OK, not may spicy orders. But is that because the customers don’t like spice, or because of a feature of the data?
SELECT menu_item, count(*) as orders
FROM prod.order_details
WHERE is_spicy = TRUE
GROUP BY 1
Here, we get all our order dataWHERE is_spicy = TRUEto filter the data to include only those rows where the is_spicy column has a value of TRUEand focus exclusively on spicy menu items.
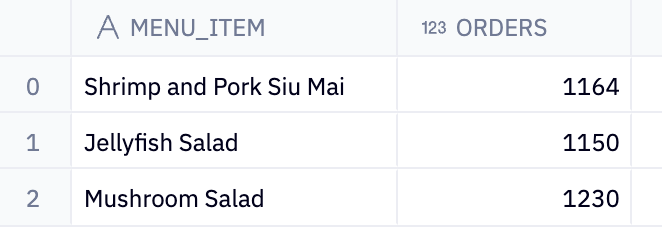
OK, only one dumpling is spicy, and the Siu Mai aren’t especially popular:
But as we see, it’s all about the Baos. Maybe Spicy Bao should be on the menu in 2024?
Here, we’ve seen the power of SQL, especially when teamed up with Hex. The downsides of SQL for data analysis tend to be the lack of visualization, and the need to construct convoluted nested subqueries to extract just the data you want. With Hex, you can pipe SQL data directly into the built-in visualizations, and used chained SQL to easily build simple SQL queries and layer your data analysis. Who needs Python, eh?
See what else Hex can do
Discover how other data scientists and analysts use Hex for everything from dashboards to deep dives.


"Hex has the best parts of using a Jupyter notebook without the limitations. I hadn’t really experienced being able to slip really quickly between the logic and the application builder view before Hex."
Nina Anderson
Head of Pre-Sales Engineering
Ready to get started?
You can use Hex in two ways: our centrally-hosted Hex Cloud stack, or a private single-tenant VPC.