Blog
Self-service analytics 101: What it is, why it matters, and how to get it right
How self-serve analytics works + tips for success


Self-service analytics sounds simple: give people access to data, let them explore, and voila, data-driven decisions all around. But in practice? It’s often more chaos than clarity.
At Hex, we believe self-service can work, but only when it’s grounded in good governance, shared context, and a platform that’s flexible enough for everyone, from SQL-savvy data scientists to business users who just want to filter a chart.
This guide covers what self-service analytics is, how it works, and what it looks like when it’s done well. (Spoiler: it’s not about replacing your data team. It’s about freeing them up to focus on what matters most.)
What exactly is self-service analytics, anyway?
Self-service analytics is about giving people access to explore and visualize data without submitting a ticket or waiting for the data team. Think fewer bottlenecks, more curiosity.
It doesn’t mean everyone becomes a data analyst overnight or needs to learn complex SQL queries. It just means they can access curated dashboards, drill down into metrics, and explore datasets confidently on their own timeline.
When done right, it fosters a data-driven culture where exploration is encouraged and metrics don’t live behind closed doors.
How does self-service analytics work?
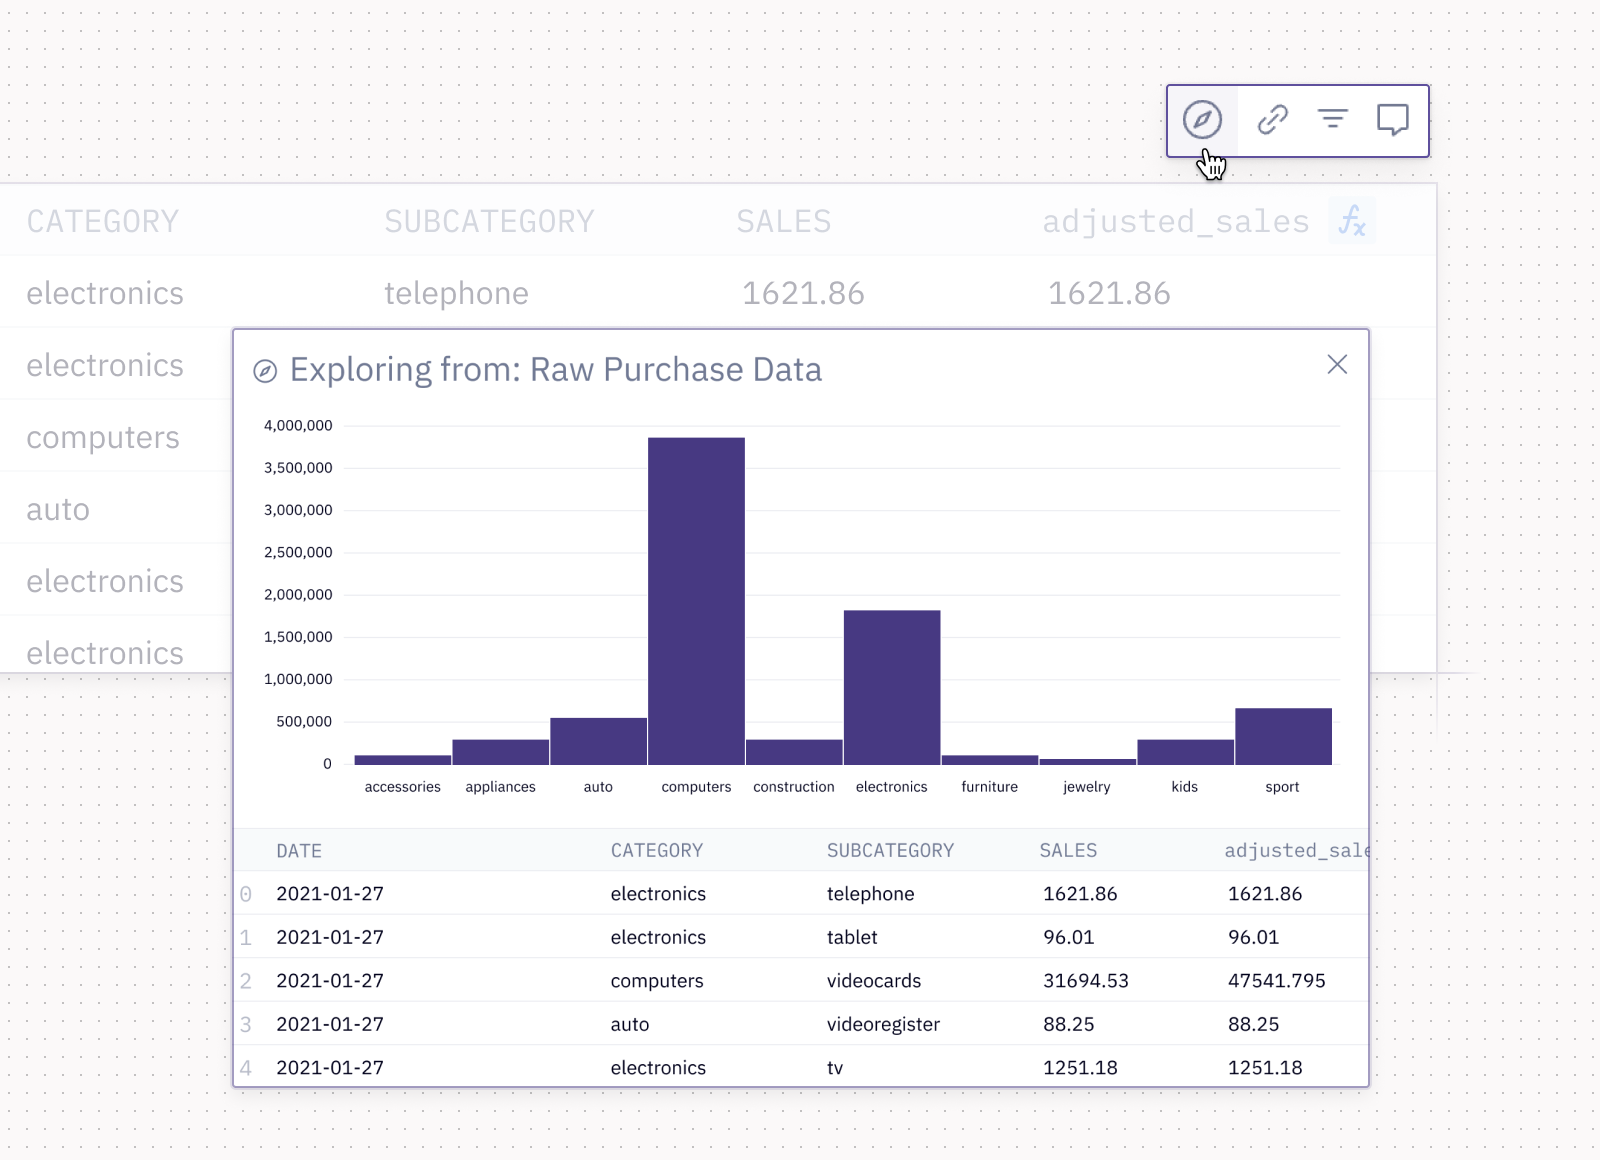
It starts with a self-service analytics platform that’s actually built for everyone, not just BI pros. The best tools support both code-first workflows (hello, SQL and Python) and user-friendly interfaces (sliders, dropdowns, templates) that guide non-technical users through data analysis.
In Hex, for example, you can build an app once and set your team loose to extract from it what they need, how they need it. Business users can update inputs, tweak filters, build visualizations, and explore data in real time without needing help from IT teams. Meanwhile, data scientists get to work on more predictive and exploratory tasks — not formatting another spreadsheet. If business users know SQL or Python — or most of it, and want to use AI to fill in the gaps, they can do that too!
Why teams love self-service analytics
When data access isn’t locked behind a backlog, good things happen:
- Faster decision-making: Business users can explore datasets and KPIs in real time, without interrupting analysts.
- Healthier data literacy: Teams become more confident using graphs, dashboards, and visualizations in their workflows.
- Better use of resources: Data teams spend less time fielding ad hoc requests and more time on data modeling, automation, and machine learning.
- A more empowered org: From sales to product to marketing, everyone has the tools to make smarter, data-backed decisions.
- Improved data integration and accessibility: Connected systems and shared templates mean teams can explore the same trusted source of truth — without getting lost in silos.
The real magic happens when a platform streamlines this experience without sacrificing data security, governance, or data quality.
What self-service analytics looks like in the real world
So what does all of this look like in the wild? Let’s look at a few teams that made it real.
These teams didn’t just adopt self-service. They leveled up their entire data culture.
How ClickUp saved over $1 million with a self-serve churn model
ClickUp’s success and marketing teams were sitting on powerful churn predictions, but the model was too high-level to act on. The data team was inundated with endless one-off requests.
With Hex, ClickUp turned that predictive model into a self-service app. Business users could build custom segments, drill down into customer behavior, and prioritize outreach, all within a friendly UI.
The payoff? Over $1 million in churn reduction, fewer dashboard pings, and a scalable approach to decision-making that stuck.
ClickUp’s marketing and success teams used the app to filter users by engagement level, segment accounts by plan type, and identify high-risk customers with declining usage. That meant CX teams could prioritize outreach based on churn likelihood, and marketers could A/B test win-back campaigns, all without opening a SQL editor or pinging the data team.
How Calendly doubled its data team’s impact
Calendly’s go-to-market analytics team was moving fast but constantly context-switching between dashboards, requests, and infrastructure work.
By leaning into self-service analytics tools in Hex, it created a centralized analytics solution: shared apps, in-line comments, AI-assisted prompts, and real-time data visualizations. The cherry on top was a dedicated Slack channel that surfaced insights and made it easier to tell the data story.
Sales and marketing teams used Hex apps to pull weekly performance metrics, dig into campaign attribution, and track top-performing segments, without waiting in line. Executives used shared links to access focused, presentation-ready views without needing to scroll through endless tabs.
The cherry on top? A dedicated Slack channel that surfaced insights and made it easier to tell the data story across the org.
It was a win-win: fewer pings for the data team and faster answers for everyone else.
How Notion built a culture of self-service across technical levels
Notion wanted to democratize data without creating chaos. In our "Friends of Data" session, Daniel Sternberg, head of data at Notion, shared how the company integrates data into its decision-making process while maintaining a strong sense of product craft. Notion's data team operates in a centralized structure, supporting multiple functions across data platform, data science, data engineering, and business intelligence.
Sternberg emphasized that while data informs decisions, it's not the sole driver. For instance, when evaluating product features, the team considers both quantitative signals and qualitative feedback to ensure product changes reflect real user needs, not just numbers on a dashboard.
One example? The team rethought how Notion's paywall triggered. Initially, users were prompted to pay when they added a second person to their workspace, but this unintentionally discouraged collaboration. By analyzing user behavior, they shifted the paywall to trigger based on content creation instead, leading to a noticeable boost in user engagement.
It's a model of balance: data as a strategic partner to design, not a replacement for thoughtful decision-making.
Watch out for these common self-service analytics pitfalls
Even the best platforms can’t fix bad practices. Here’s what to watch out for:
- Poor connection to your data sources: If your dashboards aren’t powered by real-time data from trusted sources like your data warehouse, CRM, or product telemetry, your insights will lag behind reality.
- Missing or inconsistent data models: Your metrics need to match across teams, tools, and use cases. Reusable data models prevent misalignment and help maintain trust.
- Defaulting to BI tools that weren’t built for exploration: Traditional BI tools often hit a wall when users need to go beyond prebuilt dashboards. Self-service business intelligence works best with platforms designed for exploration, not just reporting.
- No plan for data governance: Without clear ownership, access controls, and publishing standards, self-service turns into a Wild West of duplicate datasets and half-baked dashboards. Tools like Hex’s Magic AI can help by flagging inconsistencies and guiding users toward cleaner, more trustworthy data.
- Skipping documentation and data lineage: If a user can’t trace a metric to its source, they won’t trust it. Add documentation and lineage tracking to every data app or visualization.
- No support for advanced workflows: Self-service should empower everyone, from non-technical users to data scientists. That means supporting complex workflows, machine learning, and automation, all within a unified platform.
For more on this, check out our deep dive into how Human Interest approached self-service and what it means to focus your data team on what matters most.
Five best practices to make self-service analytics work
Want your self-service analytics setup to thrive now and scale with your organization? Start with these foundational practices — plus a few words of wisdom from data leaders who’ve been there:
Tip #1: Start with a strong foundation
Self-service only works when the data behind it is reliable. That means building clean, reusable data models, integrating trusted data sources, and centralizing access in a platform that supports both technical and non-technical users.
Tip #2: Communicate like a product marketer
Tony Avino from HubSpot put it best: Treat your internal data assets like product launches. That means considering user experience, creating clear documentation, and promoting new tools internally (so people actually know they exist). A great dashboard that no one uses doesn’t drive any decisions.
Tip #3: Build in governance early
Waiting to implement data governance is like building a house without a blueprint. From the start, define who owns each dataset or app, what standards should be followed, and how updates will be managed.
Tip #4: Encourage feedback loops
Self-service doesn’t mean "set it and forget it." The best teams make space for iteration — collecting feedback through Slack, inline comments, or shared docs. When business users feel heard, they’re more likely to engage, and you get better tools as a result.
Tip #5: Measure what matters
Don’t just count logins or views. Consider how self-service is affecting actual workflows: Are teams making faster decisions? Has the volume of repetitive requests to the data team gone down? Are business users confidently using the same KPIs? Measuring real impact helps you improve and justify your analytics investments.
As Daniel Sternberg from Notion puts it, real ROI shows up when teams are actually working smarter, not just logging in.
(Bonus) Tip #6: Don’t overlook the role of automation and AI
Intentional implementation of features like Hex’s Magic AI can help streamline analysis, reduce repetitive tasks, and surface insights faster without compromising the rigor of your workflows.
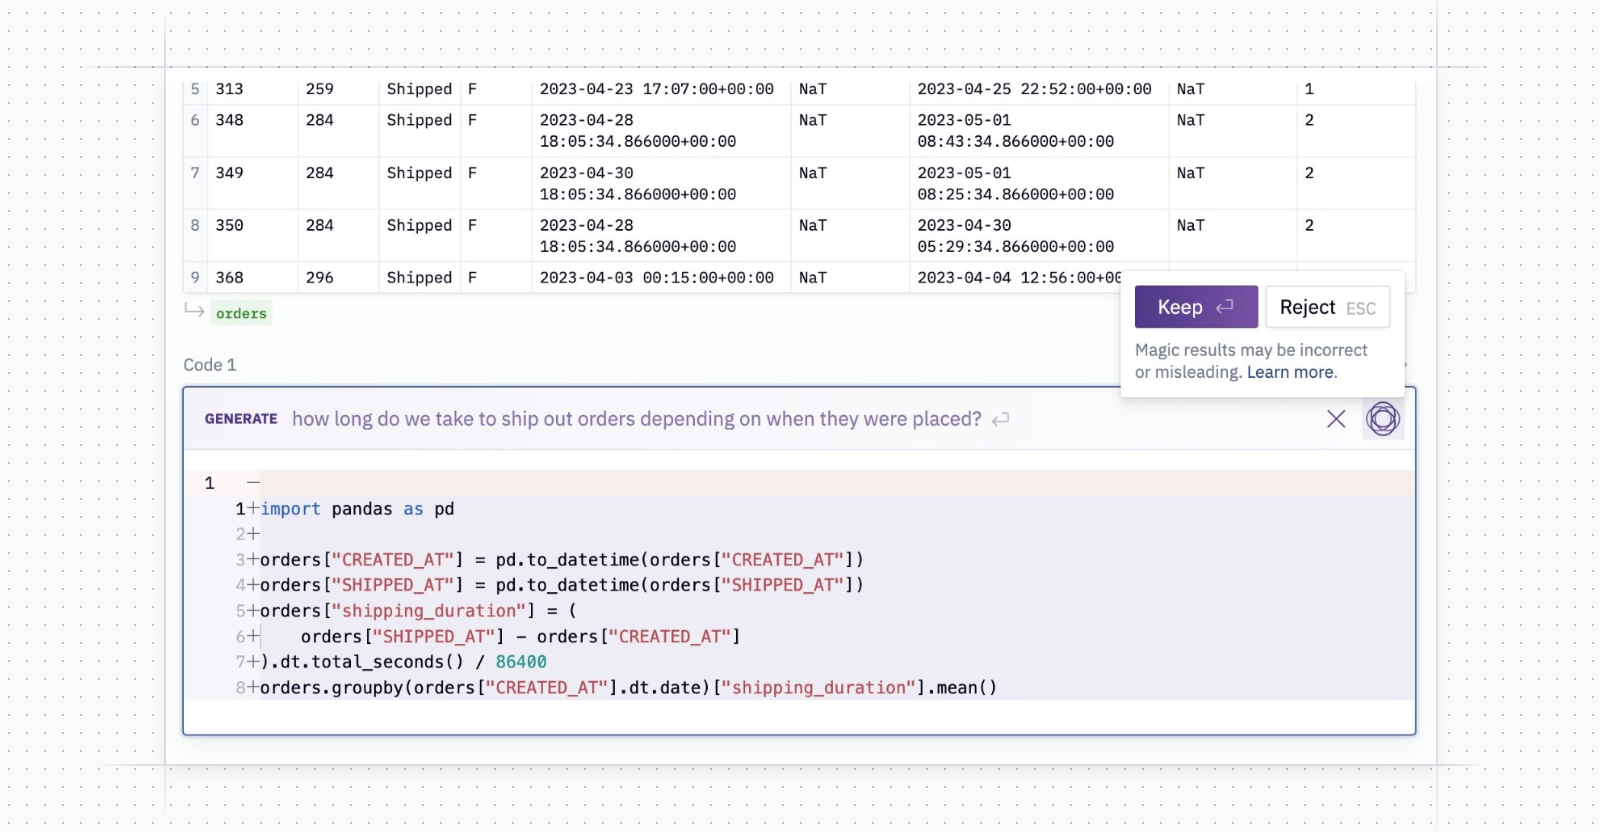
When used well, it enhances human judgment rather than replaces it, keeping data teams energized to solve higher-impact problems.
For example, Magic AI can auto-suggest relevant queries, flag anomalies in real time, or surface contextual insights that would otherwise take hours to uncover. It’s not about handing over control to a black box — it’s about using AI to reduce repetitive work and spark deeper data exploration.
Level up your self-service setup with Hex
At the end of the day, self-service data analytics isn’t just about speed. It’s about making analytics part of everyone's daily workflow.
And self-service doesn’t mean going it alone. With the right analytics solution — one that’s flexible, well-governed, and user-friendly — you can build a culture of data access without compromising on trust or scalability.
Business users can answer their own questions, and your data teams can focus on strategy, modeling, and proactive insight generation. Stakeholders feel empowered, not sidelined. Decision-making finally moves at the speed of work.
Want more tips on how to launch self-service the right way? Check out HubSpot’s full guide and Tony Avino’s Friends of Data talk for practical advice on launching data assets like a product.
If you're still debating the value of self-service, read why the best ROI might come from empowering your stakeholders — and see how it changes the game. Then, download our guide to data apps to explore how you can streamline data analysis and empower your end users while giving your data team the space to do their best work.
If this is is interesting, click below to get started, or to check out opportunities to join our team.