Blog
Exploring Data in Jupyter with Python and Pandas
A detailed guide to data exploration in Jupyter with Python and Pandas.

In this article, you will see a detailed guide to data exploration in Jupyter with Python. For this article, we will use the most popular Titanic Survivor dataset. Make sure to download this dataset to follow along.
Jupyter is an open-source interactive development environment that allows developers to write interactive code chunks to easily analyze and visualize their data. You don’t need to write all the code and run it as a Python file. Instead, you write small code chunks that individually read data, display data, or visualize a single plot, and then run them instantly. It comprises of different interactive components called cells where you can write code or markdown and load data to make the code more explainable and shareable.
While Jupyter is the interface that helps you write interactive code, Python is the computational engine underneath. In particular for data analysis, the feature-rich library Pandas provides functions for reading, analyzing, manipulating, exploring, and cleaning datasets. It mainly aims to handle “relational” or “labeled” data with the help of its two data structures: DataFrames and Series. With Pandas, you can load and store data in CSV, Excel, JSON, or MySQL easily.
Let’s set up a Jupyter Notebook. Here, we’re using MacOS, but the Jupyter-Python-Pandas triumvirate will work on any OS. This tutorial assumes you are using Python>=3.8 with either the direct installation or with Anaconda distribution. For installing any Python libraries, you can either use PIP or Conda environment.
Installation and Creating Jupyter Notebooks
Let’s start with installing Jupyter. This comes in two flavors, Jupyter Lab and Jupyter Notebook.
Both of these have almost the same features but with slight differences in the UI. If you already have Anaconda installed then you already have both Jupyter Notebook and Jupyter Lab. If not, you can use your terminal/command prompt and download them using the package manager (PIP) with the following commands:
# to install jupyter notebook
pip install notebook

# to install jupyter lab
pip install jupyterlab
Note: For this article we will use Jupyter Notebook for development.
Once the installation is done, you can open the Jupyter Notebook with the following command:
$ jupyter notebook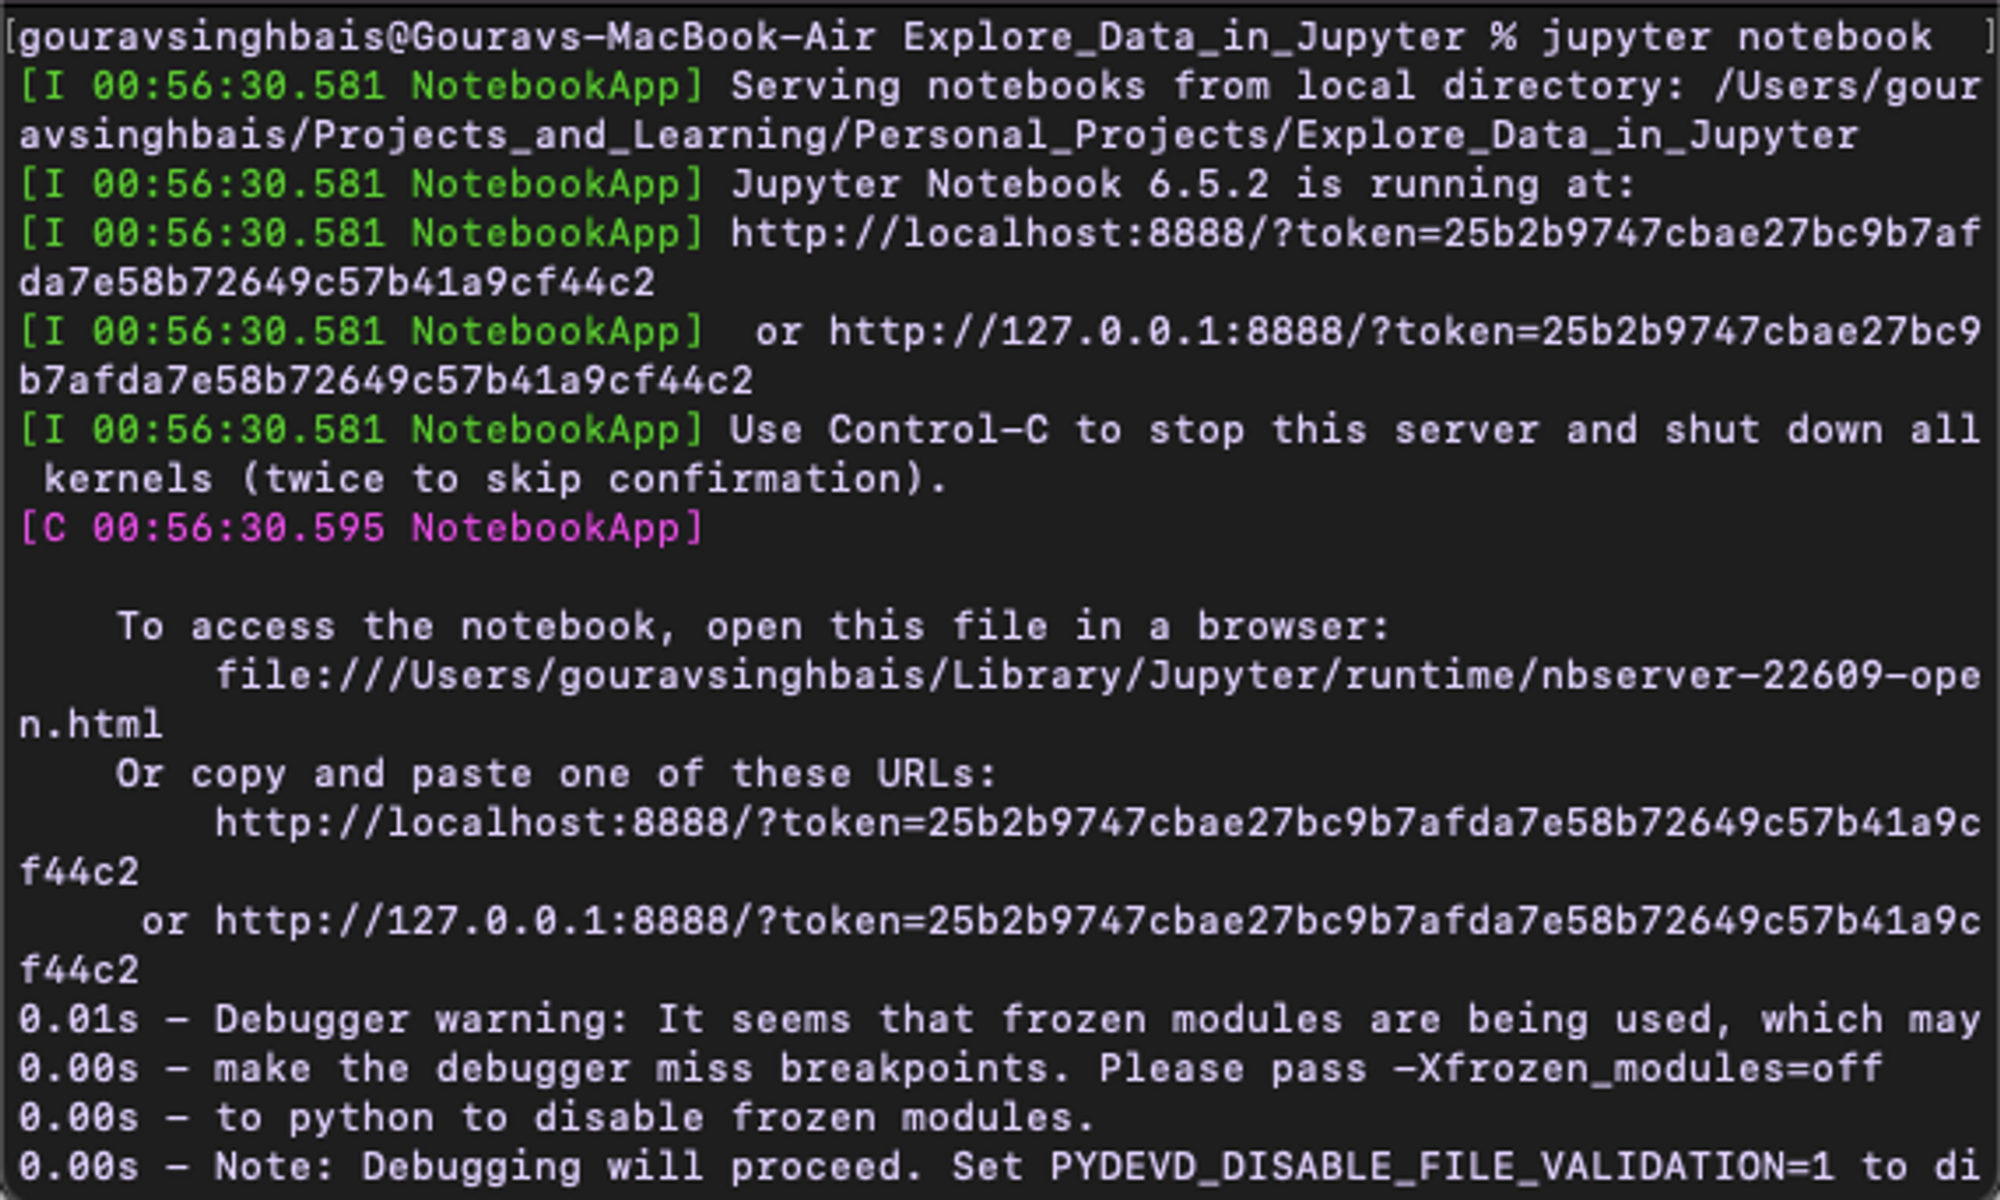
Open Jupyter Notebook
If you want to start the Jupyter Notebook in a specific folder, you need to traverse to that location through the terminal and start it there. As soon as this command runs, an instance of Jupyter Notebook will start in your default browser:
Jupyter Notebook
Note: If not open in your default browser automatically, you can copy the link from the terminal and open it in your desired browser.
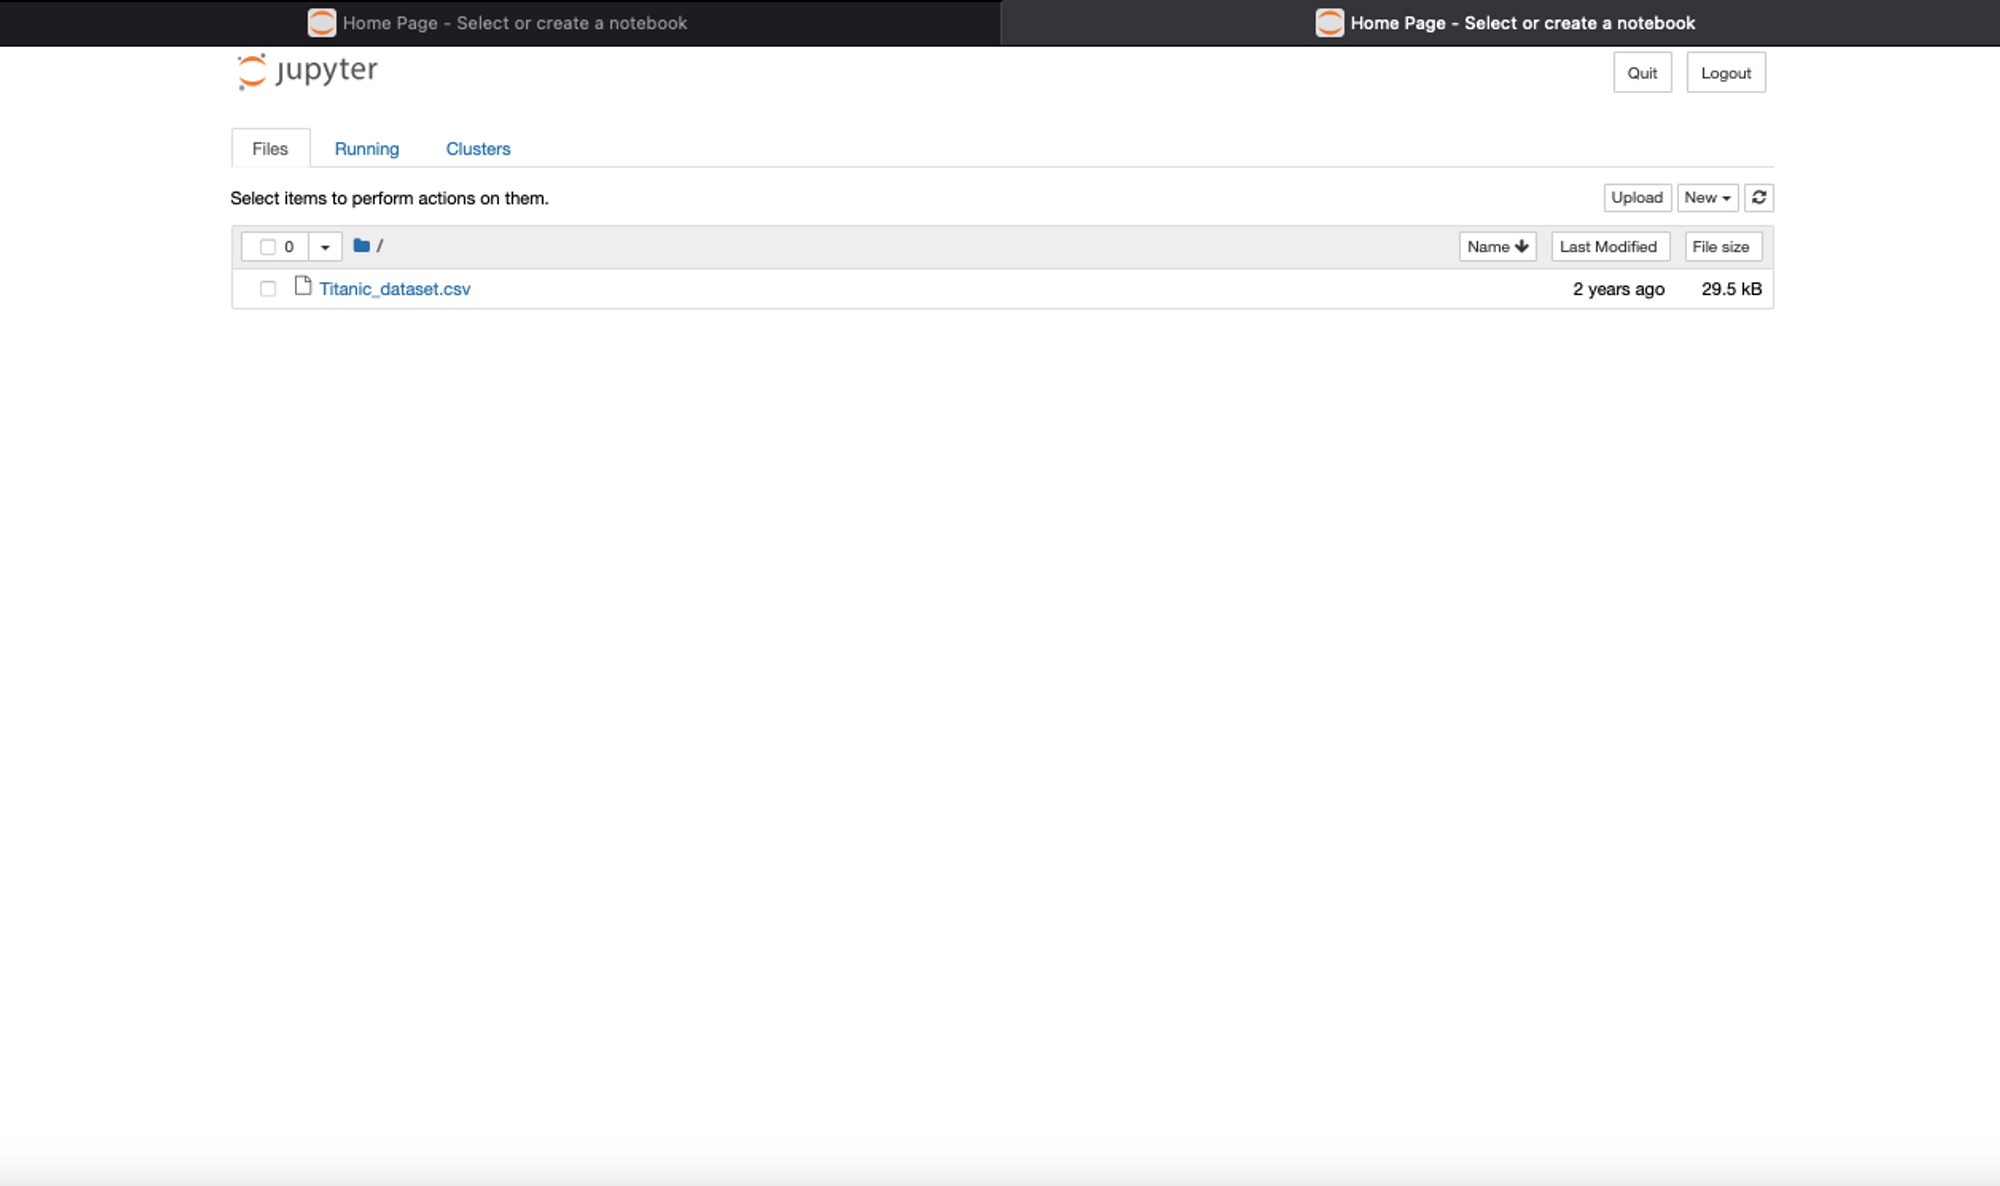
As you can see, I already have the Titanic dataset installed in this folder location where I started the notebook server.
To open a new notebook, click on the New button on the right-hand side which will show you different options, Select the first one mentioning ipykernal which is the kernel for running Python code inside Jupyter Notebooks.
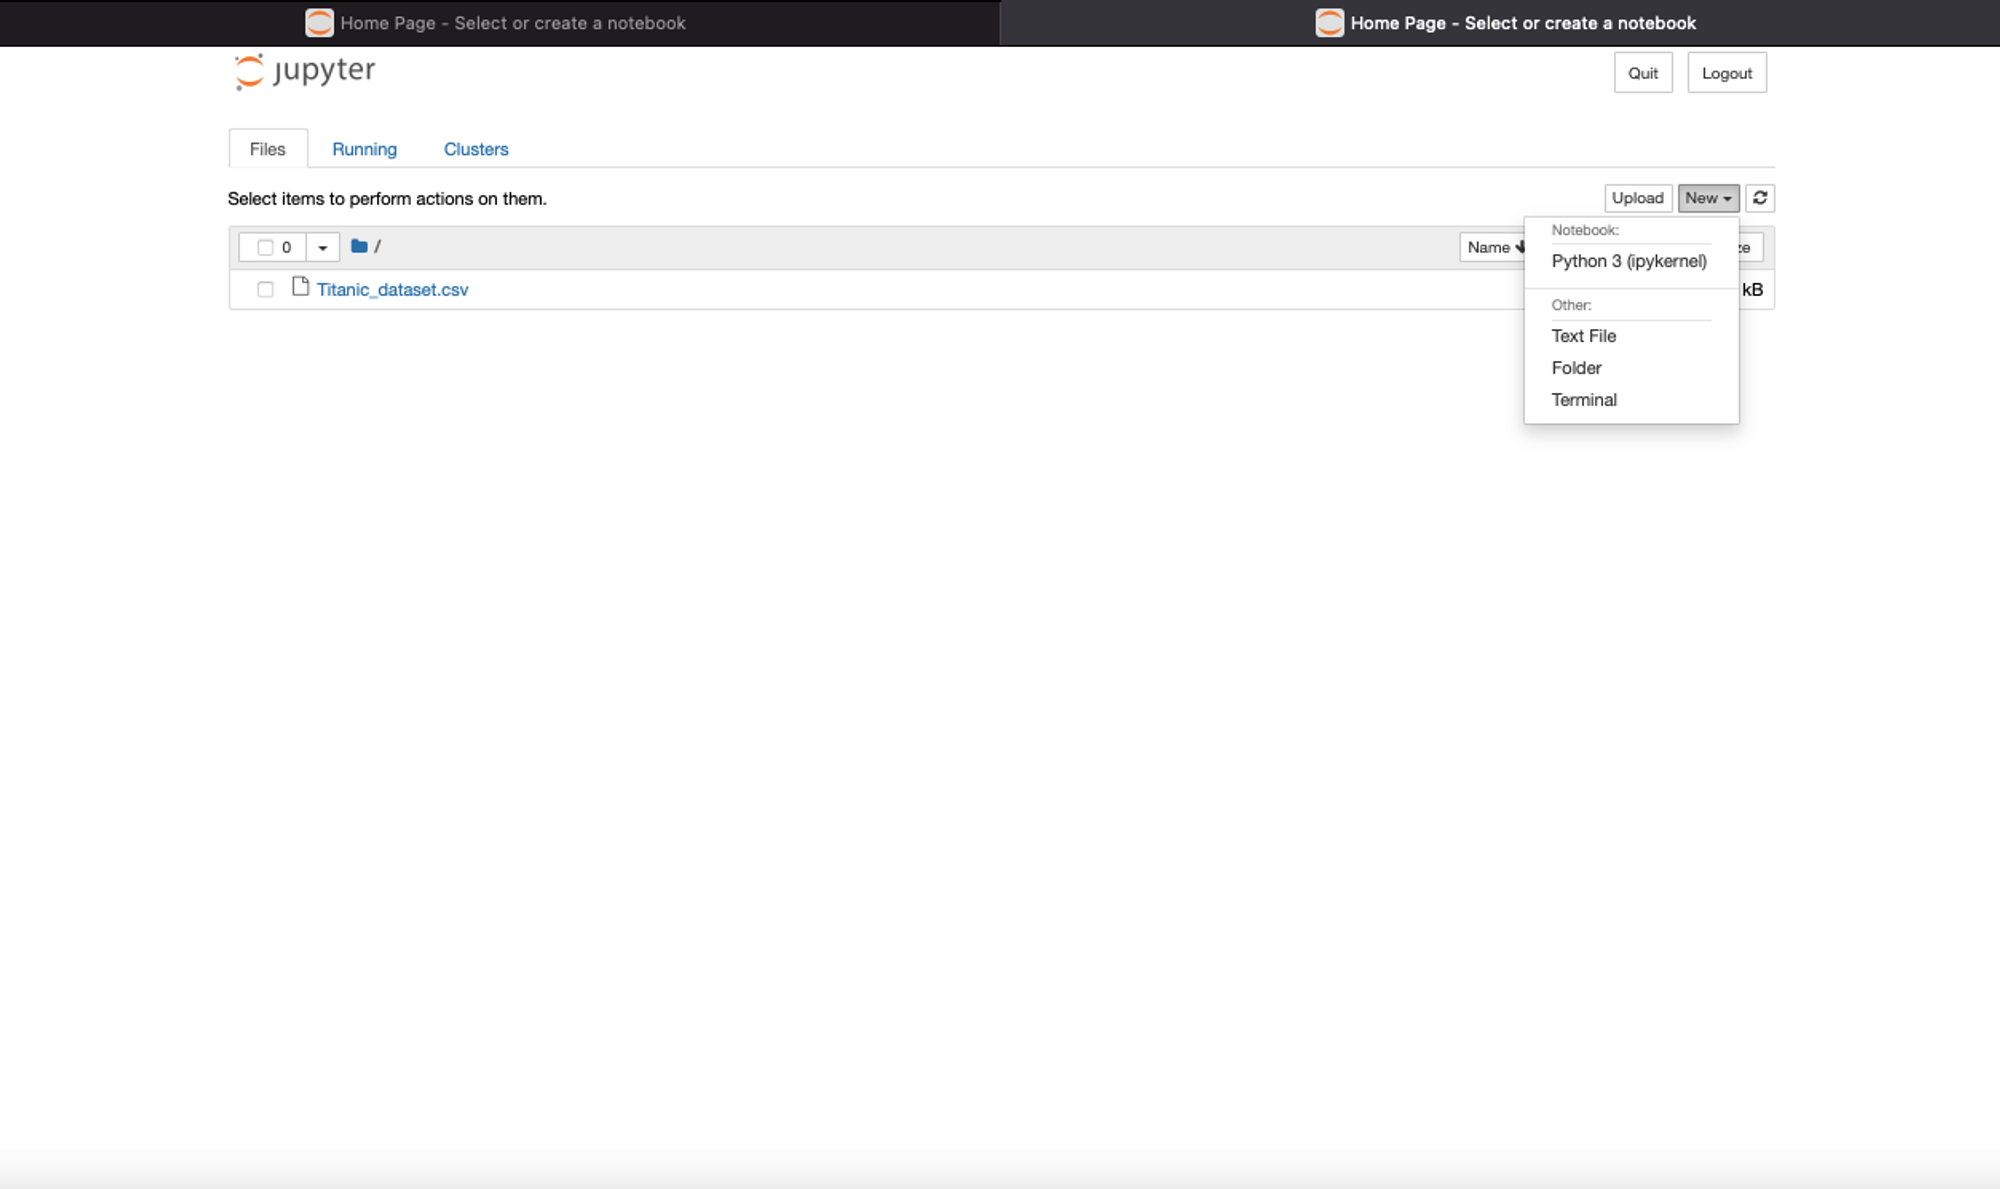
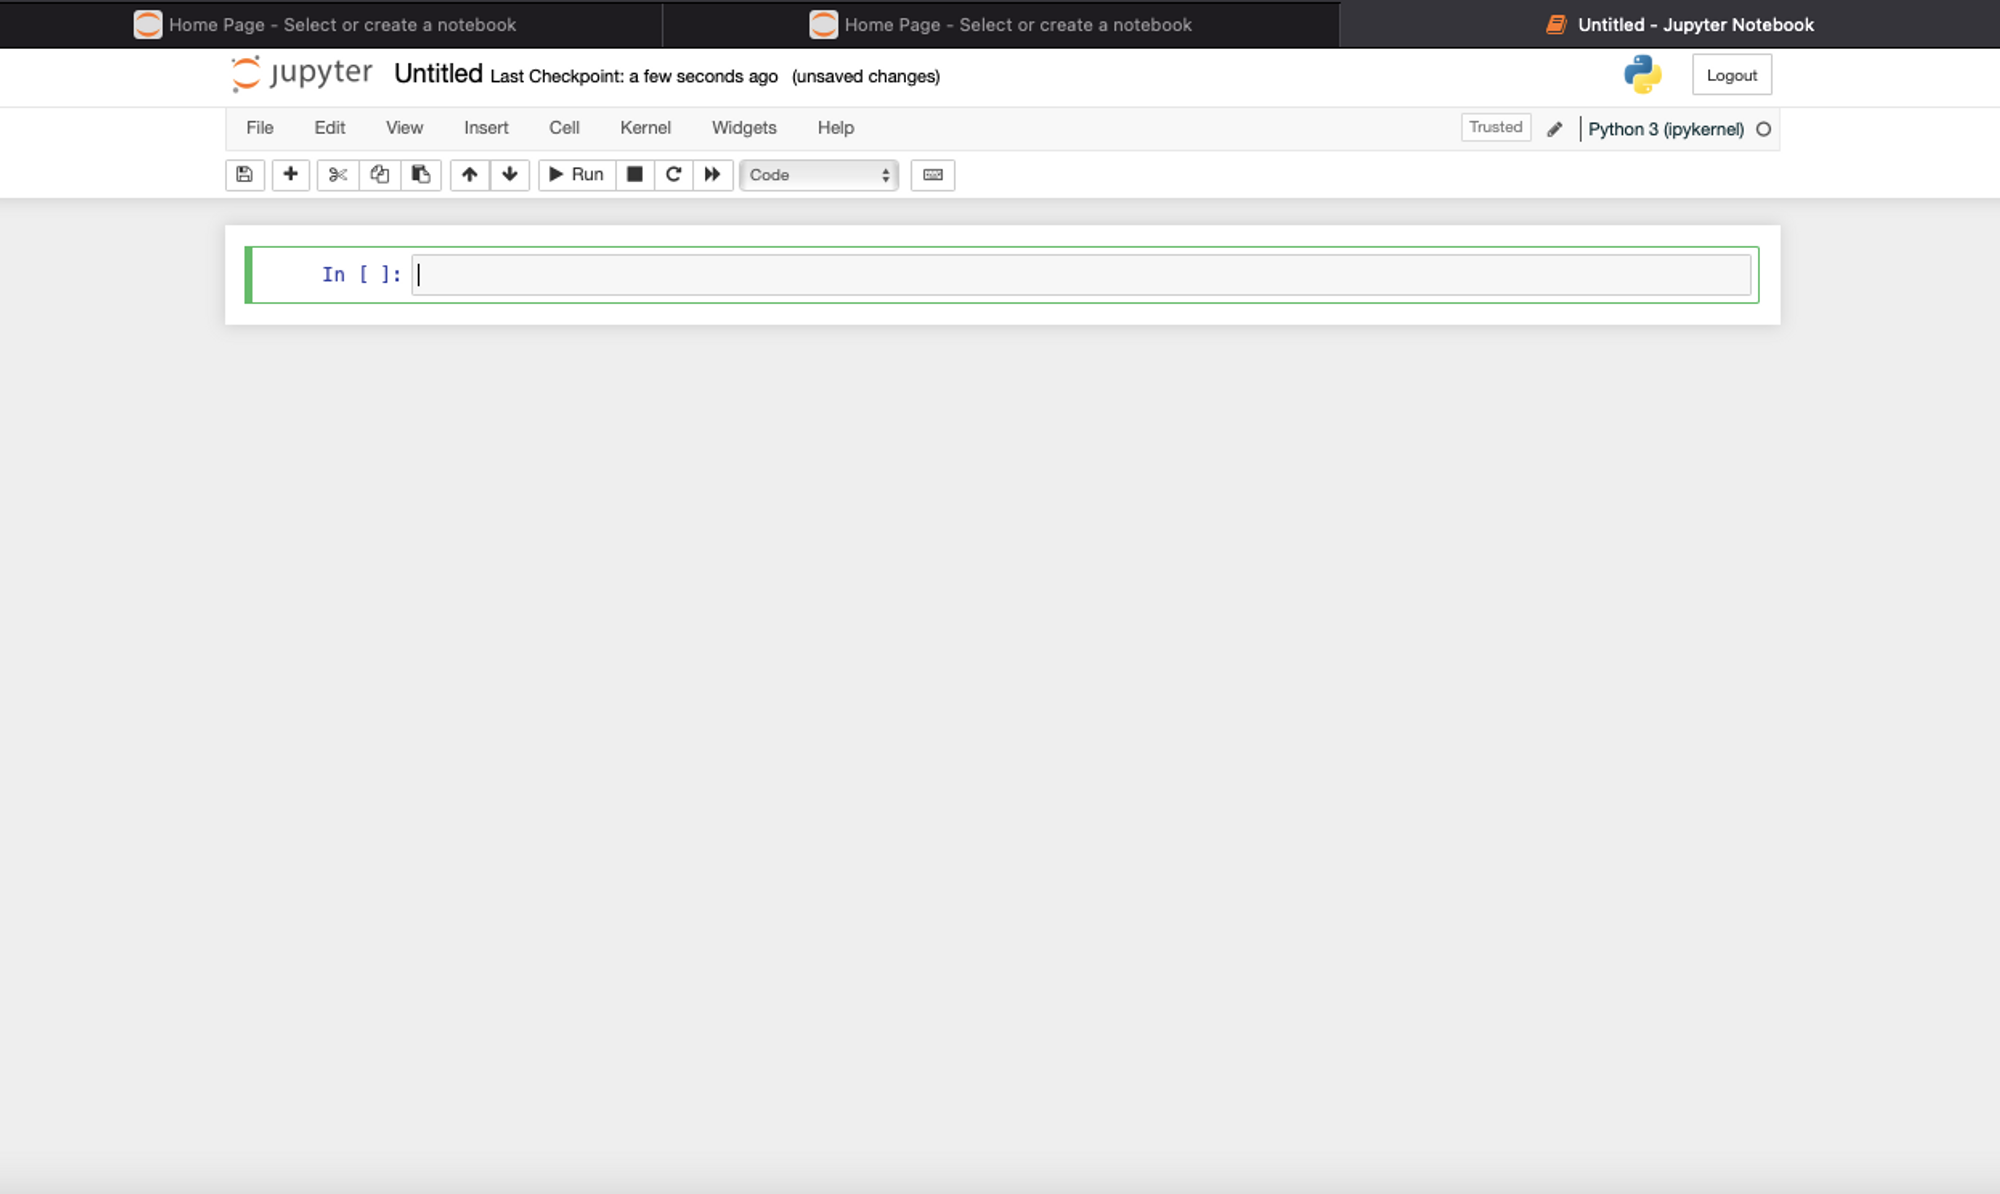
That’s it. A new Python Notebook will be open for you to start running analysis.
Install Pandas Module
Again, if you are using Anaconda then you don’t need to worry about installing Pandas as it already comes with Anaconda. Otherwise, using PIP or Conda environment you can download it with the following command:
# install pandas with pip
$ pip install pandas

# install pandas with conda
$ conda install pandas
Your environment is now setup. Next, we’ll see different data exploration methods provided by Pandas. Let’s dive in.
Loading Data for Exploration
To begin with, you need to import Pandas into the notebook. In the first cell of the notebook, just write:
# import dependencies
import pandas as pd
Then you need to run this cell. You can do so by clicking the Run button shown in the above panel or by clicking the Shift+Enter key on the keyboard. Once you run this cell, the Pandas dependency will be loaded.
Next, you need to load the titanic dataset CSV into the notebook using pandas read_csv() method. Pandas also provide different functions to read data from Excel, Databases, JSON, or a Pickle.
# load dataset
titanic_data = pd.read_csv('Titanic_dataset.csv')
titanic_data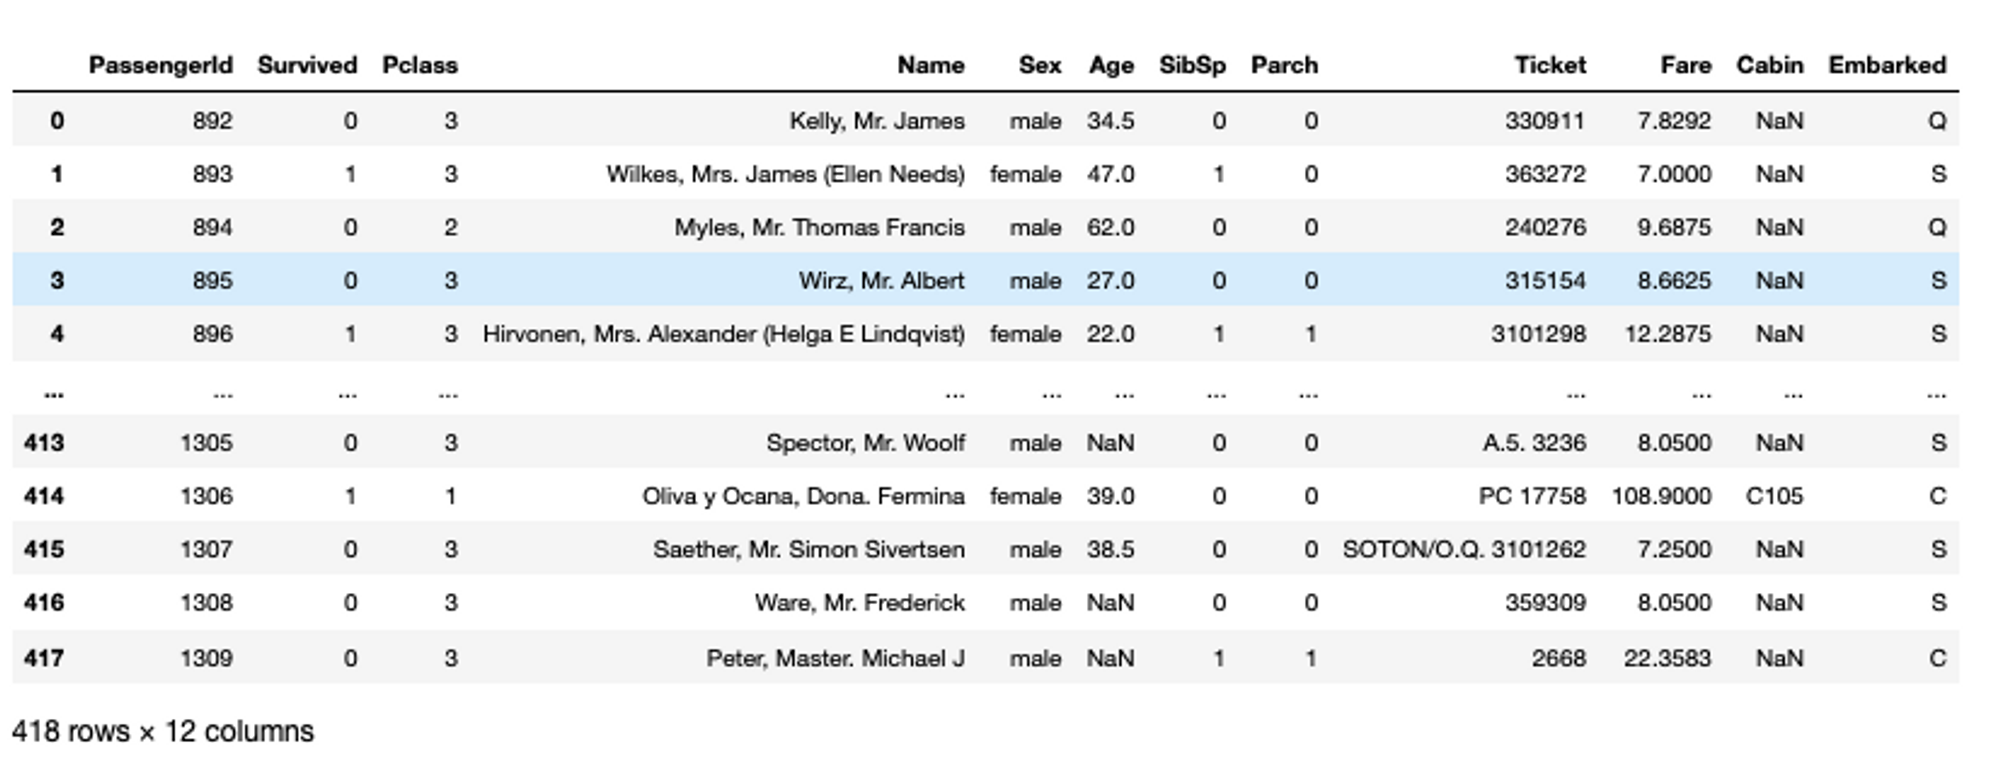
As you can see, you don’t need to use the print() statement in last line of the cell, only the name is enough to print the object. This works only on the last line, if you need to print the data in between code lines, you need to use the print statement.
Get to Know Your Data
Preview Methods
The data exploration journey starts with the basic walkthrough of data—how it looks, what columns it contains, what are different datatypes of the columns are, and so on. Pandas preview functions give us a glimpse of data. The head() method shows the first few rows of data (default 5 but you can control it). This method takes one optional argument for the number of rows the user wants to see.
# check first few rows of data
titanic_data.head()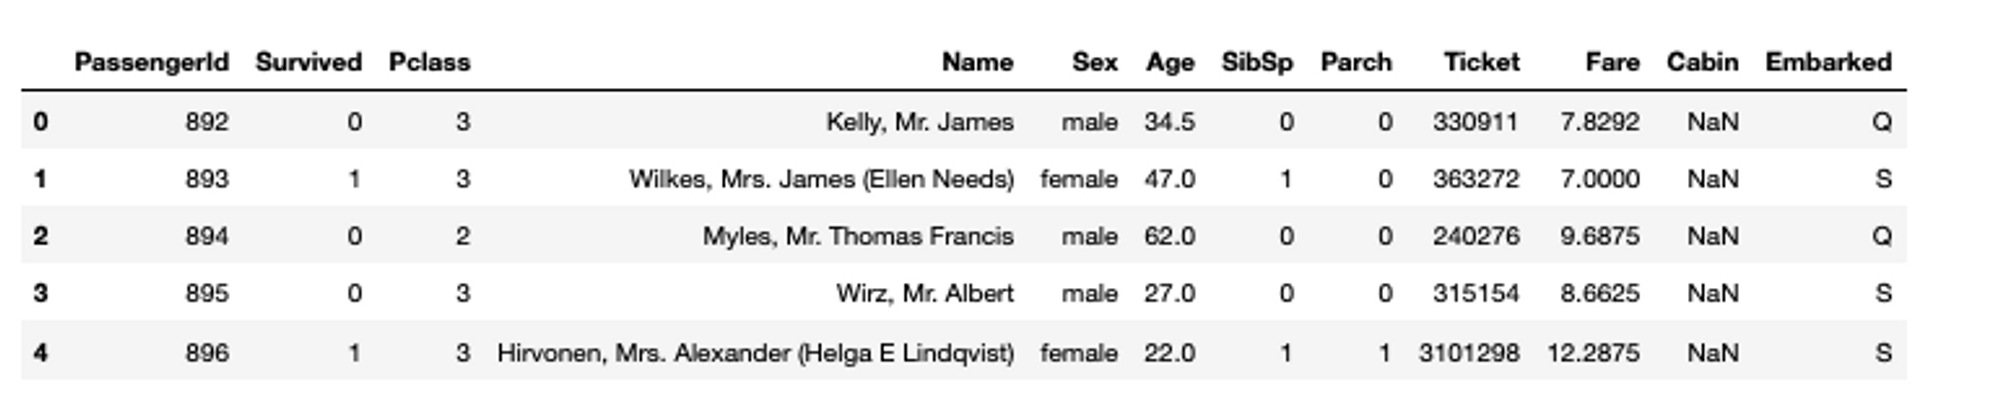
The tail() method shows the last few rows of data (default 5) and similar to head() it takes on the argument for the number of rows.
# check the last few rows of data
titanic_data.tail(7)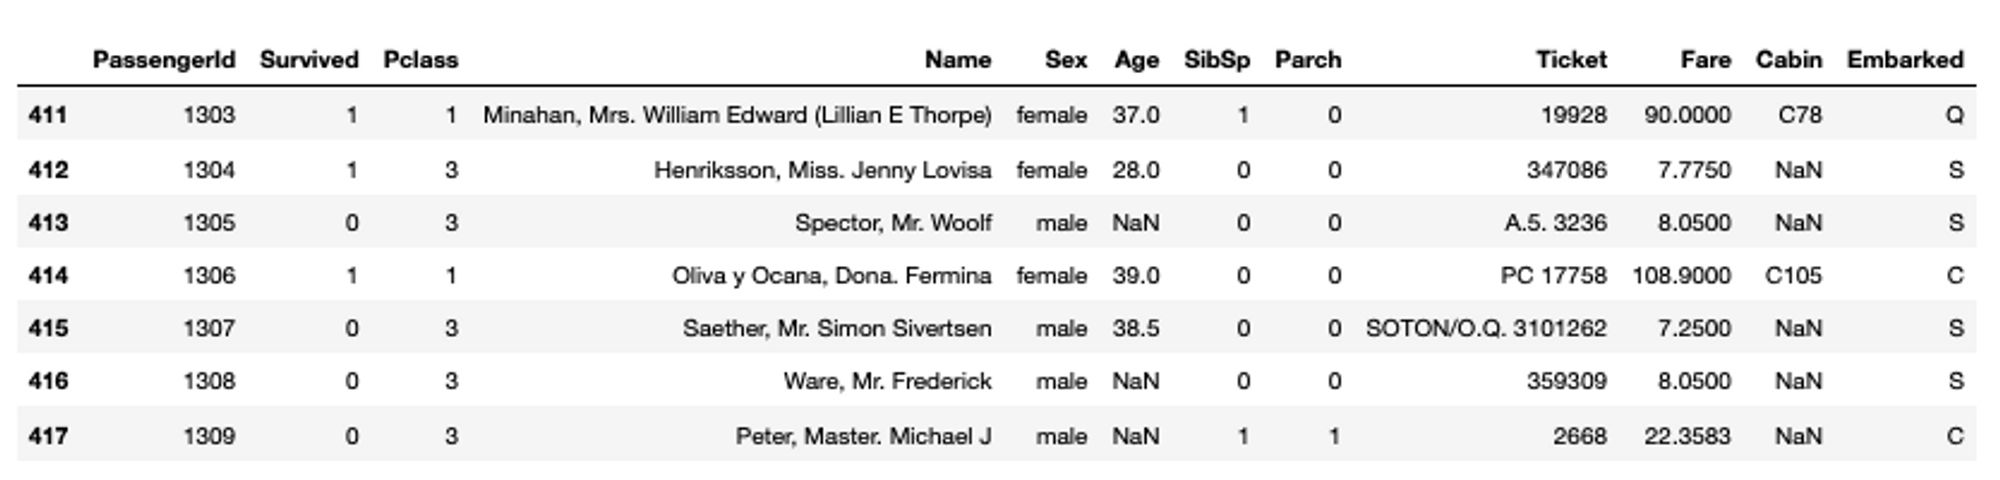
Finally, the sample() method shows the randomly sampled data rows (default 1) from the dataset. For example, if you want to check 10 randomly sample rows from the titanic dataset, you can do so as follows:
# check a random sample of data
titanic_data.sample(10)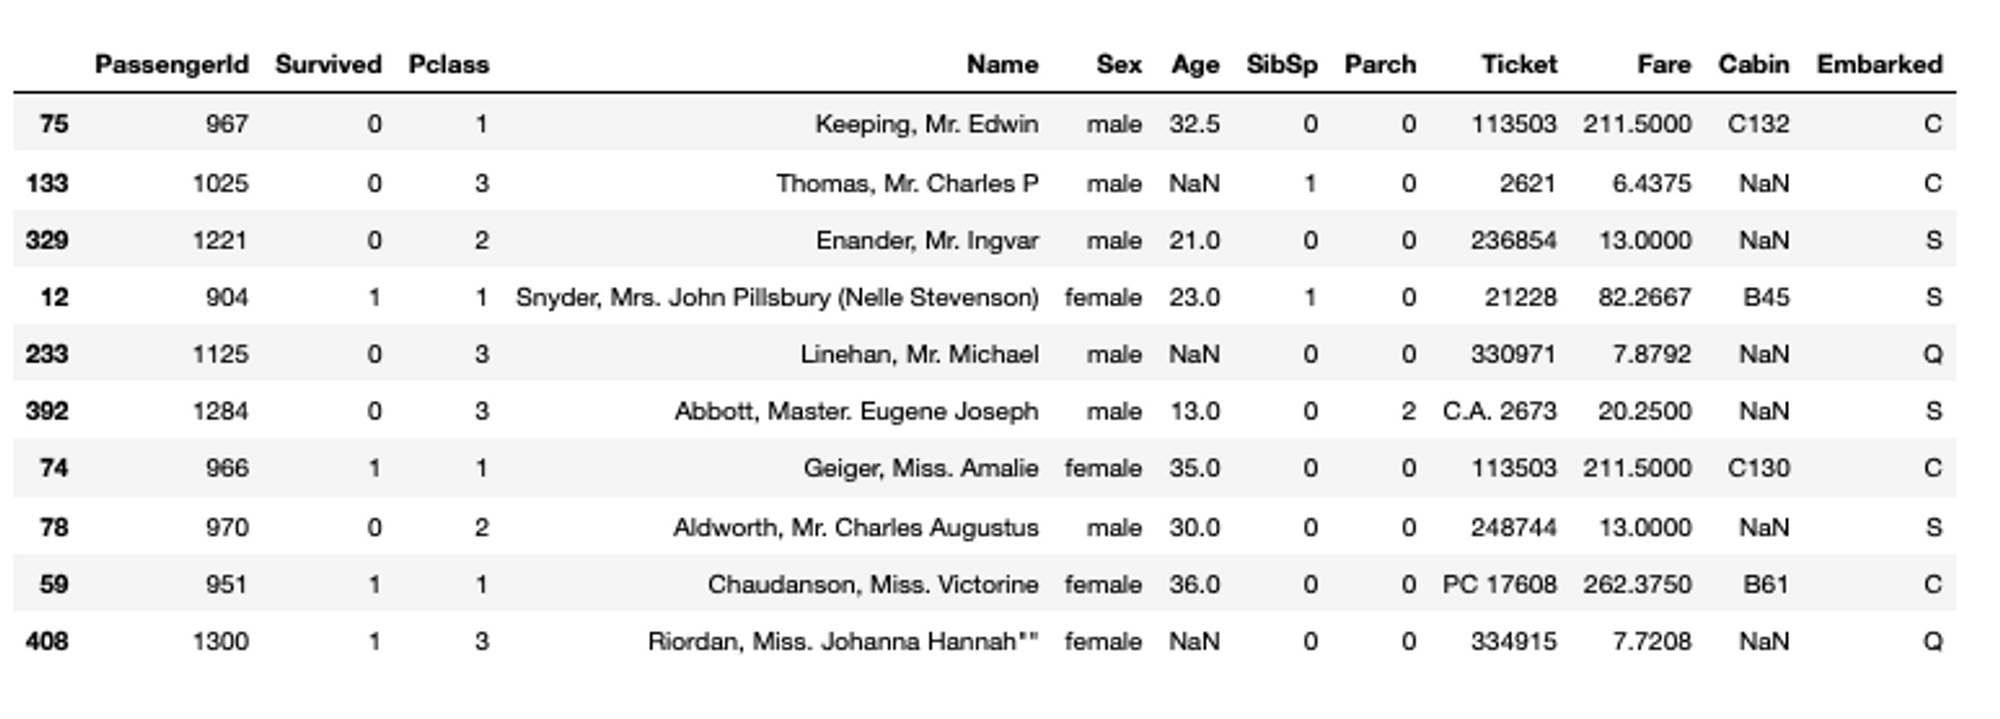
Gathering Basic Information
To gather the basic information about the dataset such as column names, column data types, number of rows, or number of Null values, you can use the info() method from Pandas.
# check datatypes, null values, and memory usage
titanic_data.info()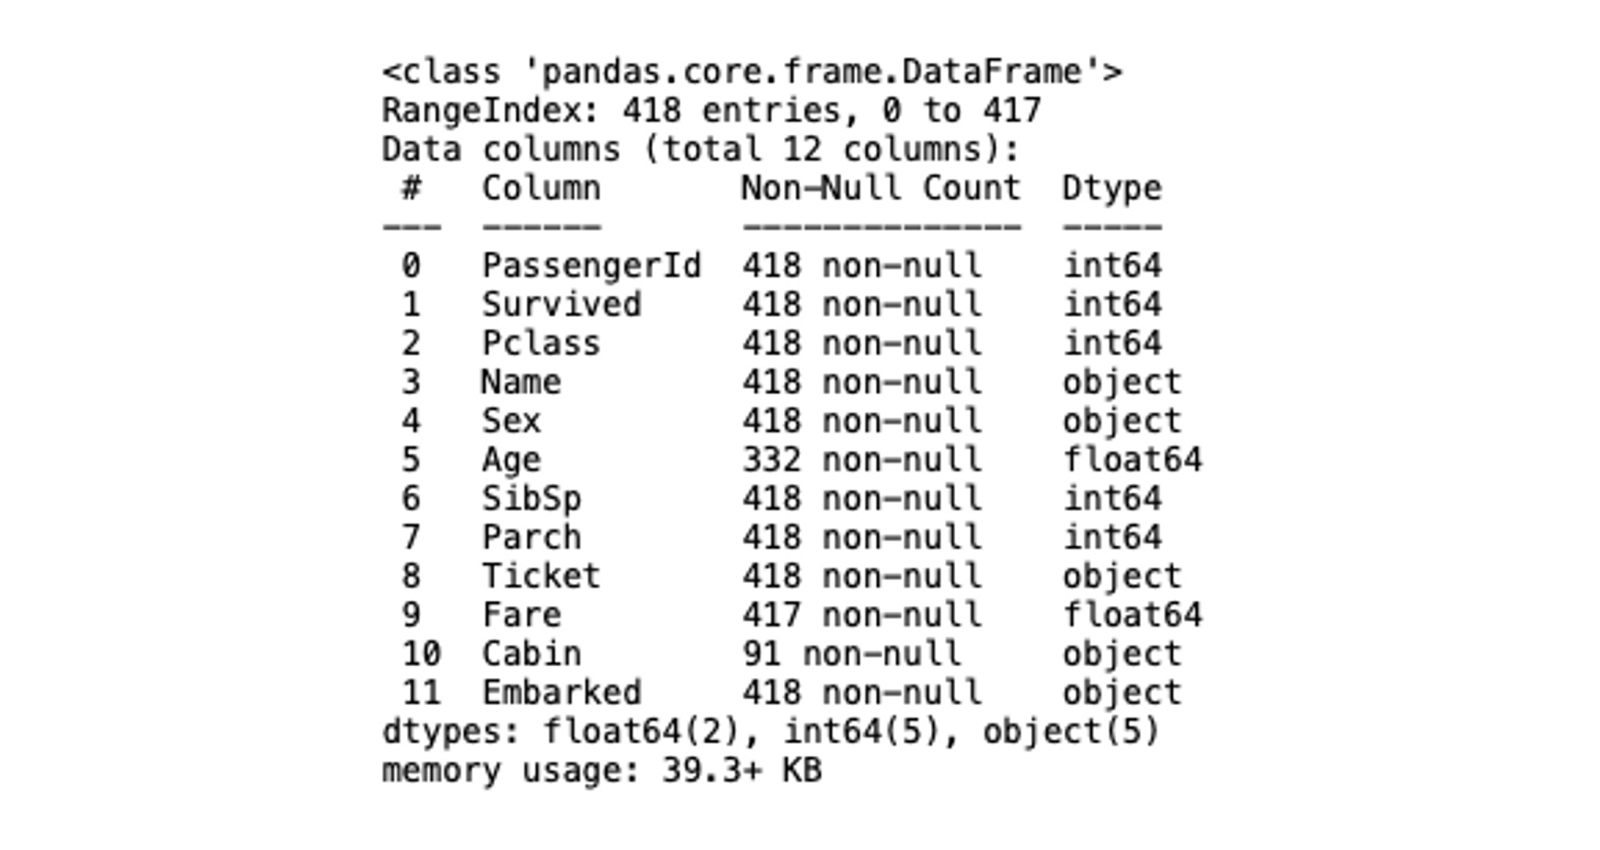
As you can see, the info() method gives you an idea of what columns have Null values, decides if a column has the correct data type or not, and finally lets you check the memory usage. This is a good starting point to get to grips with the data. For example, here we can see that the Age, Fare, and Cabin columns have fewer entries than the other columns, which means they have NaN values. NaN values in a dataset can make analysis more complicated, so its good to know this upfront.
Descriptive Statistics
Calculating descriptive statistics such as central tendency, data dispersion, percentile, and NaN values helps you identify if your data is suitable for further use. Calculating them one by one using different methods can be tedious, so Pandas provides describe() method that can calculate all these statistics for you.
Note: The describe method provides the descriptive statistics information for only numerical columns.
# check descriptive statistics of data
titanic_data.describe()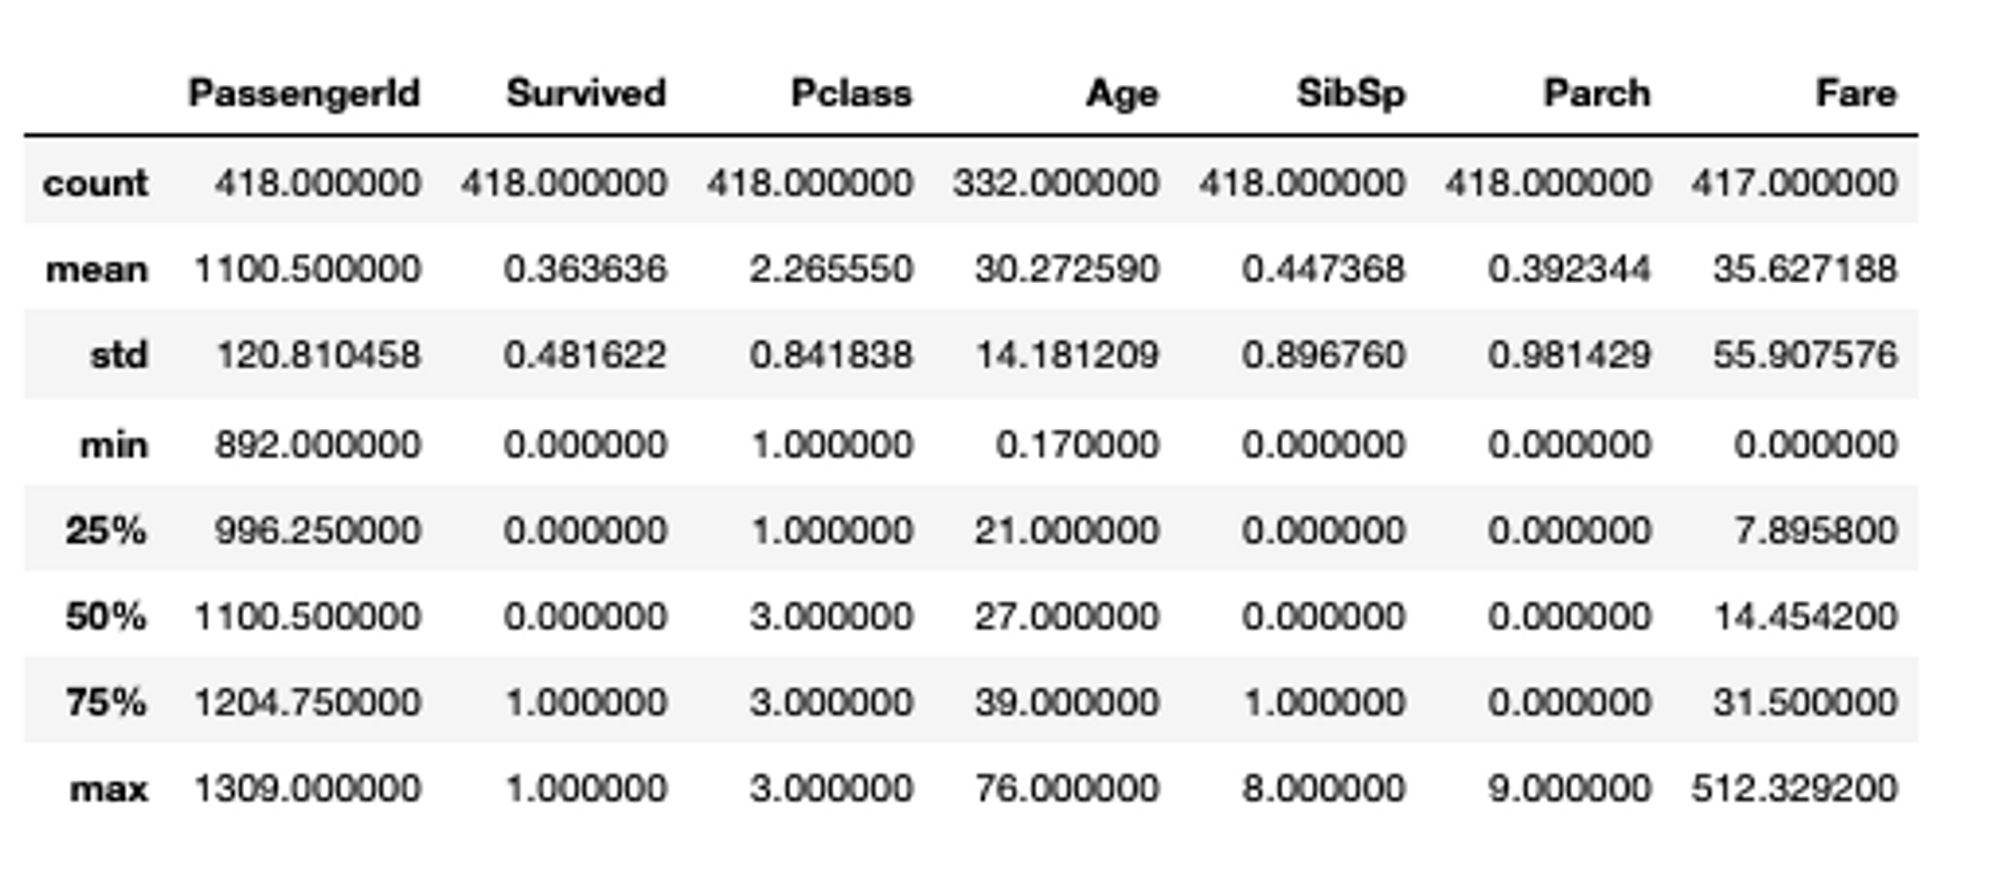
It’s not that all of these will always be useful. Again, these descriptive statistics are more for giving you a good understanding of the dataset rather than being able to draw strong conclusions at this point. But here it might be informative to know that the age of those onboard skewed younger.
Filtering and Subsetting Data
Selecting Specific Columns and Rows
Sometimes you may want to check what values a feature in the dataset contains, you can do so by using the index mechanism provided by Pandas. For example, say we want to look deeper into that age data. To access the Age column from titanic data, you can use the following line of code:
# check column values
titanic_data['Age']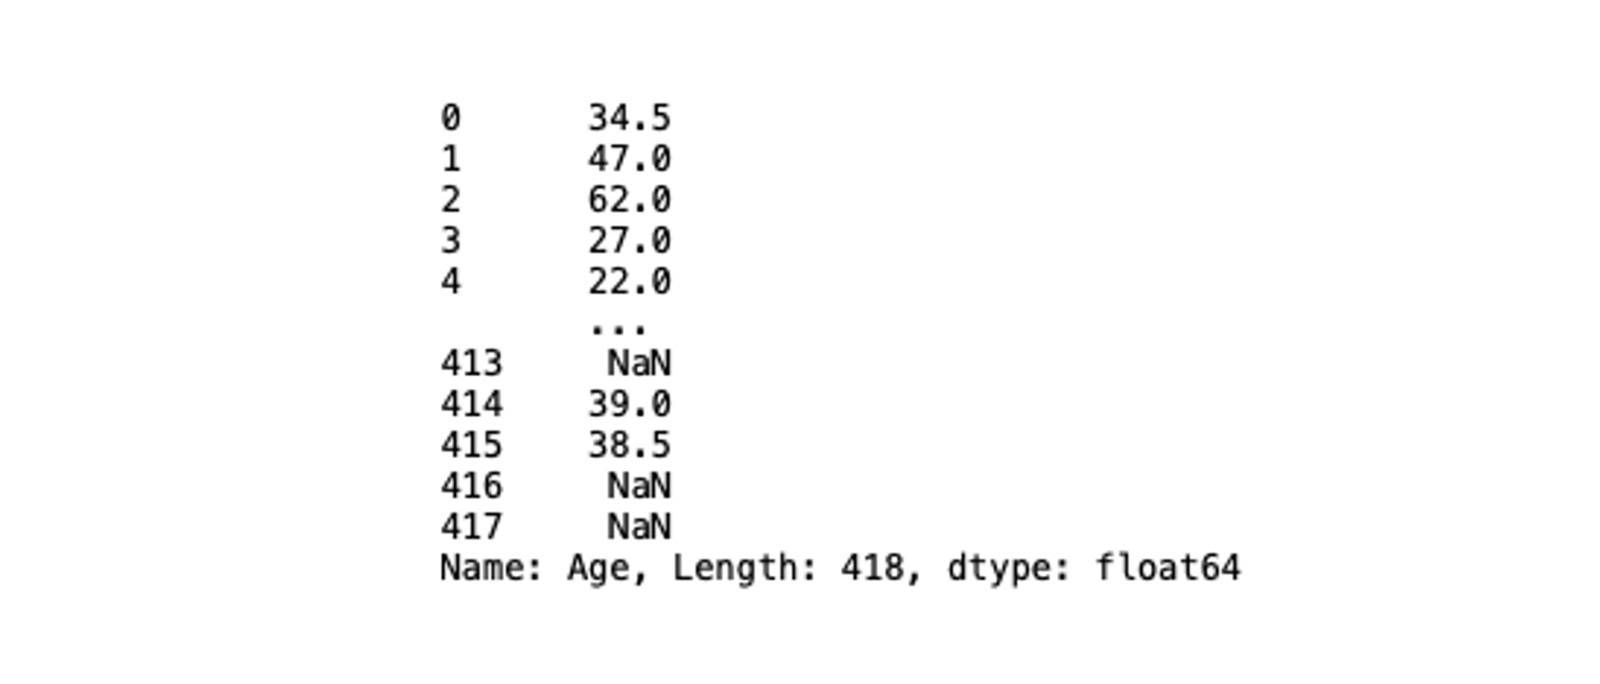
You can further slice this column to select the set of values using the list like indexing as follows:
# check the column and its data type
titanic_data['Age'][:5]
When looking for the rows, you need to work on the index column of the dataset. The default index column for any dataframe loaded with Pandas has values from 1 to N (number of rows) until explicitly set. To access the row values Pandas provides the loc[] function that takes the index value as an argument.
For this example let’s make our Name column the index to better understand the loc[] method.
# set Name column as index
titanic_data_index = titanic_data.set_index('Name')

# check values with index value
titanic_data_index.loc['Wilkes, Mrs. James (Ellen Needs)']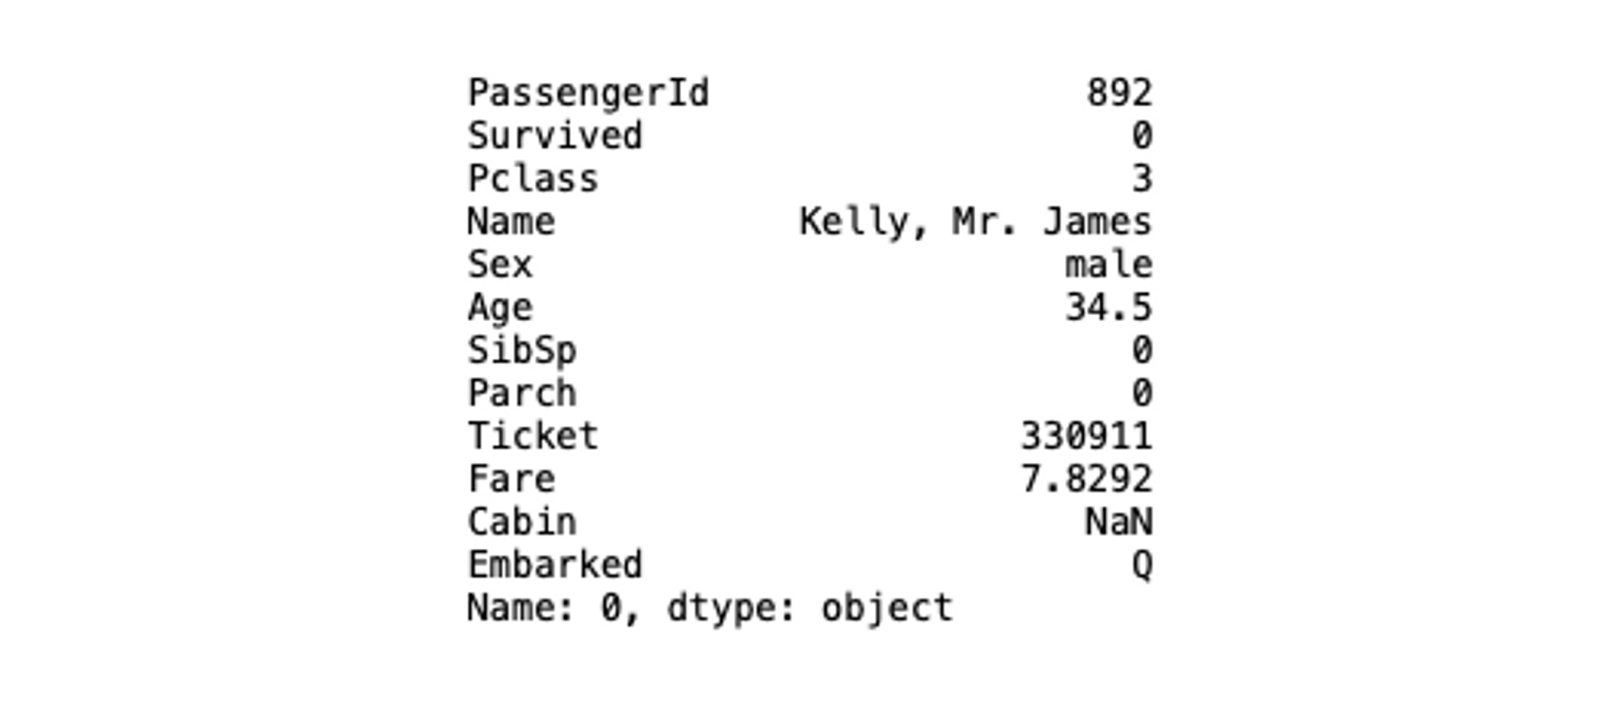
As you can see, all the values where the index is Wilkes, Mrs. James (Ellen Needs) are printed. You can also provide a range of values (using the : operator) and the column names to filter out the desired columns.
# check values with index name and column select columns
titanic_data_index.loc['Wilkes, Mrs. James (Ellen Needs)' : 'Ware, Mr. Frederick', ['Survived', 'Age']]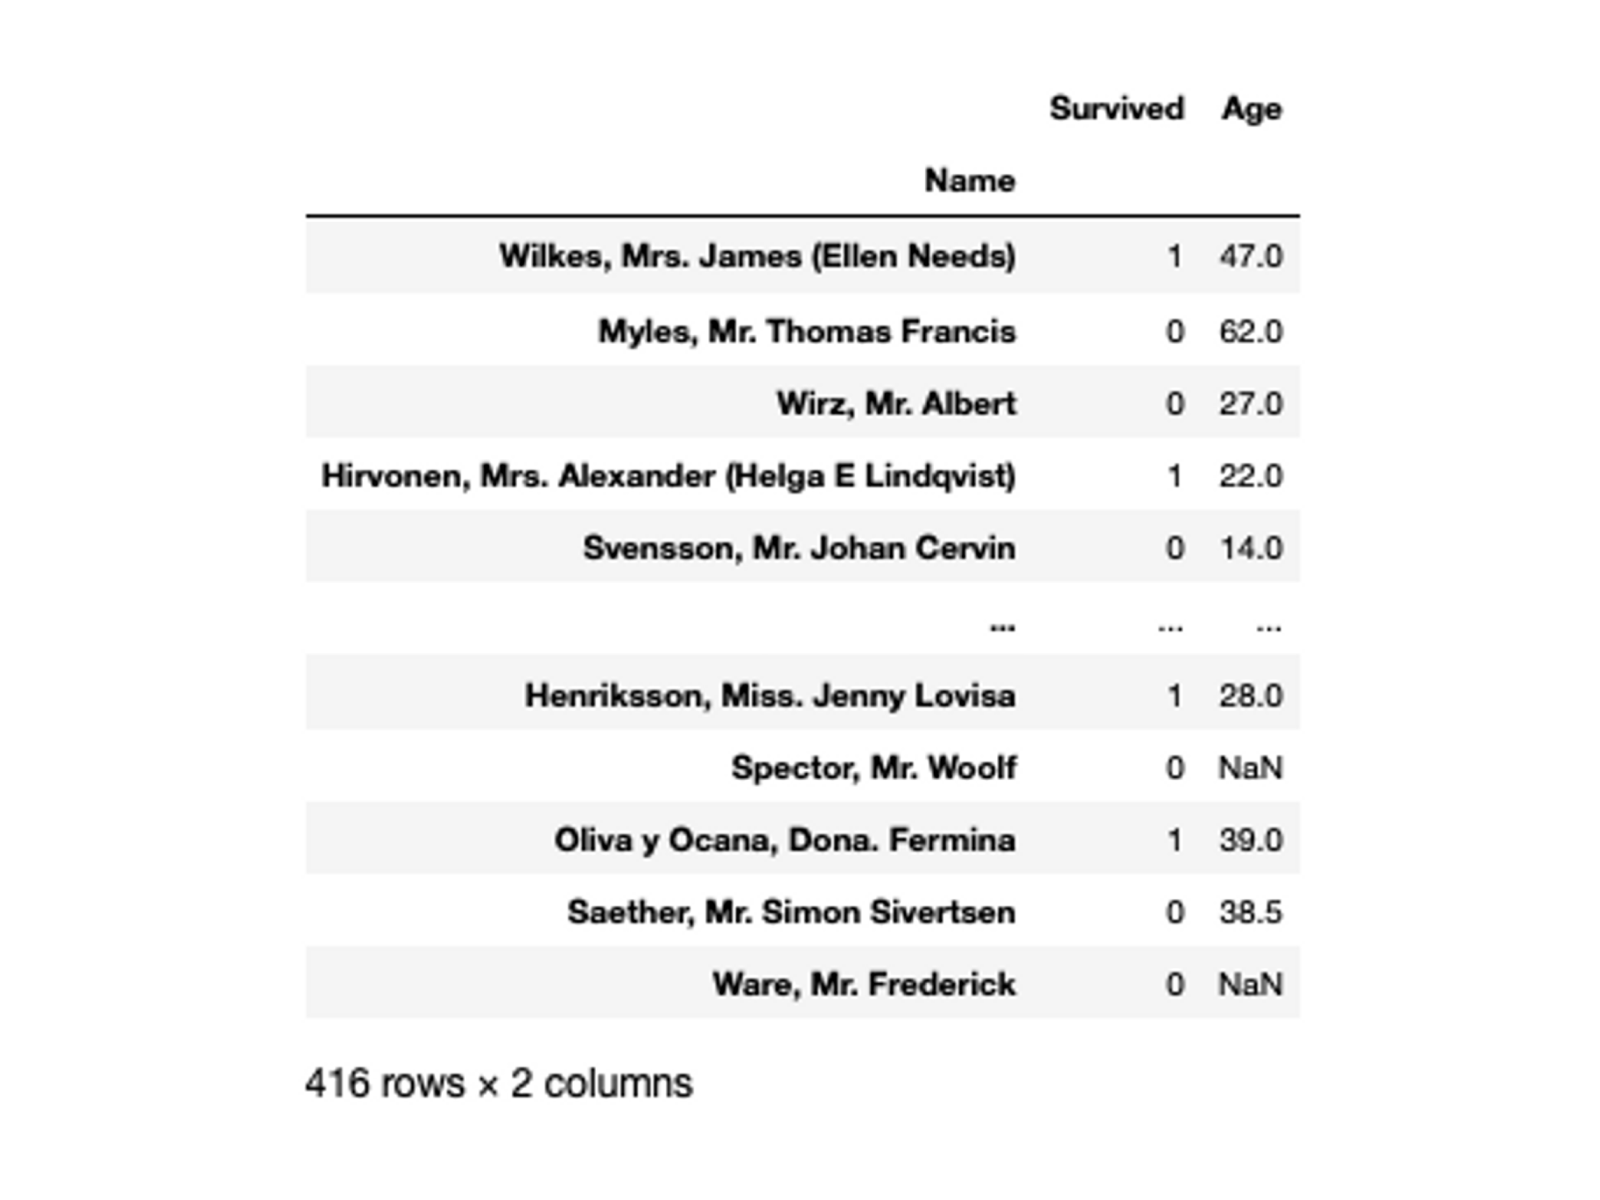
There is also scope for you to select the rows based on index number instead of value using the iloc[] function. For example, selecting the row number 1 with iloc[] looks like this:
# check values with index number
titanic_data_index.iloc[1]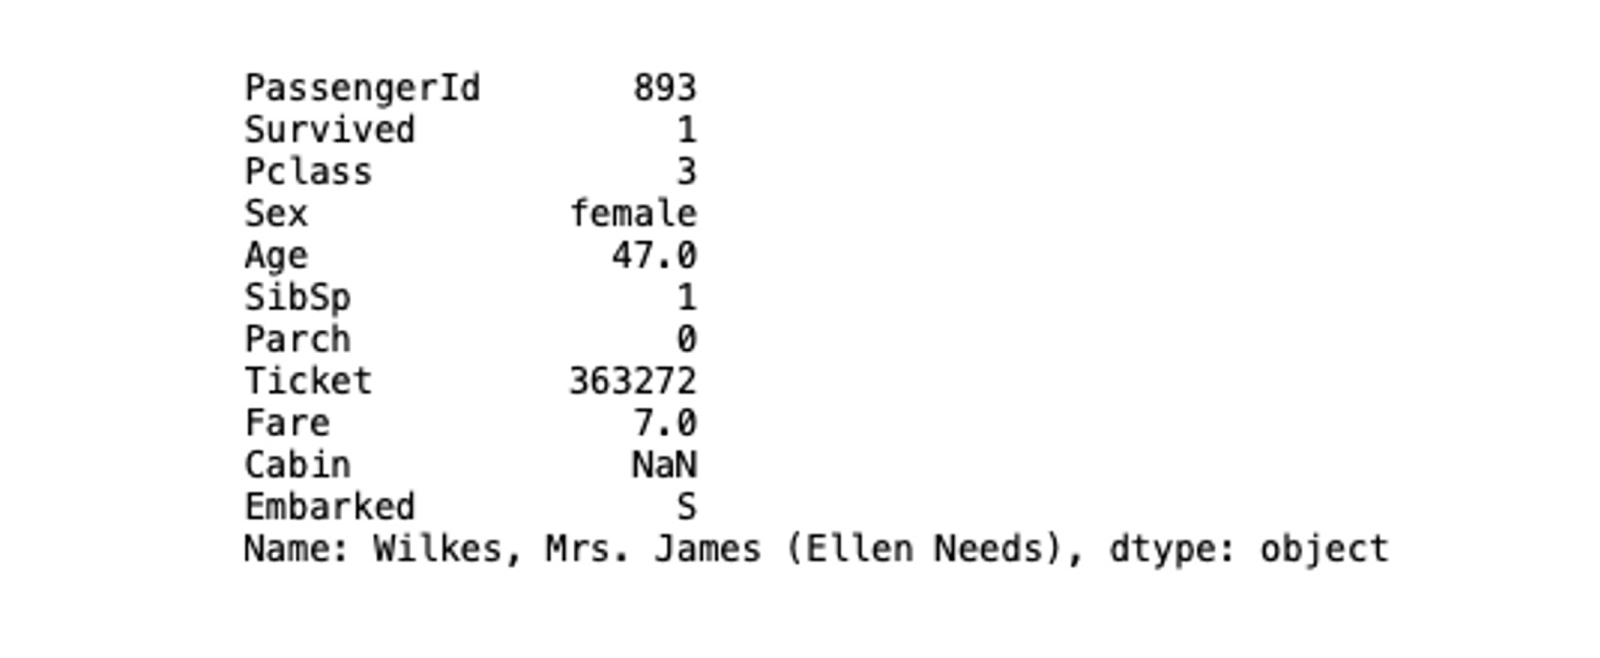
You can also access a list of rows using the : operator. And also filter the columns with the column number.
# check values with index number
titanic_data_index.iloc[1:5, 1:5]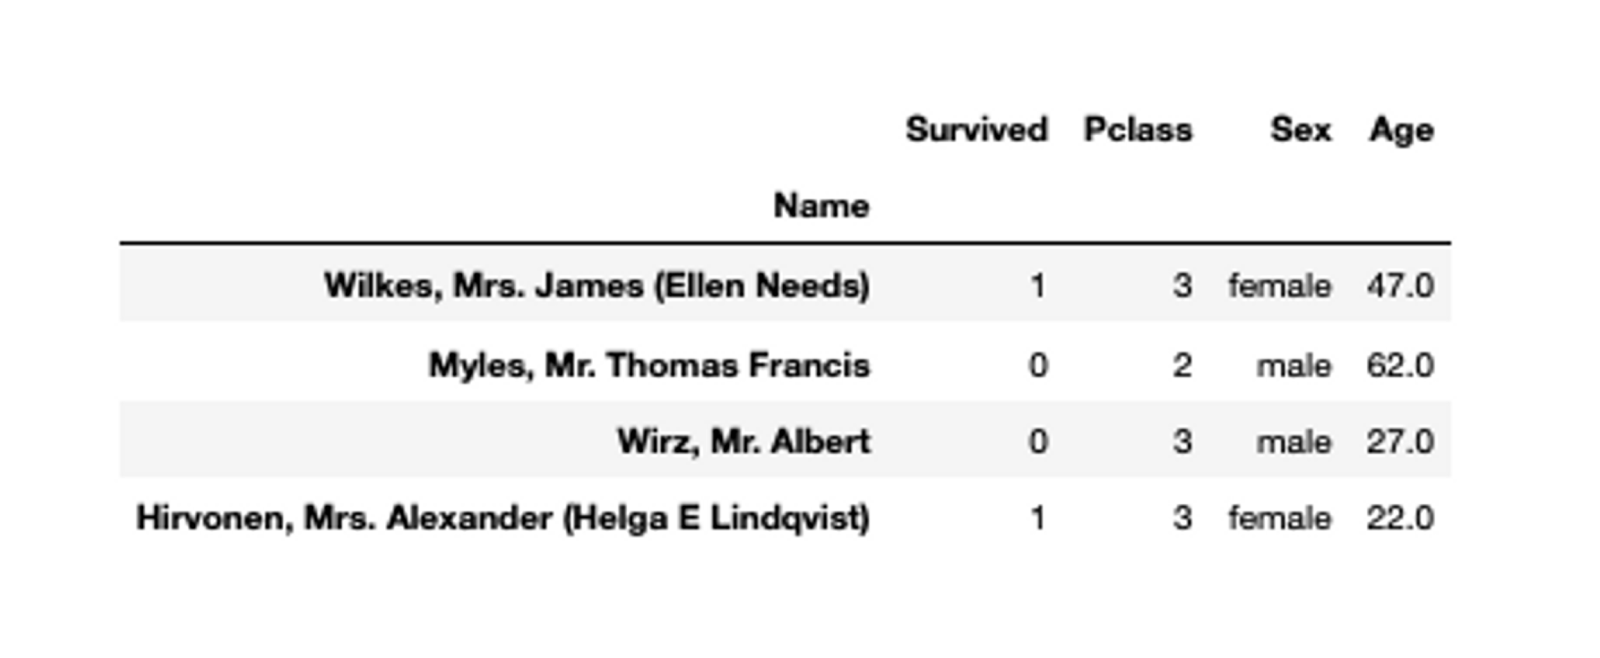
Using Conditional Filtering
Conditional filtering is one of the most important parts of data exploration as it helps you uncover different patterns in data based on filters. For conditional filtering, you are provided with different comparison operations like ==, >, <, and !=, along with the logical operators like and, or and not. The basic expression of filtering requires selecting a column and a filter value or a list of filter values plugged into [] brackets. For example, filtering the Pclass (passenger class) in the titanic dataset where the class value is 3, will have the following filtering expression:
# filter data based on conditions
titanic_data[titanic_data['Pclass'] == 3]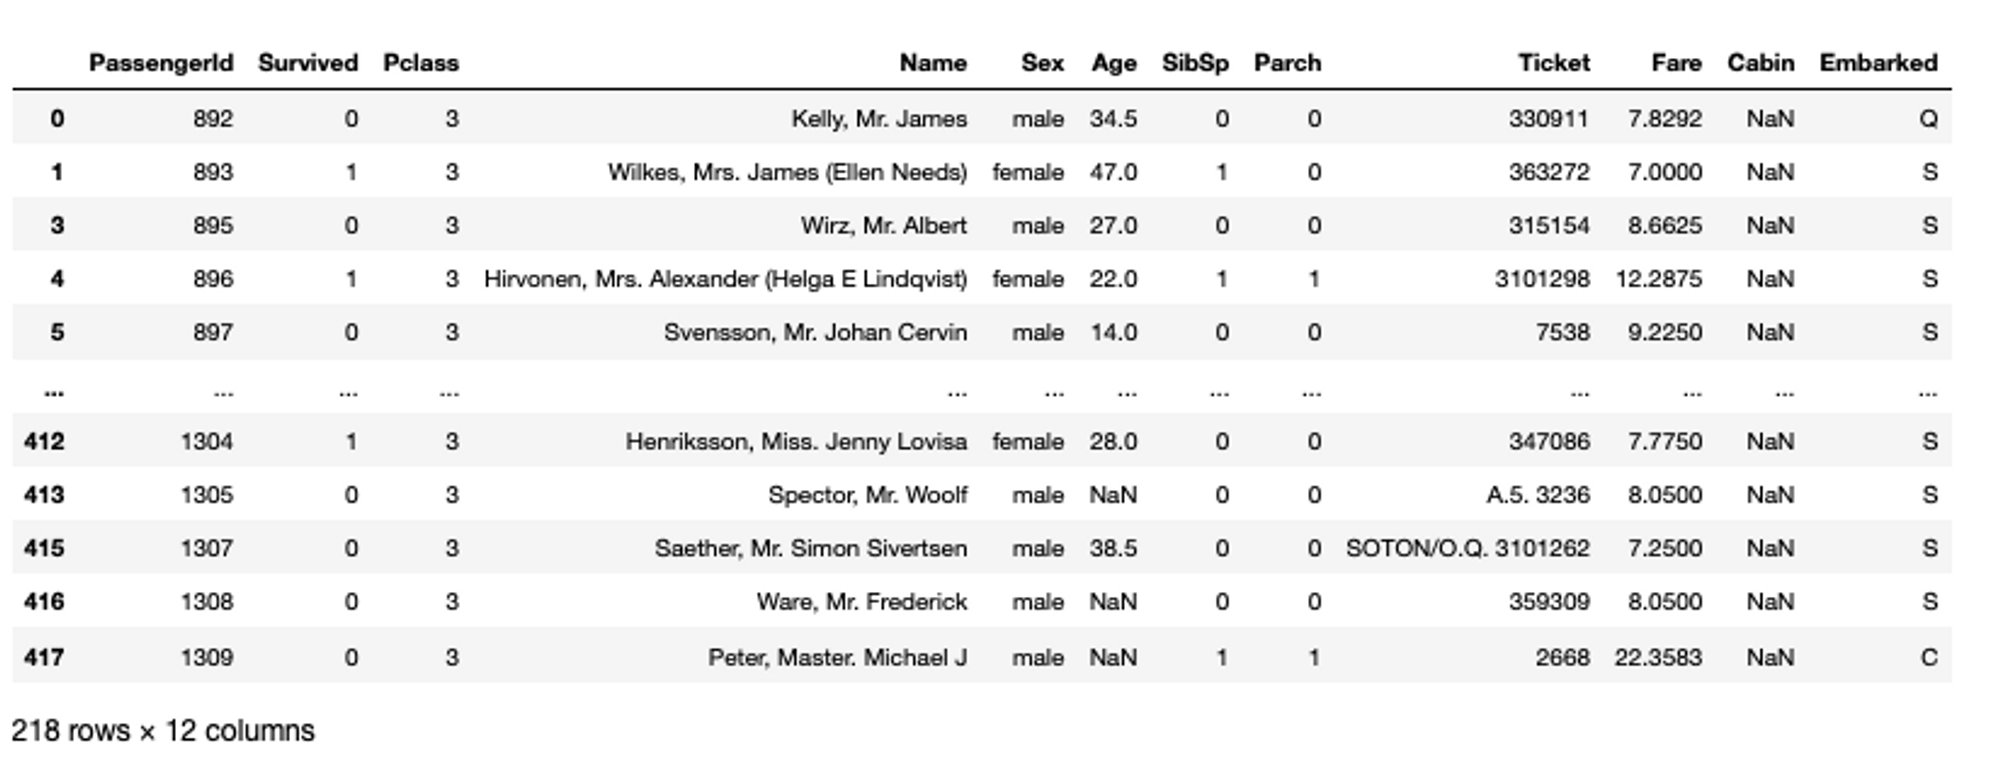
You can also apply multiple conditions to a single or a set of columns using the logical operators. For example, filter the titanic data where Pclass is 3 and Age of passengers is greater than or equal to 30.
# filter data based on multiple conditions
titanic_data[(titanic_data['Pclass'] == 3) & (titanic_data['Age'] >= 30)]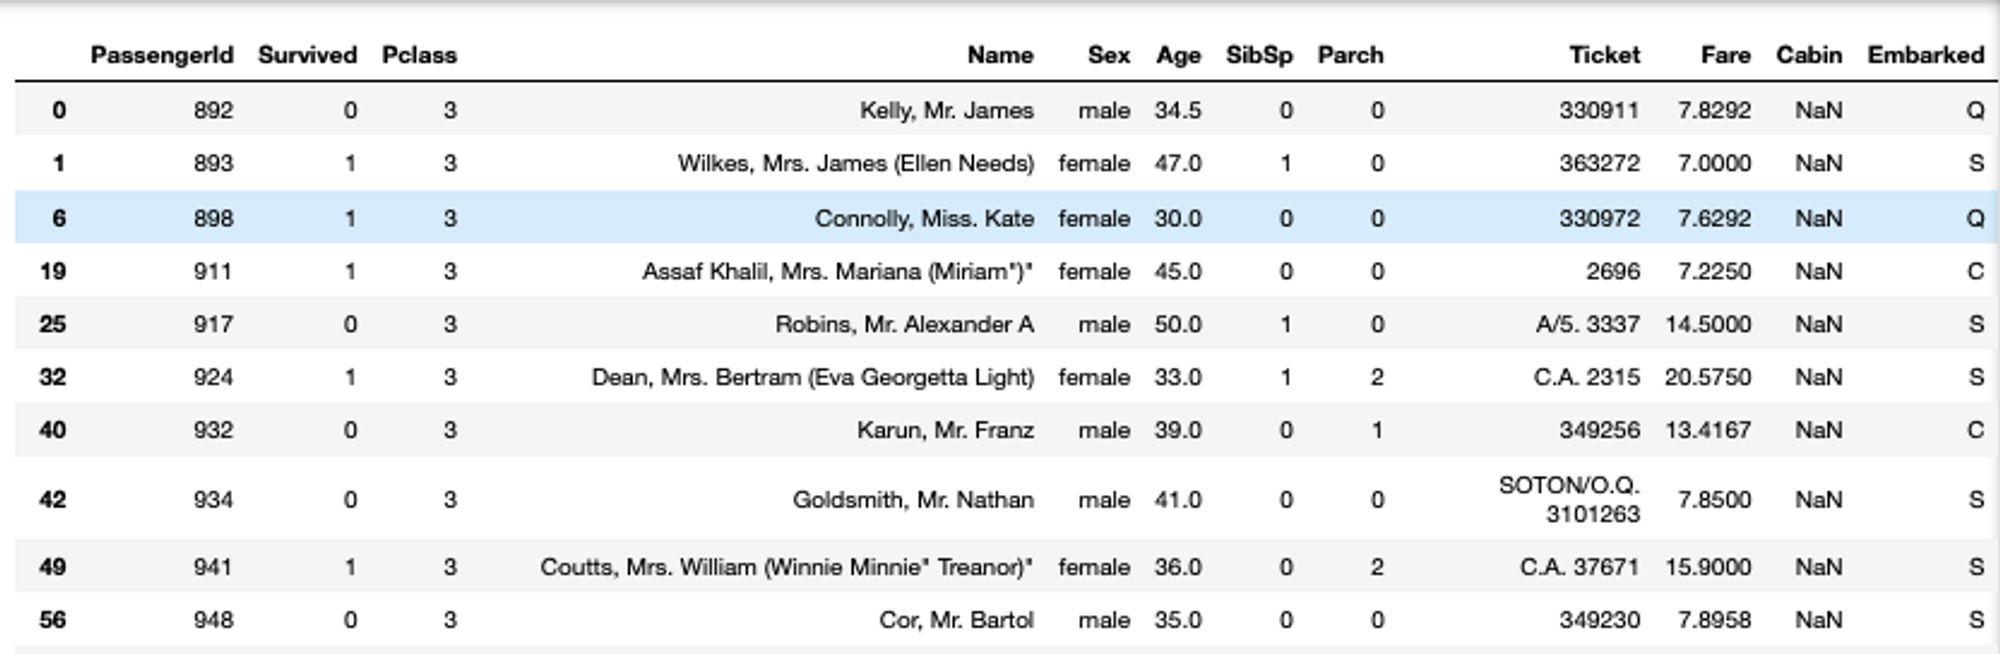
You can also apply the prebuilt Python function for numerical and string filtering such as isin(), between(), str.contains(), isna(), str.startswith(), and str.endswith(). For example, selecting the rows from the original titanic dataset where the Name starts with K looks like this:
# filter data based on prebuilt methods
titanic_data[titanic_data['Name'].str.startswith('K')]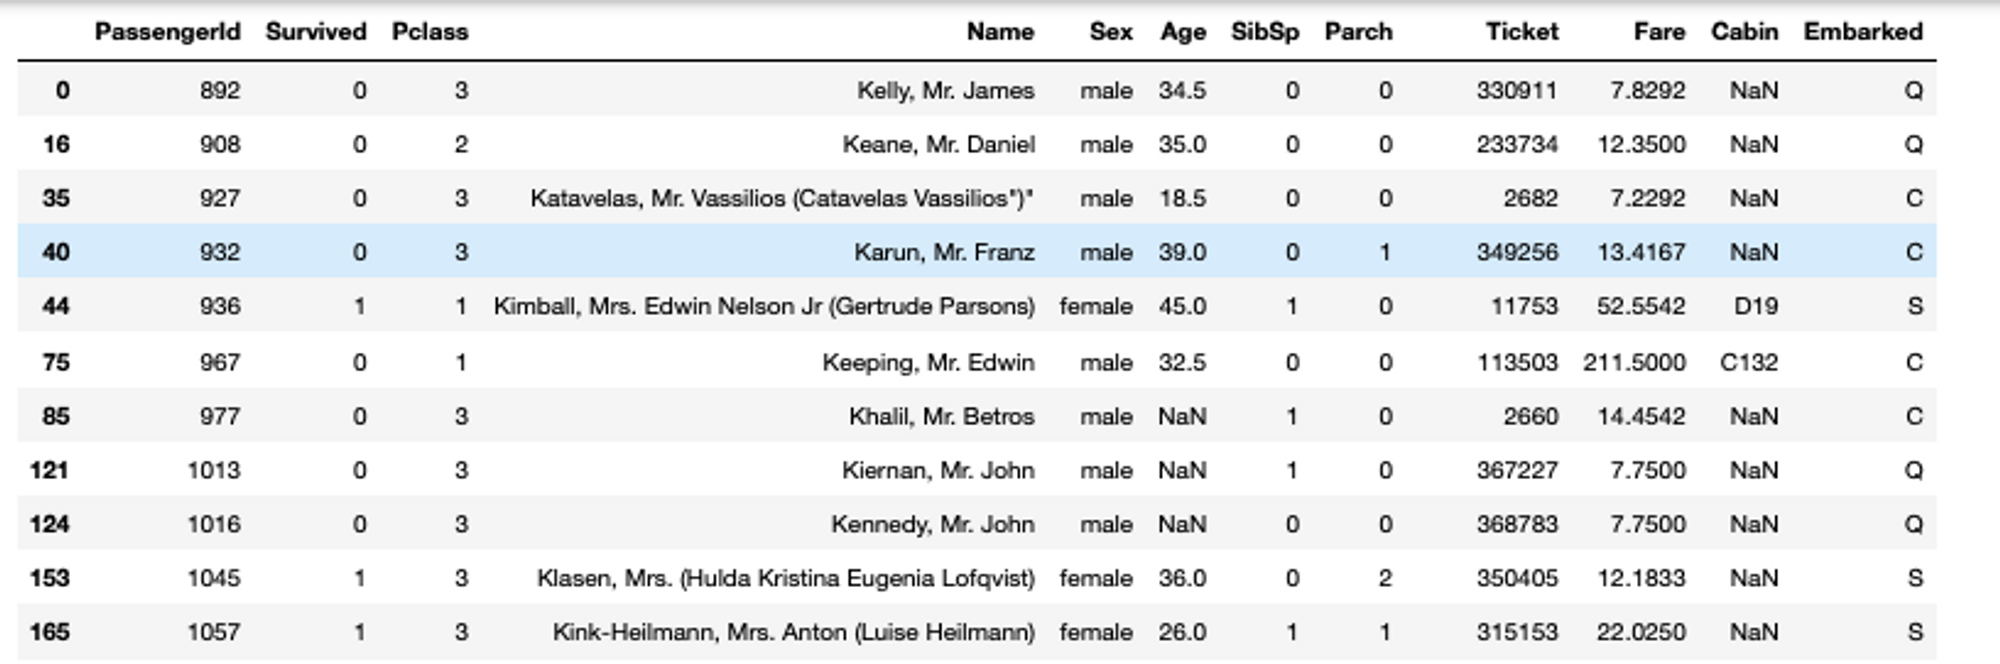
Finally, you can also use the query() method to fetch data based on conditions similar to what we do in SQL but direct expressions. For example, selecting the Age>= 30, the code will be:
# fetch data with query method
titanic_data.query('Age>=30')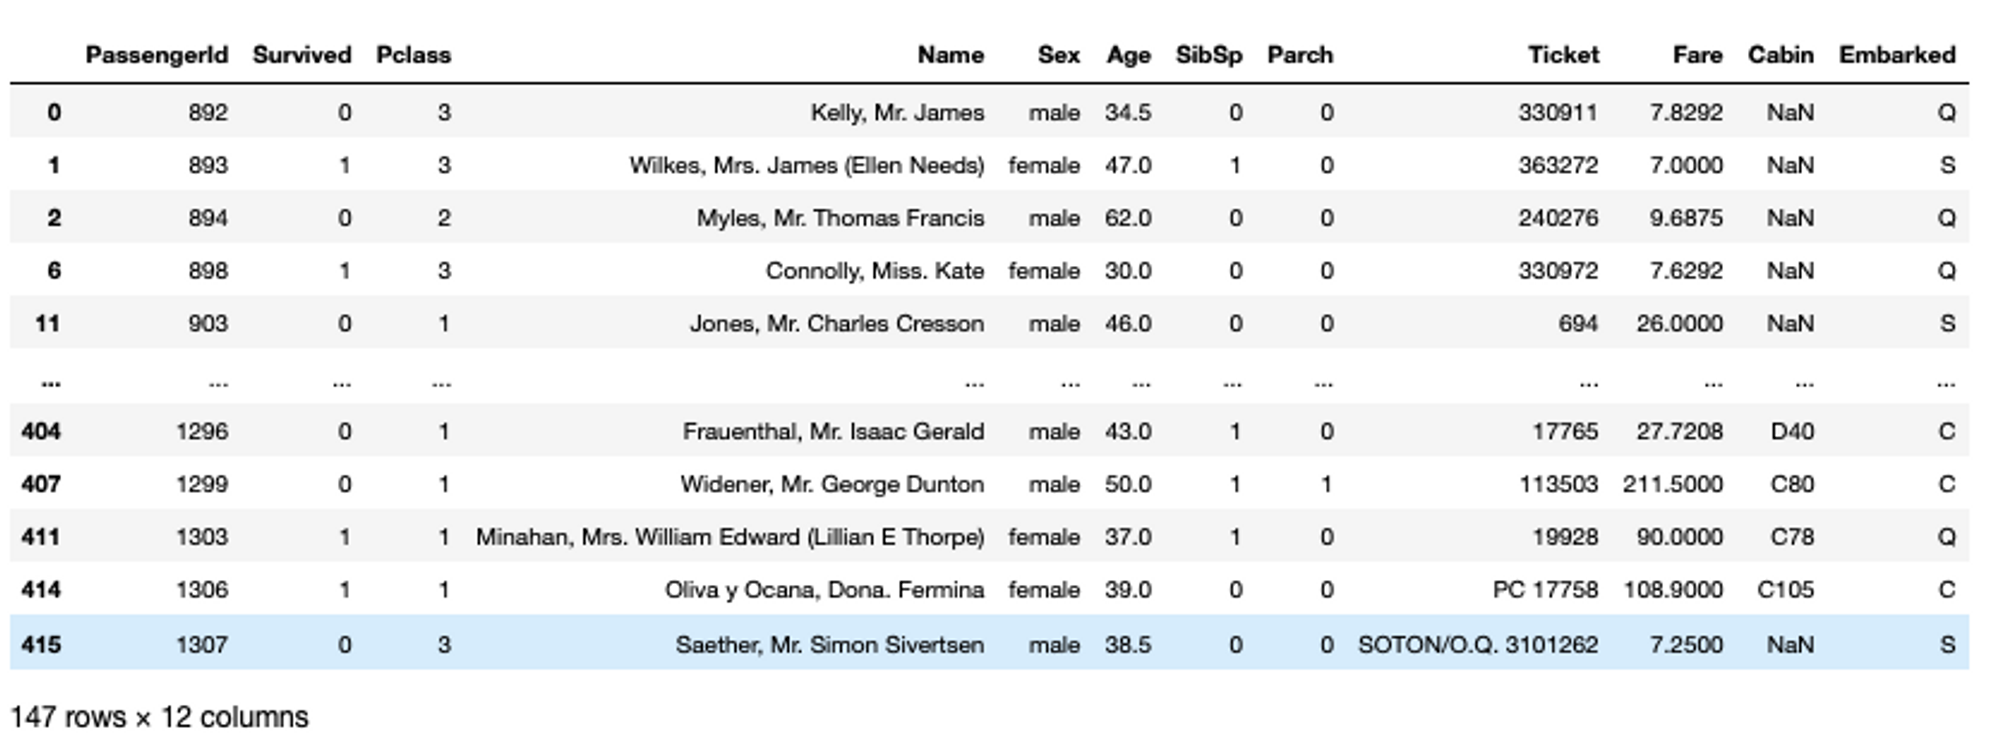
Basic Data Exploration
By now, you’ll start to understand your data and its different attributes. You can now go deeper into the exploration and try out a few concepts like value counts, grouping, and aggregations.
Value Counts Function
Checking the frequency of values in a column is a very common practice used for data analysis. When working on machine learning use cases, sometimes your data may be imbalanced, and the value_counts() method help you determine the ratio of target classes. It provides the count of unique values in a column. An example of calculating the value counts in the Sex column of titanic data will look like this:
# check the frequency of values in Sex column
titanic_data['Sex'].value_counts()
You can also calculate the multi-index value counts in the dataset. For example, based on Pclass the distribution of Age feature values can be calculated as follows:
# multi index value counts
titanic_data[['Pclass', 'Age']].value_counts()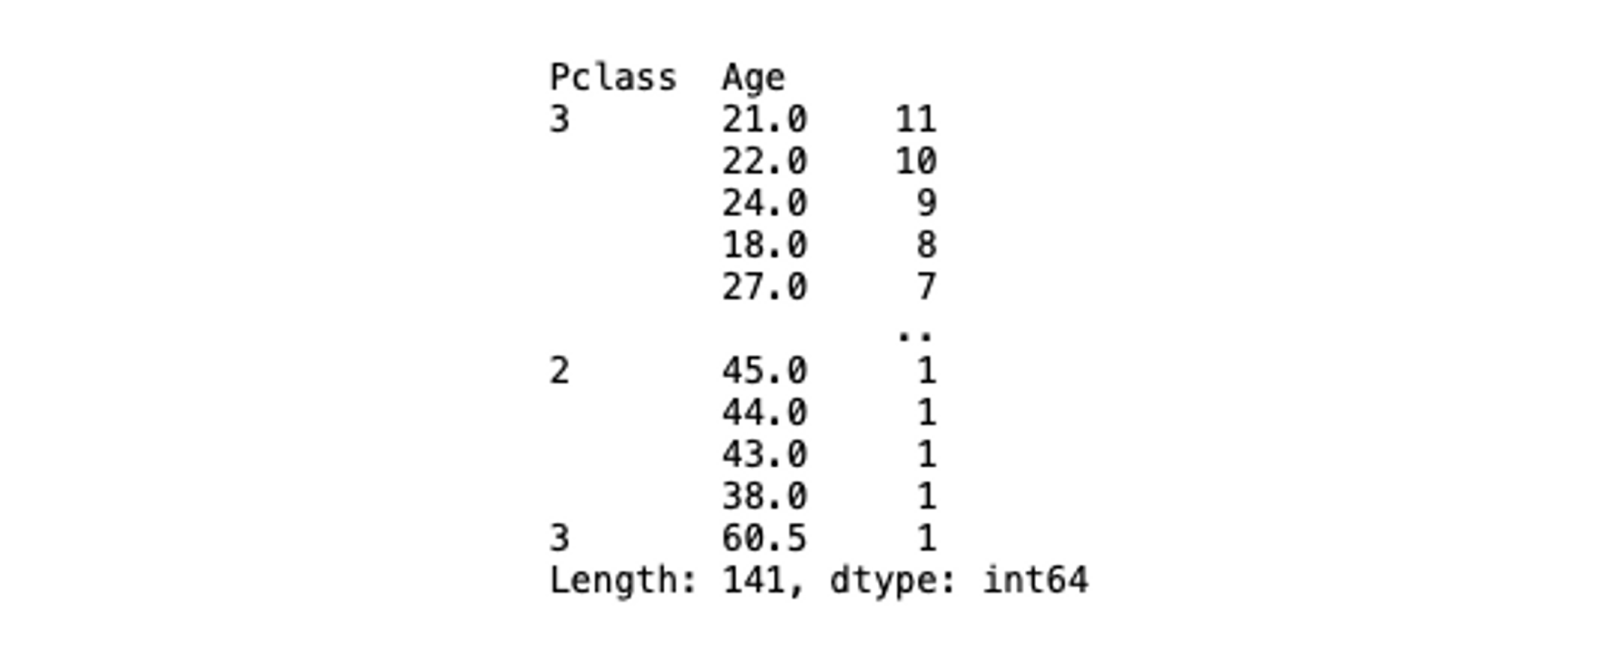
Grouping Data and Aggregation Functions
Sometimes you might also need to group the data based on different statistics such as mean, sum, and median that reveal a lot of hidden patterns in the data. Pandas groupby() method helps you group the larger set of data and allows you to perform different operations on it. To use the groupby() method, you need to provide the feature name or a list of feature names and an aggregate function based on which the data will be grouped together. For example, if you want to group the titanic data based on the Sex column and with mean() aggregation, you can do so as follows:
## Group data by sex in titanic dataset
titanic_data.groupby(['Sex']).mean()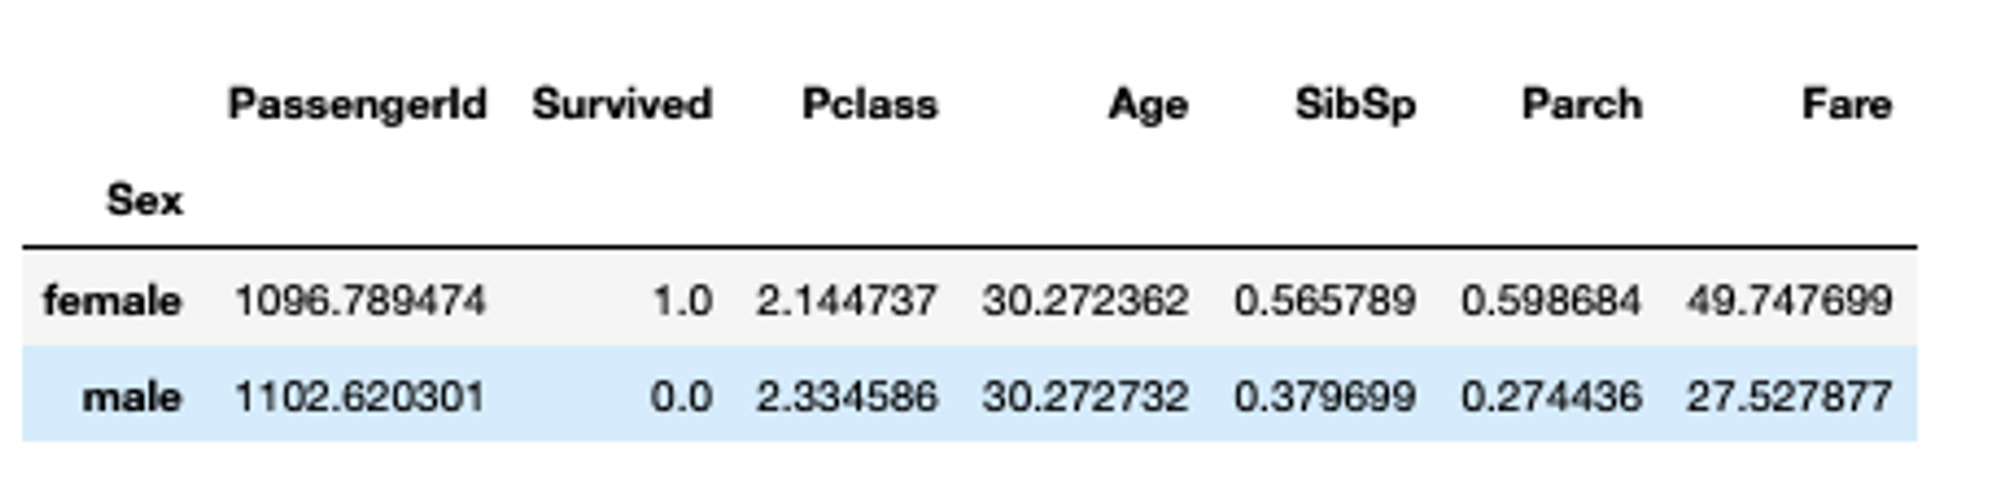
With groupby, we can see that the mean value of women surviving the Titanic crash is 1. This is true, as most women on board survived the incident (though shows the limitations of mean as a central statistic). Grouping data can also be multi-index where you can group data based on two or more categories.
## Group data by sex in titanic dataset
titanic_data.groupby(['Sex', 'Pclass']).mean()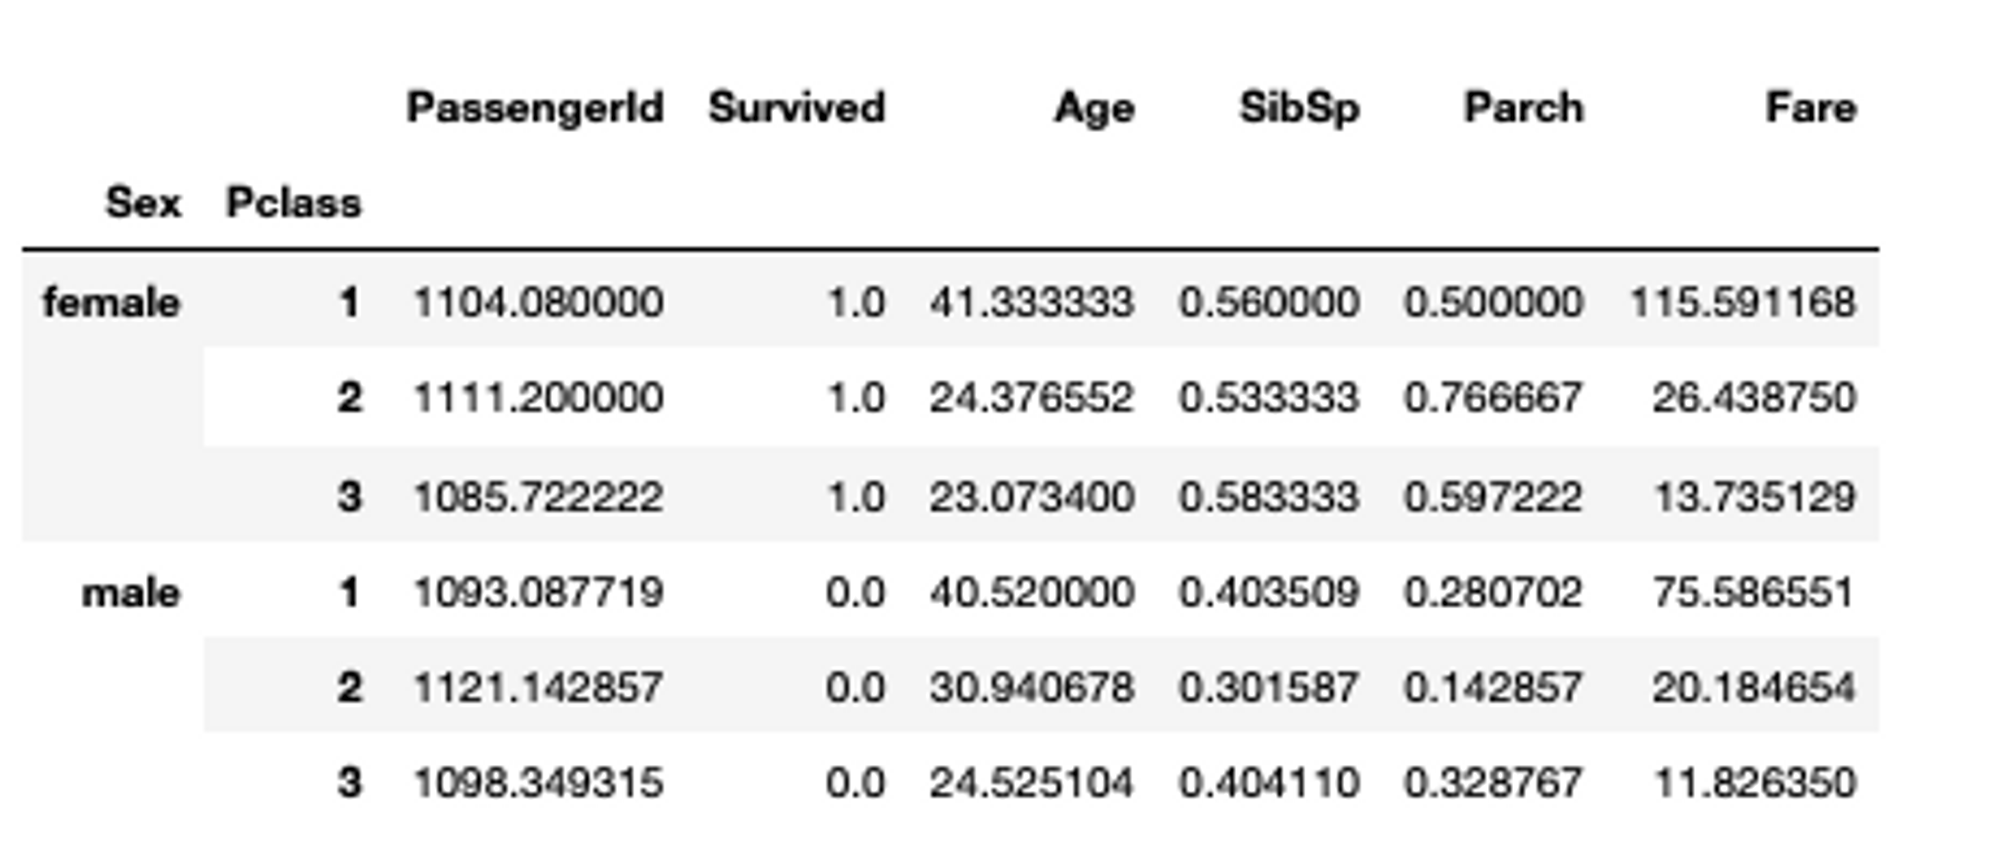
Pandas also provides you with the facility to create graphs and plots directly with the dataframe. For example, if you want to create a bar plot with the aggregated data, you can show it by calling the plot() method as follows:
# plot the distribution
titanic_data.groupby(['Sex']).mean().plot(kind='bar')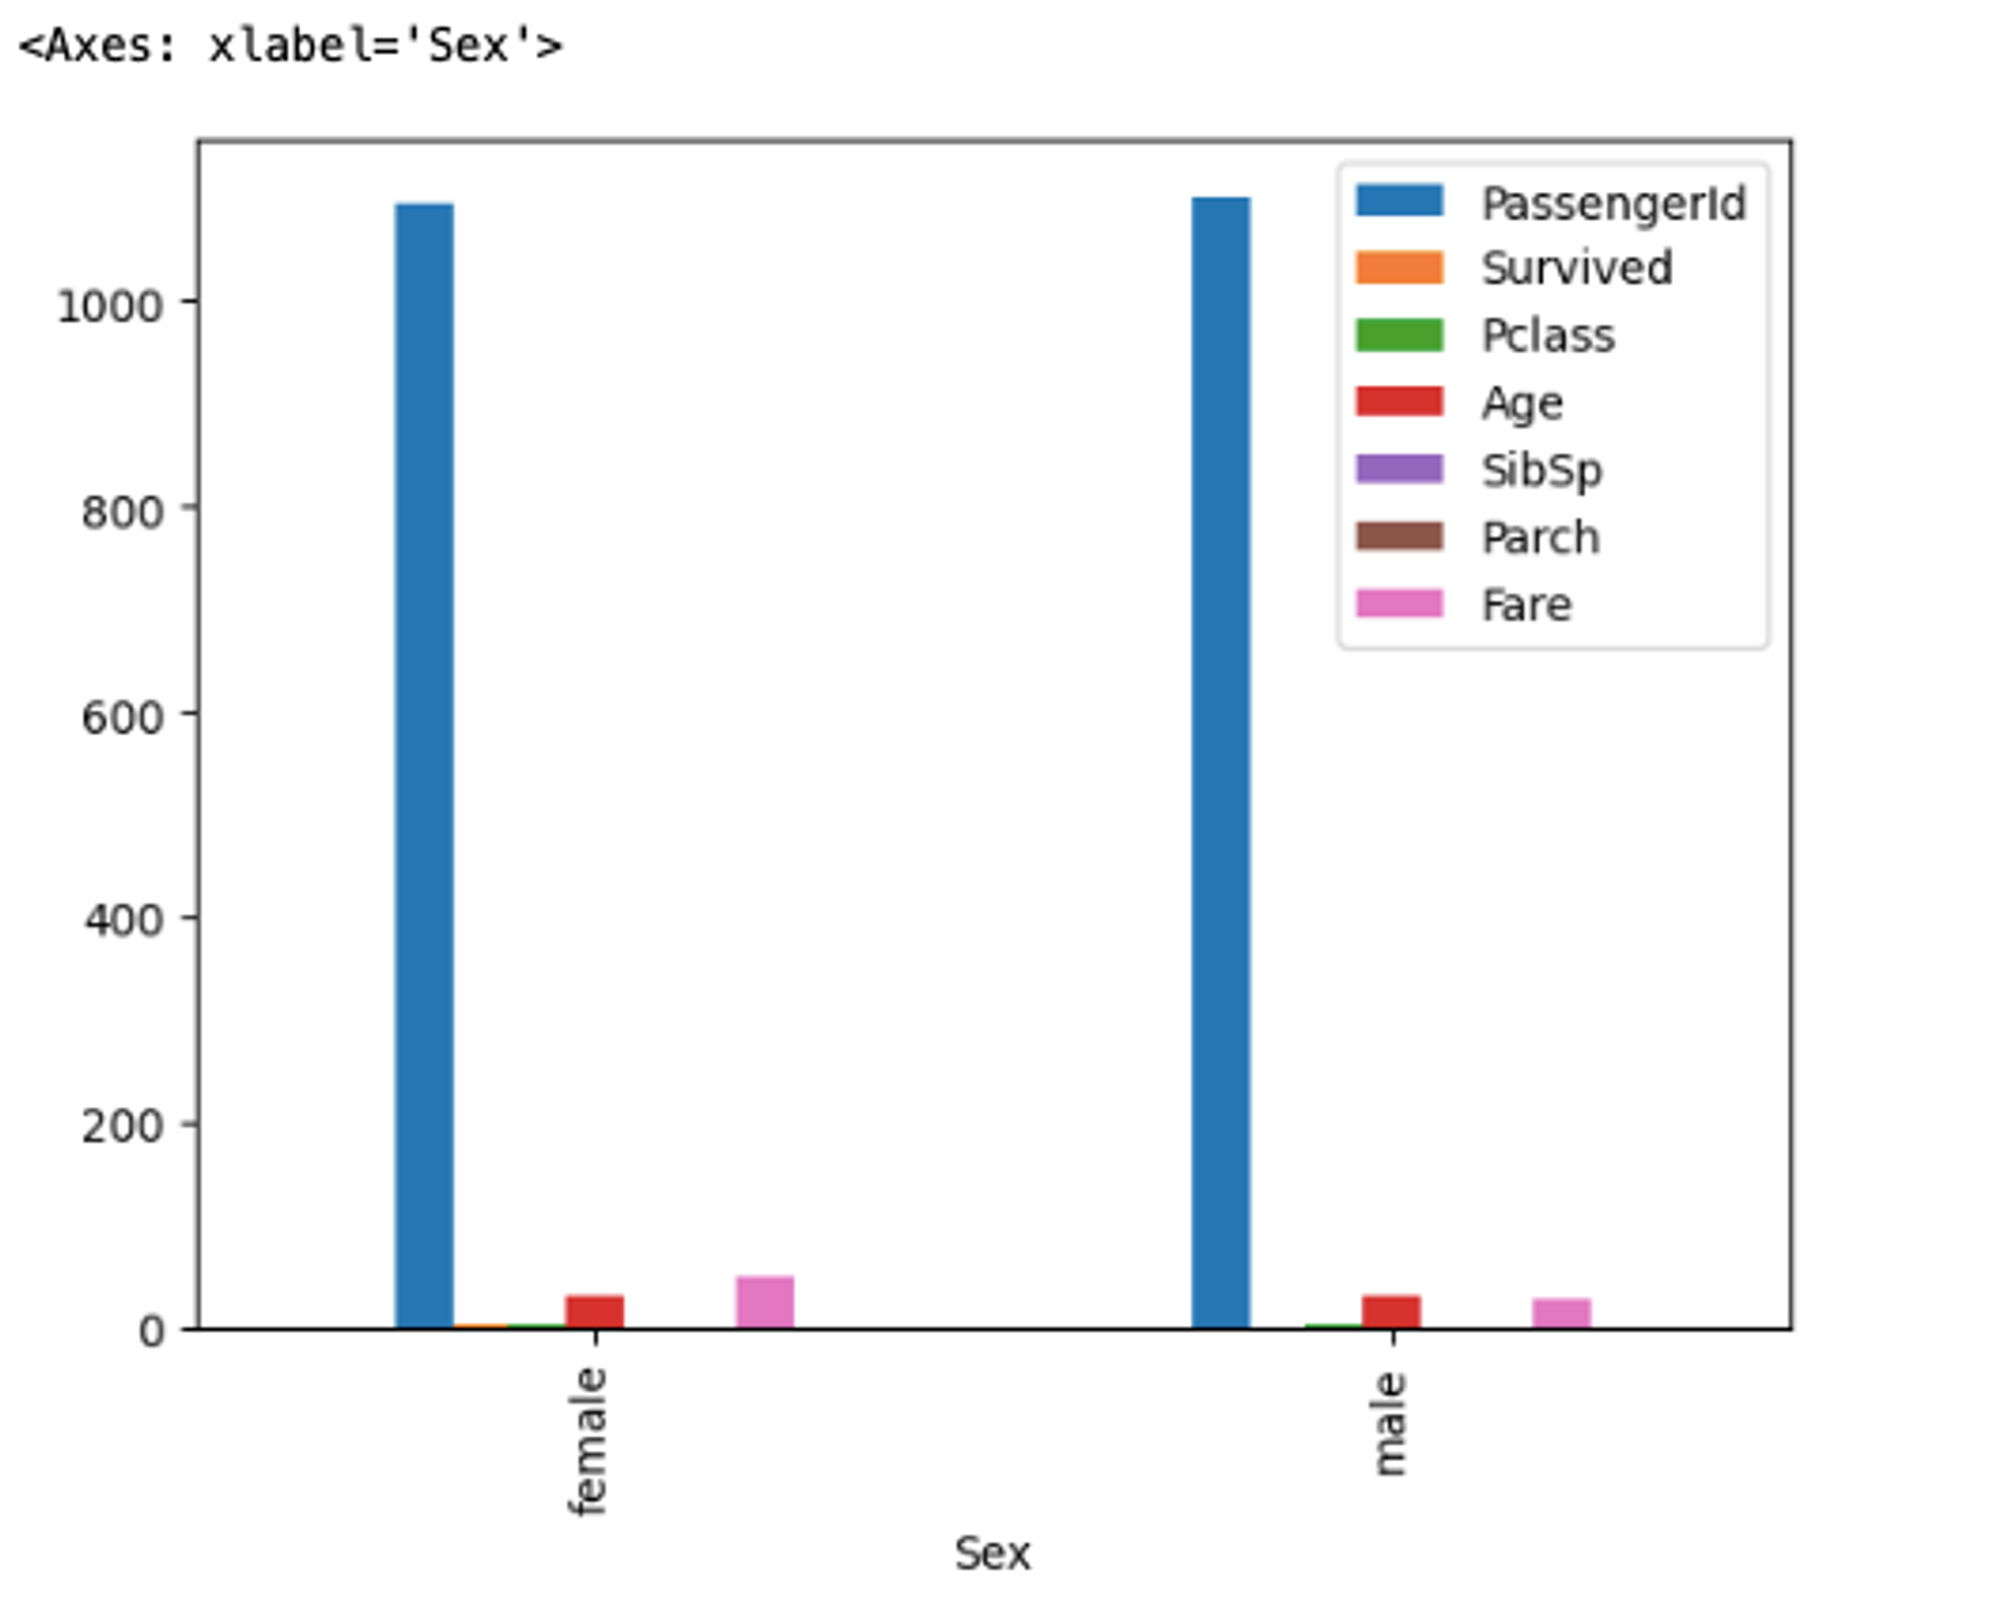
We’ll look more at visualizing data in Jupyter in a later article.
Conditional grouping is also possible using the loc[] function in Pandas. In the loc[] function, first provide the filtering condition and then provide the groupby conditions as follows:
# conditional groupby
titanic_data.loc[titanic_data['Age']>25, ['Pclass', 'Survived']].groupby(['Pclass', 'Survived'])['Survived'].count()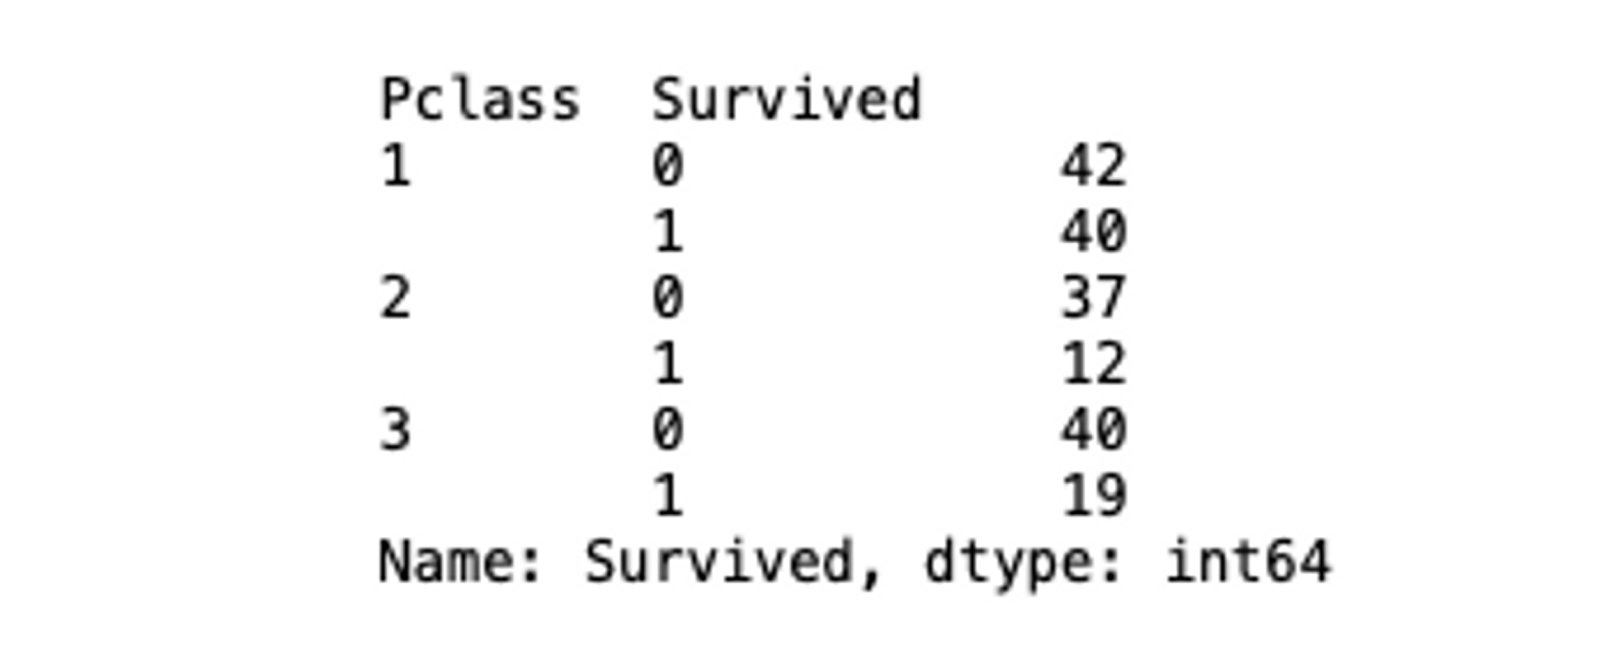
You can also use the aggregate functions eg. mean(), sum(), count()on different dataframe columns using the aggregate() method from Pandas.
# aggreagate data with aggregate function
titanic_data.aggregate(['count', 'mean'])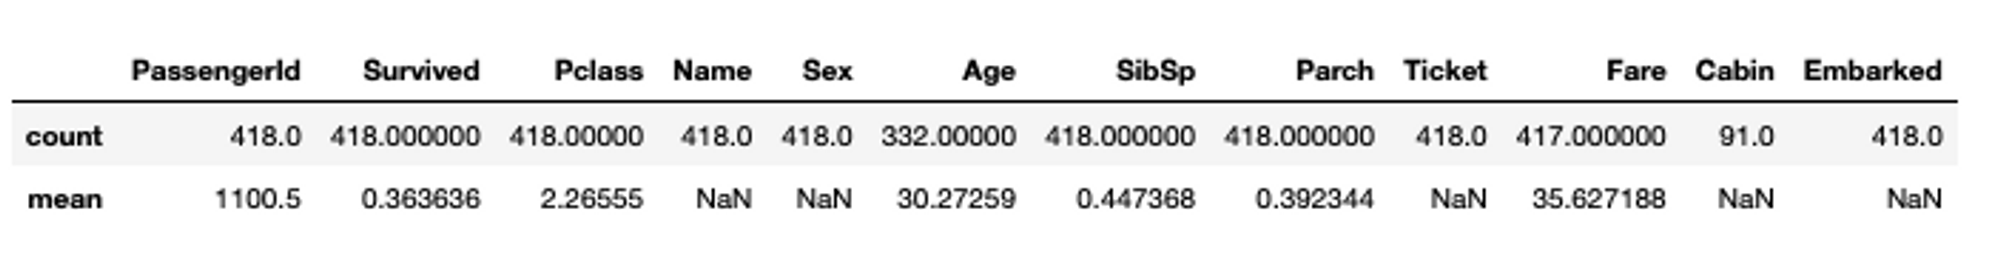
These aggregate functions as seen above can also be used in the grouping function.
# apply aggregate function with groupby
titanic_data.groupby(['Pclass', 'Survived'] )['Survived'].agg(["count", "mean"])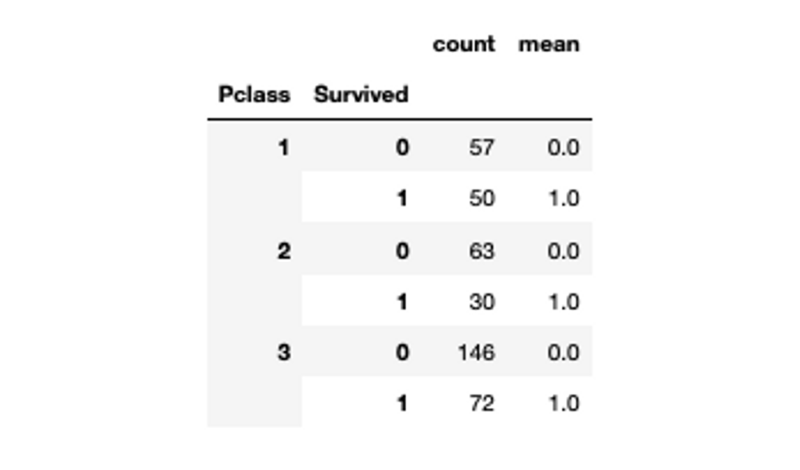
Data Cleaning and Preprocessing
Now come to the most important part of exploratory data analysis that helps shape your data for ML analysis. The real-world data is not always ideal and can not be used directly for ML analysis as it can contain NaN values, inaccurate data, duplicate values, or corrupted values. Pandas provides a lot of built-in functions to deal with these values.
Identifying Missing Values and Handling Them
The majority of machine learning and deep learning models can not deal with NaN values, so you need to handle them before passing your data to these models. Three normal approaches to handling these NaN values are:
- Predicting the NaN values based on the other features in the dataset.
- Dropping the NaN values from the dataset (not often recommended).
- Replacing the NaN values with the most appropriate values (often with the measure of central tendency).
Pandas provides the dropna() method to drop null values based on rows and columns. You might have noticed above that the Age, Fare, and Cabin columns contain the NaN values. To drop these values you can use the following code:
# drop NaN values based on columns
titanic_data_dropna = titanic_data.dropna(axis=1)titanic_data_dropna.info()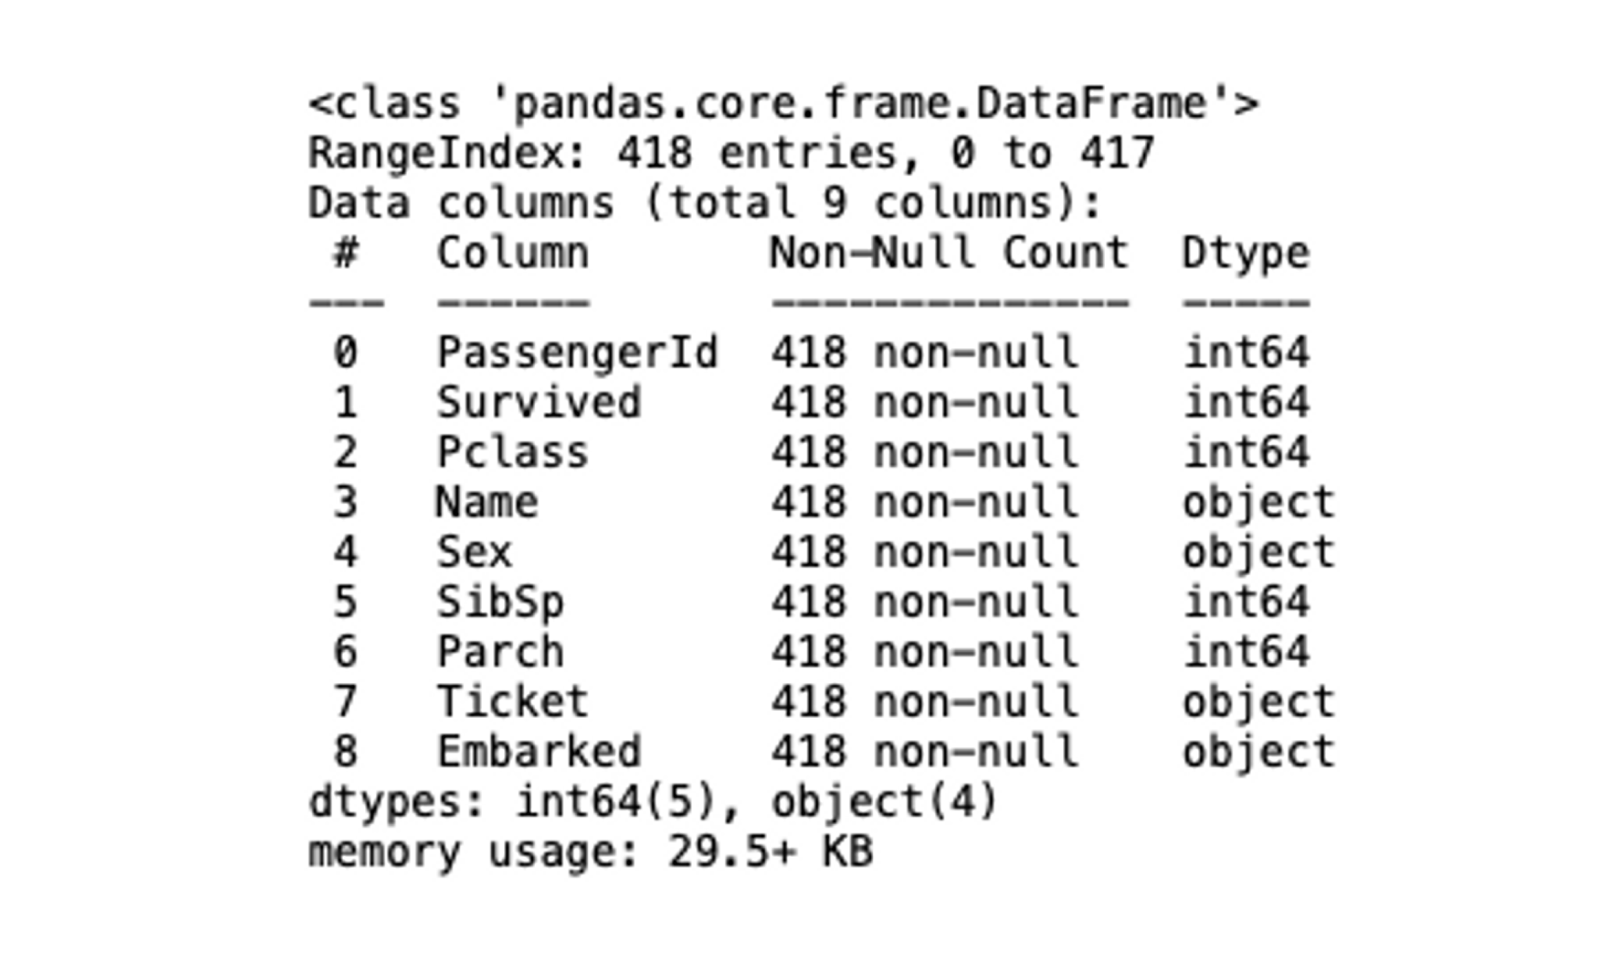
The axis argument controls the rows and columns features. When set to 0, the whole row is dropped from the data. On the other hand, if set to 1 the entire column containing any NaN value will be dropped from the dataset.
Another method provided by Pandas is fillna() that replaces the NaN values with the provided custom values. For example, if you want to replace the NaN values in the Age column with an average age in the dataset, you can do so as follows:
# create a copy of the dataset to test the fillna method
titanic_data_fillna = titanic_data.copy()

# replace NaN values with the average age
titanic_data_fillna['Age'].fillna(value=titanic_data_fillna['Age'].mean(),inplace=True)

# check the replaced NaN values
titanic_data_fillna.tail()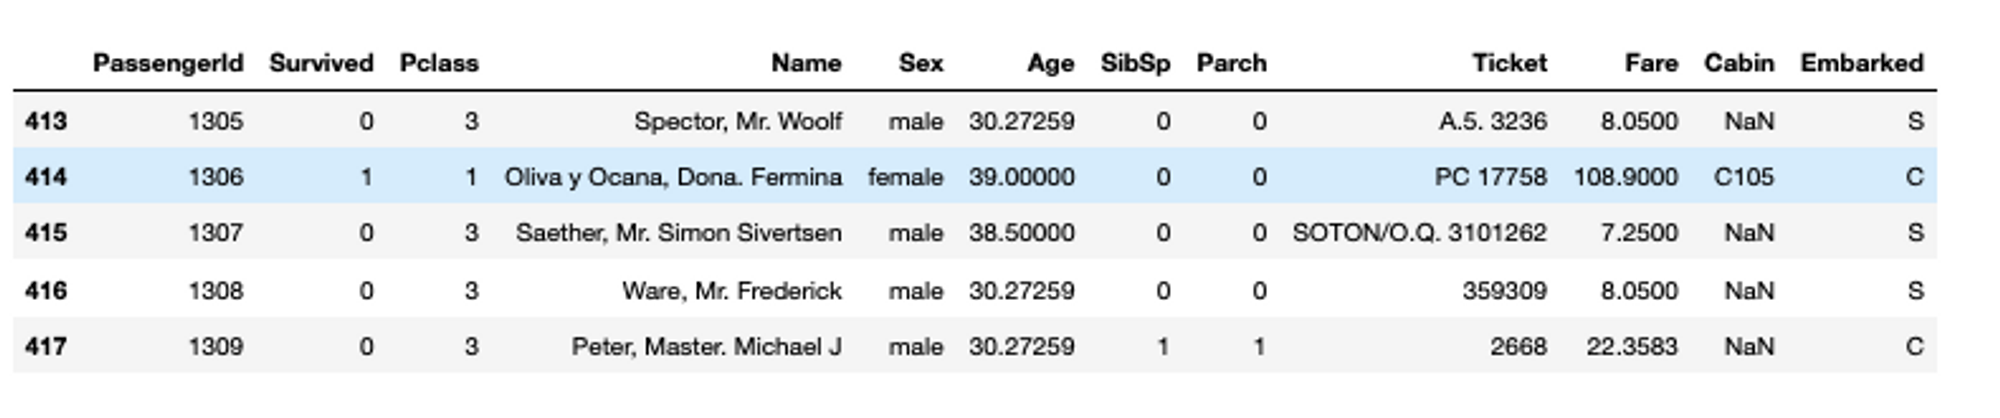
The inplace argument allows to make changes in the same dataframe instance.
Joining Different Datasets
Joining different datasets for different use cases is a very common need. You can use the Pandas concat() method to join different datasets based on rows and columns. This function just requires a list of dataframes and the axis parameter that determines the orientation of merge i.e. if 0 dataframes will be merged row-wise and if 1 dataframes will be merged column-wise. For example, let’s concat the titanic dataset with itself.
# join datasets
duplicate_data = pd.concat([titanic_data, titanic_data], axis=0)
duplicate_data.shape
Joining the dataframes of different dimensions with the concat() method can introduce unnecessary NaN values. To deal with this issue Pandas also provides a join() method that works exactly similar to SQL joins. The join method requires a how parameter that determines the type of join, such as inner or outer, and the on parameters tell which column will the join be based on. A simple example of joining two example dataframes may look like this:
# merge two datasets
df_1 = pd.DataFrame({
	"column_a": ["A", "B", "C", "D", "E"],
	"column_b": [10, 11, 12, 13, 14]},
	index=["1", "2", "3", "4", "5"]
)
df_2 = pd.DataFrame({
	"column_a": ["A", "B", "E"],
	"column_c": [100, 101, 104]},
	index=["1", "2", "3"]
)

# inner join dataframes based on column_a
pd.merge(df_1, df_2, on='column_a', how='inner')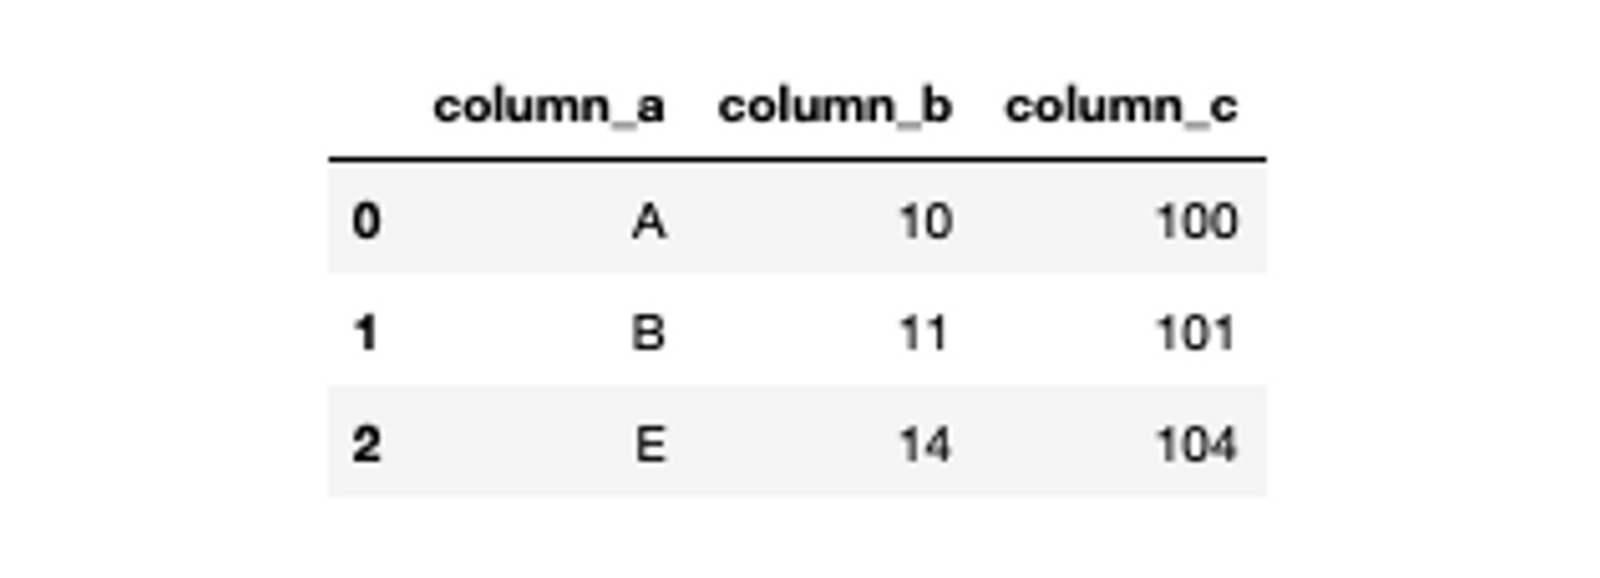
You can learn more about Pandas concat and join functions from the docs.
Handling Duplicate Data
When your dataset contains duplicate rows, you can delete them from the data using the drop_duplicate() method from Pandas.
# drop duplicated from data
duplicate_data.drop_duplicates(inplace=True, ignore_index=True)
duplicate_data.shape
The ignore_index parameter helps you reindex your dataframe while inplace indicates that you are making and saving the changes in the same dataframe.
Data Type Conversion
Sometimes saving the data in files like CSV can lose the original datatypes. For example, saving the float parameter could be saved as int. You can change these datatypes with the help of Pandas astype() method. For example, you can convert the float values of the Age column to the int as follows:
# convert column data types
titanic_data_fillna['Age'] = titanic_data_fillna['Age'].astype(int)
titanic_data_fillna.head()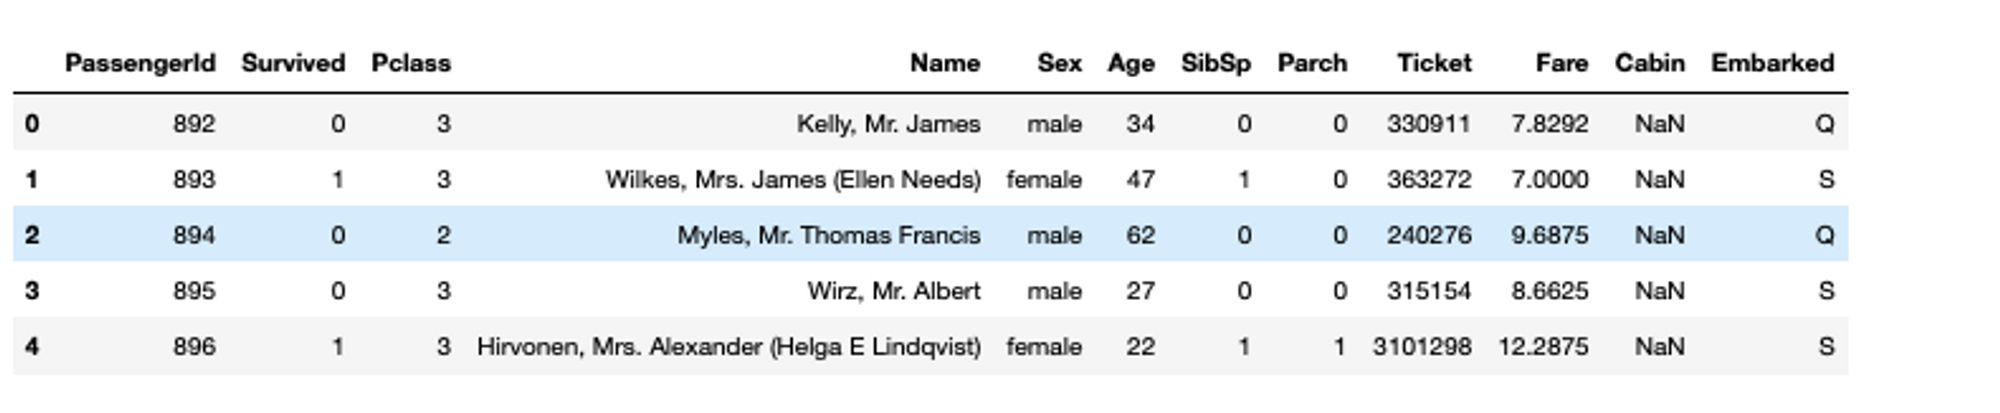
Pivot Tables and Cross-Tabulation
Creating Pivot Tables for Summarizing Data
Pandas also provides the pivot_table method to create a spreadsheet-style pivot table for easy data lookup. This method produces an aggregated multi-index pivot table. For example, you can create a pivot table for titanic data with Age and Sex as index and sum as the aggregator function as follows:
# import numpy library that has implementation to multiple aggregators
import numpy as np

# generate pivot table
pd.pivot_table(titanic_data, index = ["Sex","Age"], aggfunc=np.sum)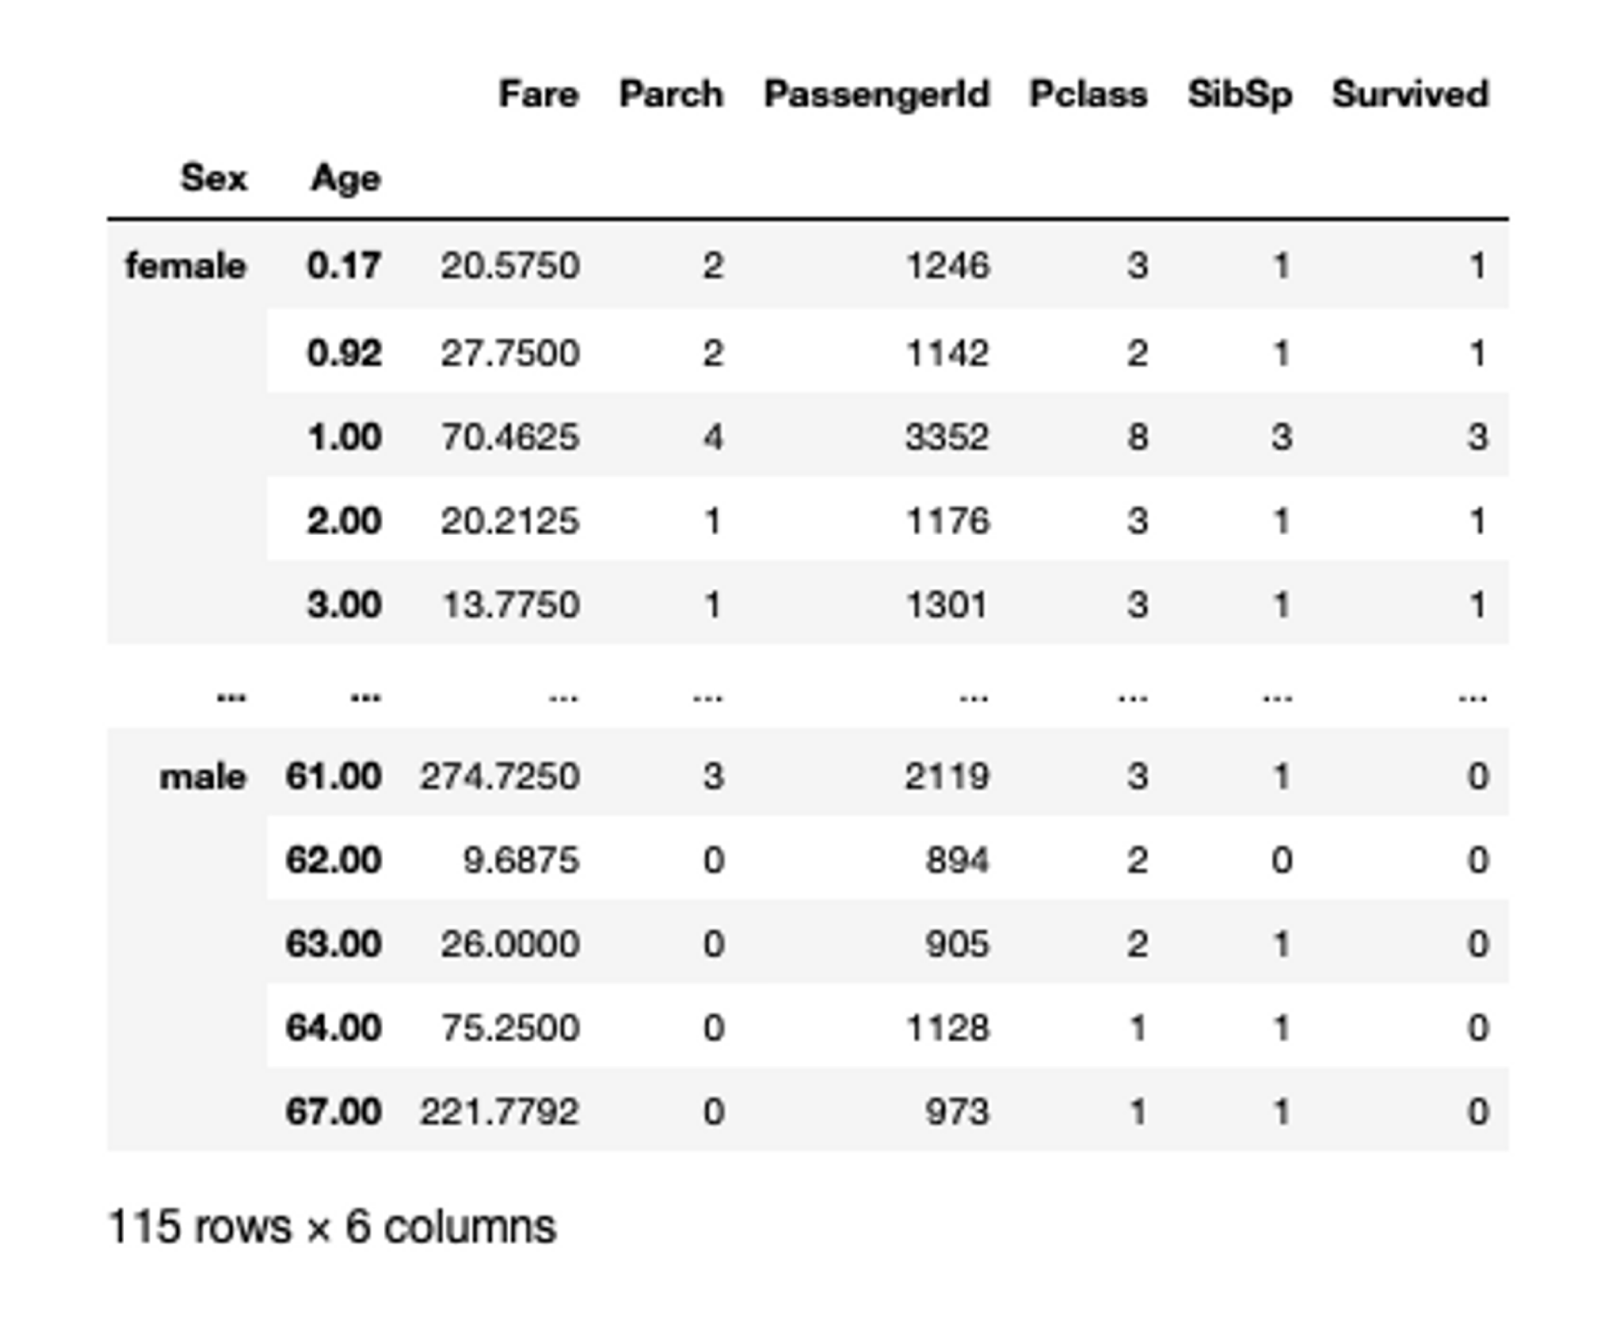
You can know about different arguments and features of pivot_table here.
Explore Relationships Between Variables
You can also create a simple cross-tabulation of two or more features in the dataframe using the crosstab() method. A frequency table of the factors is computed by default unless an array of values and an aggregation function are given. A simple crosstab between, Sex and Survived features of titanic data may look like this:
# pandas crosstab
pd.crosstab(titanic_data['Sex'],  titanic_data['Survived'])
This crosstab can be calculated among multiple columns as well. To know more about crosstab in detail, refer to this official page. And, the consolidated Jupyter-Notebook for this tutorial can be found here.
Data Exploration With Jupyter
Jupyter is an extremely powerful tool when it comes to exploring data for machine learning and data science. Combined with the Pandas library in Python, you can explore pretty much any data using multiple functions from a variety of data sources such as CSV, Excel, or databases.
From here, you can go on to visualize your data for more insight, and share your data with colleagues for greater collaboration to uncover patterns, trends, and relationships that will drive informed decision-making based on data.
Want to learn more about Jupyter notebooks?
Here are some of our other articles:


