Blog
How to Share Jupyter Notebooks
Learn how to share Jupyter notebooks with technical and non-technical audiences.

How you share a Jupyter notebook depends on the Why and the Whom:
- Why are you sharing this? Is it just for quick feedback? Are you collaborating on the entire notebook with others? Is it just to present the findings?
- With whom are you sharing it? Is it other analysts on your team? Other analysts not on your team. People not in your organization? Executives or other non-technical audiences?
Based on these two requirements, there are several ways of sharing the Jupyter notebooks for different reasons with different technical and non-technical audiences.
Sharing IPYNB Files
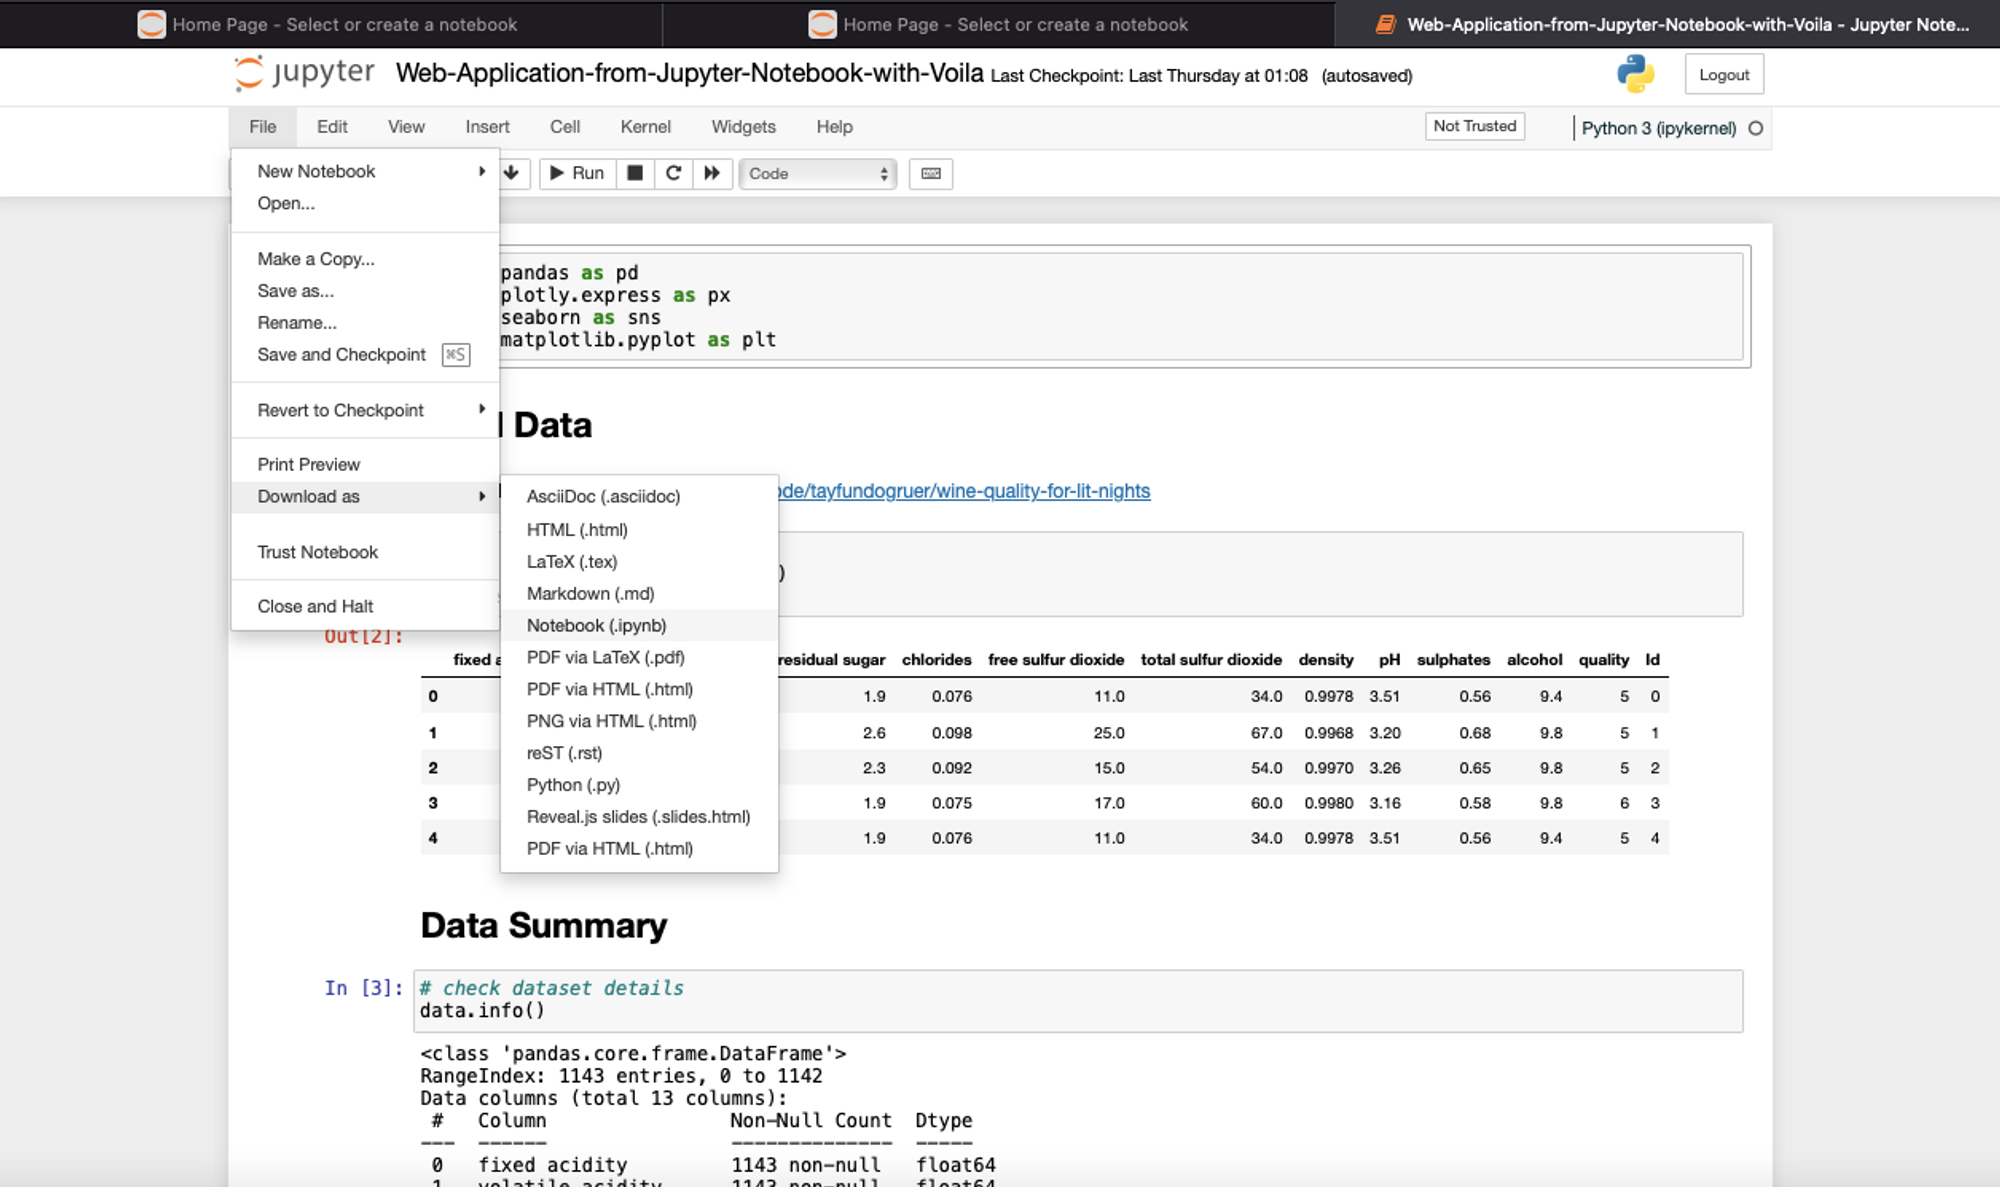
When you start a Jupyter notebook in your system, it usually runs on your localhost meaning it can only be accessible on your machine. If you want to share this notebook with others for development, you usually share the .ipynb file which is the editable format. You need to click on the File > Download as > Notebook (.ipynb) option in your Jupyter to download the notebook in editable format. As Jupyter runs on your localhost, you can not necessarily share the link with others to work on the same instance.
Downloading the .ipynb file does not include any of your assets such as datasets, config files (to read credentials and other configurations), or the dependencies. You need to send these resources explicitly to others so that they can install all the required dependencies and create the same environment setup as yours to reproduce your work.
Note: Make sure that the sending and receiving parties of Jupyter notebooks have the same environment setup, A slight change in a library version can also cause issues to reproduce the same results on two different systems.
Although ipynb files take some time to set they are one of the best options when sharing the notebooks for development.
Sharing these ipynb notebooks with the non-technical audience is still fine as they can easily traverse through different sections of it to get insights. But if they require some changes in the analysis code, or they want some new visualization scheme, you need to make the change, re-run the notebook cells, export it again to ipynb, and reshare it which is quite the repetitive work with a never-ending loop.
Converting Jupyter Notebooks to Static Formats (PDF, HTML)
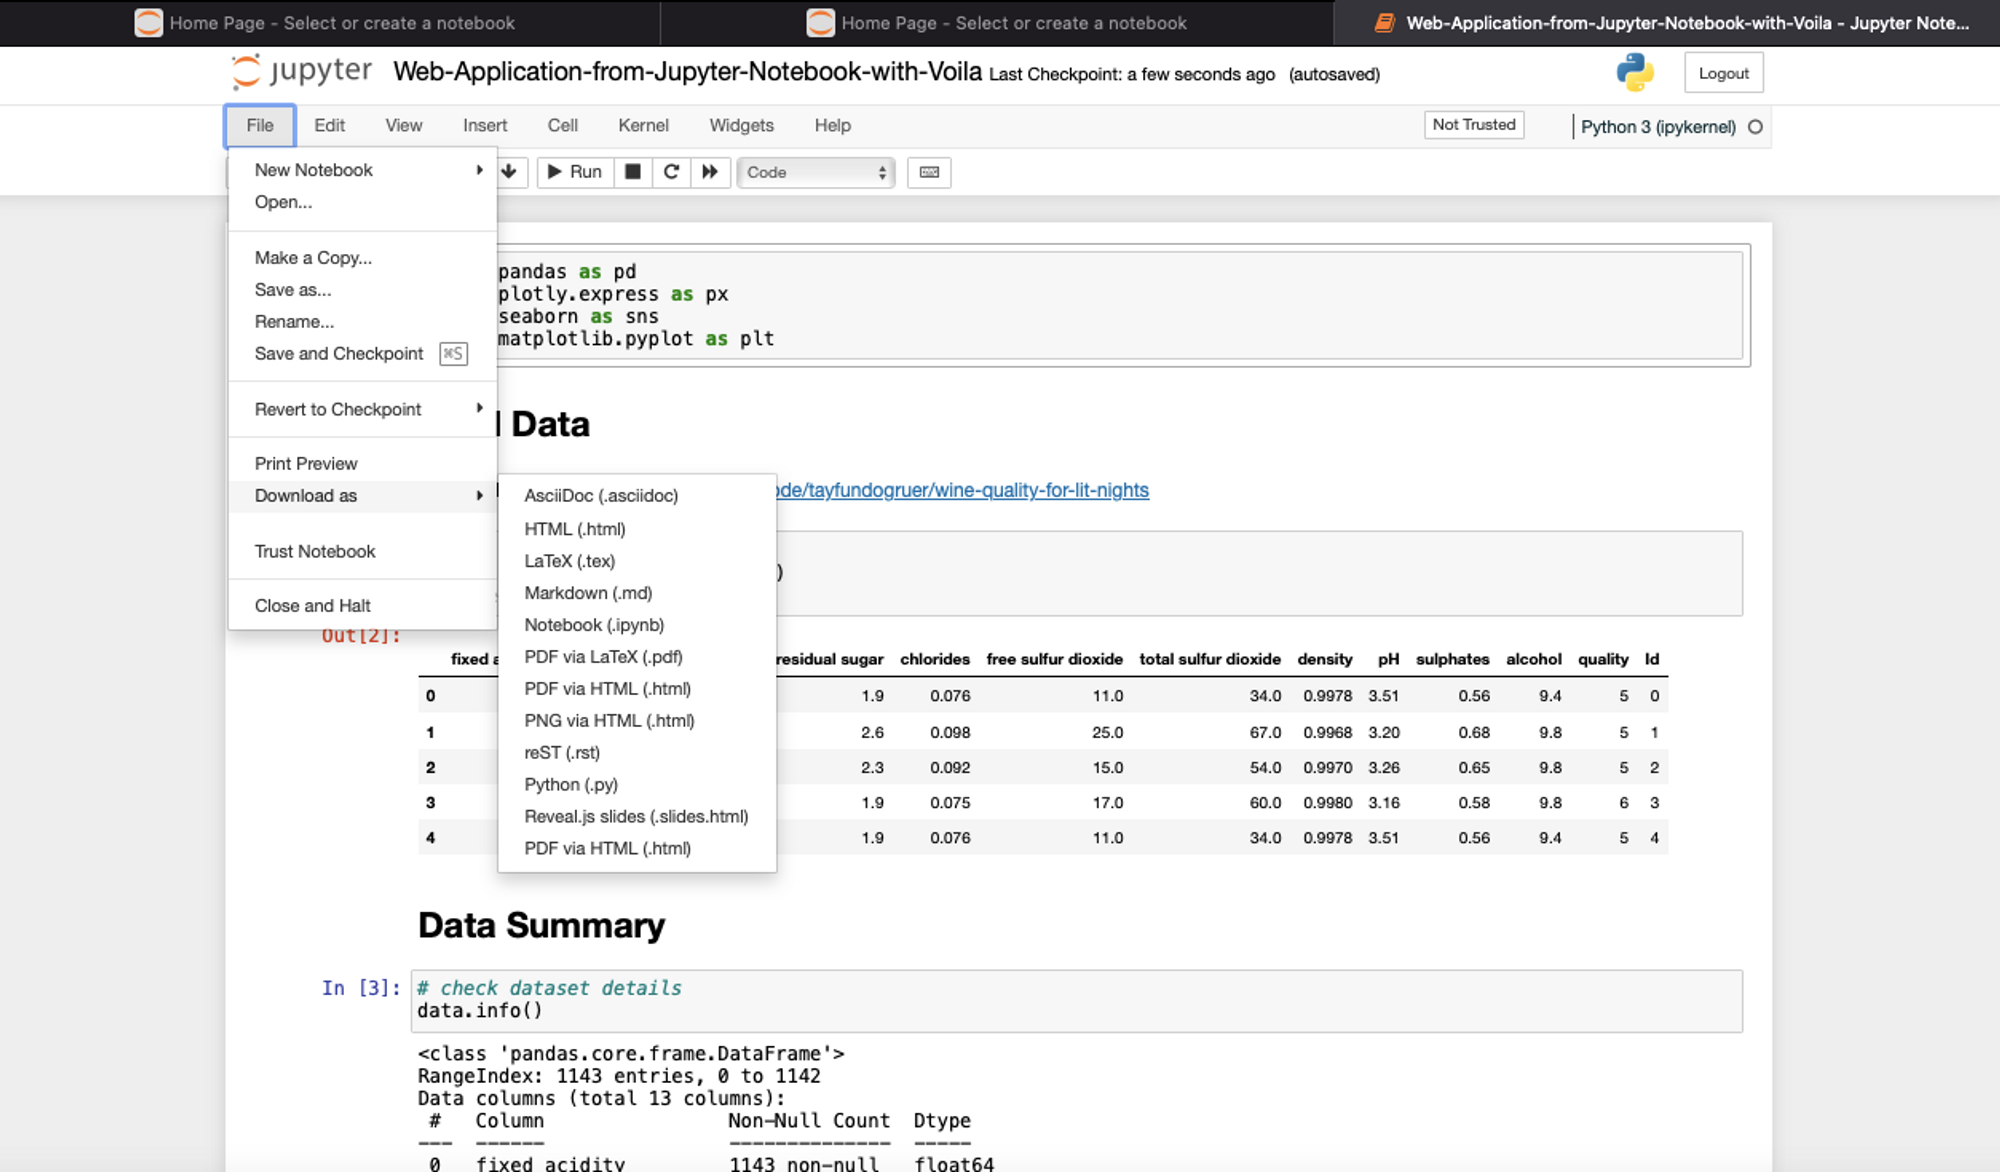
When sharing the Jupyter notebooks with a non-technical audience that is not interested in running the notebooks and just want to view the information inside it, you can covert the notebooks to static file formats like PDF, HTML, Markdown, and LaTeX. With these static file formats, options such as reproducibility, collaboration, and interactivity are not possible as these files can only be viewed. To convert the Jupyter notebook to any of these formats, you need to click on the File > Download as option and select one of the given file formats.
You can also use a Python dependency nbconvert to convert notebooks to one of these formats. It can be installed with Python Package Manager (PIP) as follows:
$ pip install nbconvert
Once installed, you can open a terminal in the Jupyter instance and run the following command to convert your notebook to HTML format:
$ jupyter nbconvert --to html /content/your_notebook.ipynb
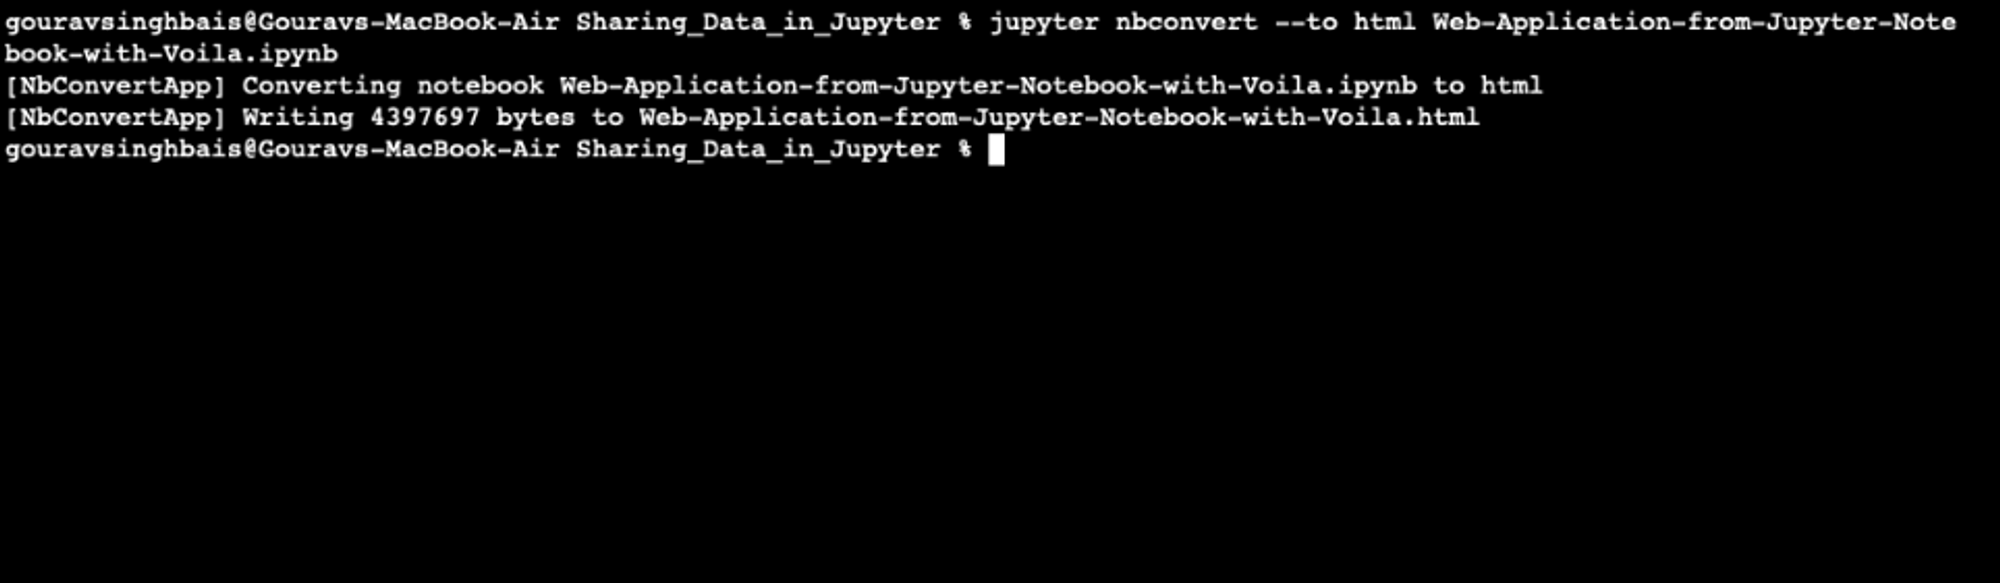
Note: You can use nbconvert to produce other mentioned static file types as well.
As far as static notebooks are concerned, there is one platform called NbViewer which helps you to render your Jupyter notebooks by sharing the link of your Jupyter notebook where it is stored for example GitHub. Back in 2015, when Github did not support notebook rendering, this platform helped customers and stakeholders a lot to have a quick look at the notebooks to gain insights.
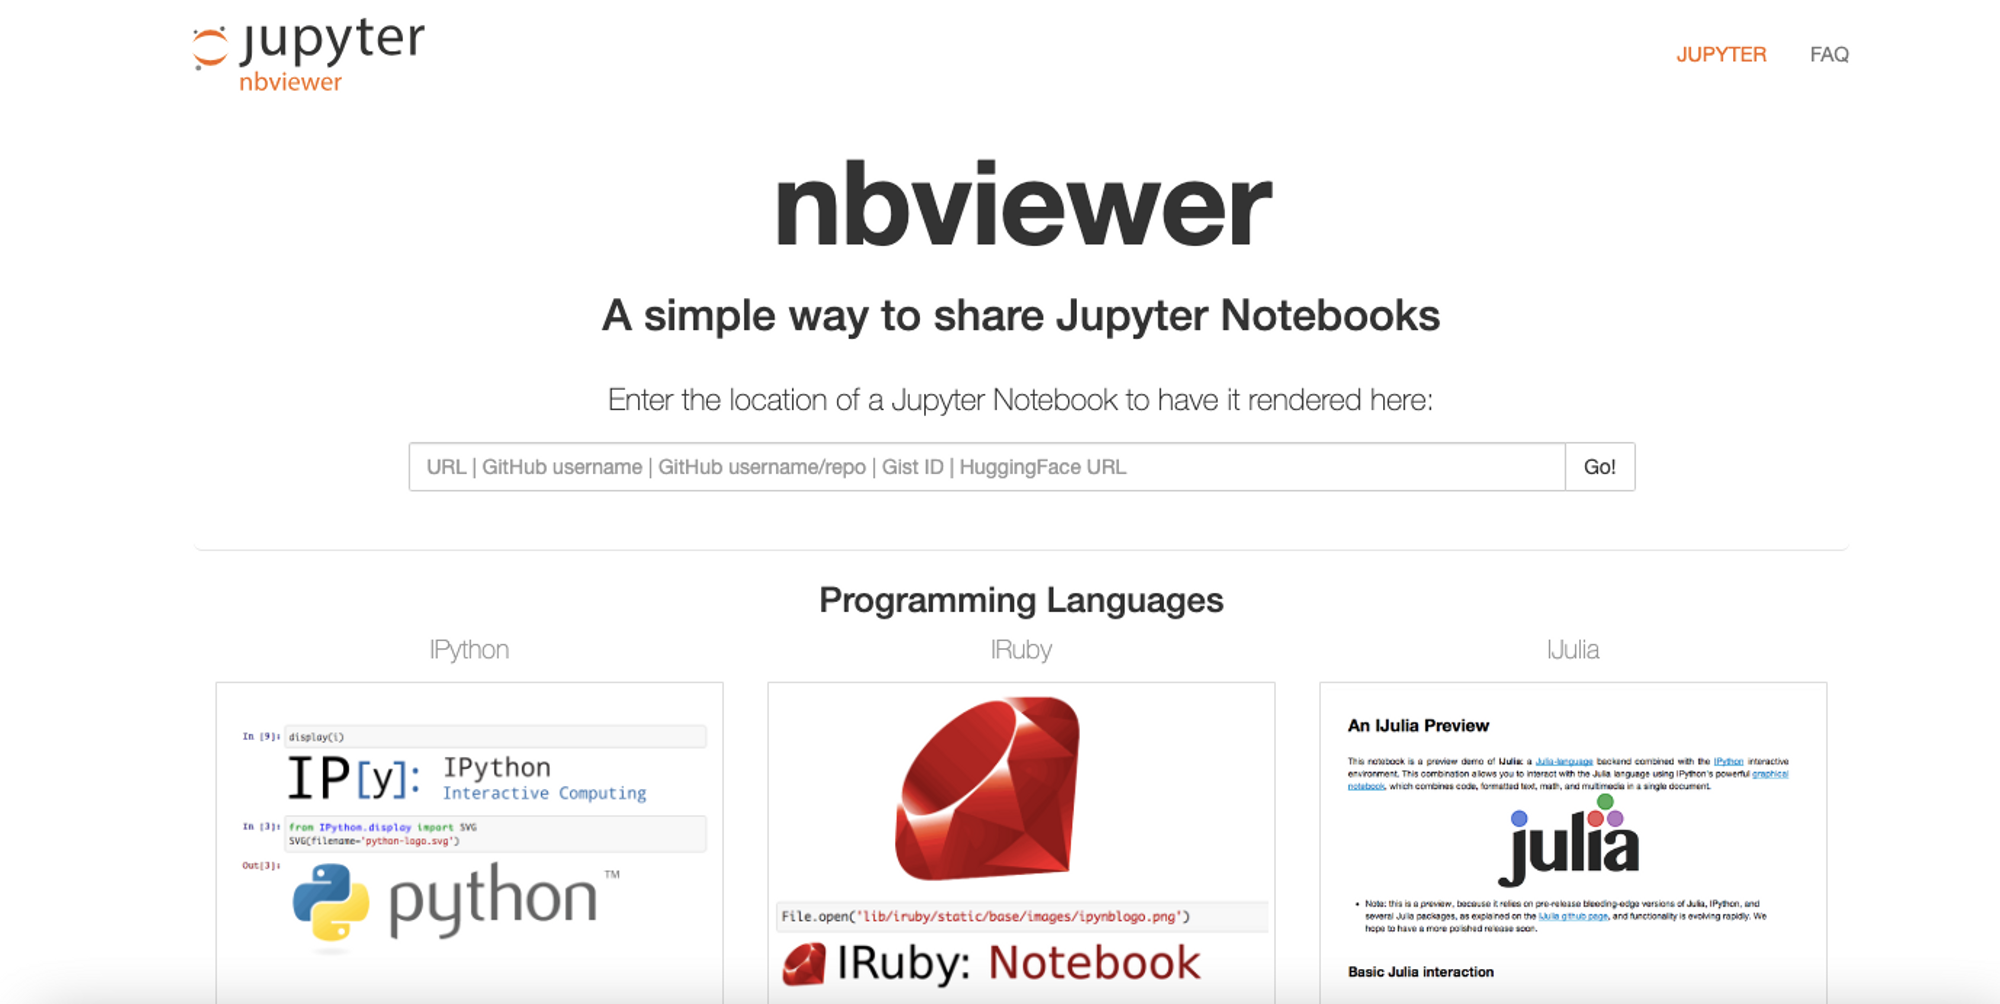
In 2015, Github also started supporting notebook rendering to complement NbViewer which made it easier for GitHub users to create, view, and share notebooks on GitHub. Now, along with the version control and collaboration capabilities, Github is one of the most used tools for sharing the .ipynb and static notebook files.
Using Binder or JupyterHub for Collaborative Work
Tools like Nbviewer, and Github only support the view option for Jupyter notebooks. If you want to have full control over the notebooks for development, you can use a tool like Binder. The Binder tool provides a shared execution environment that aims to improve the reproducibility of your code by others. Just provide the URL of your repository containing notebooks, and it will create an environment for your development.
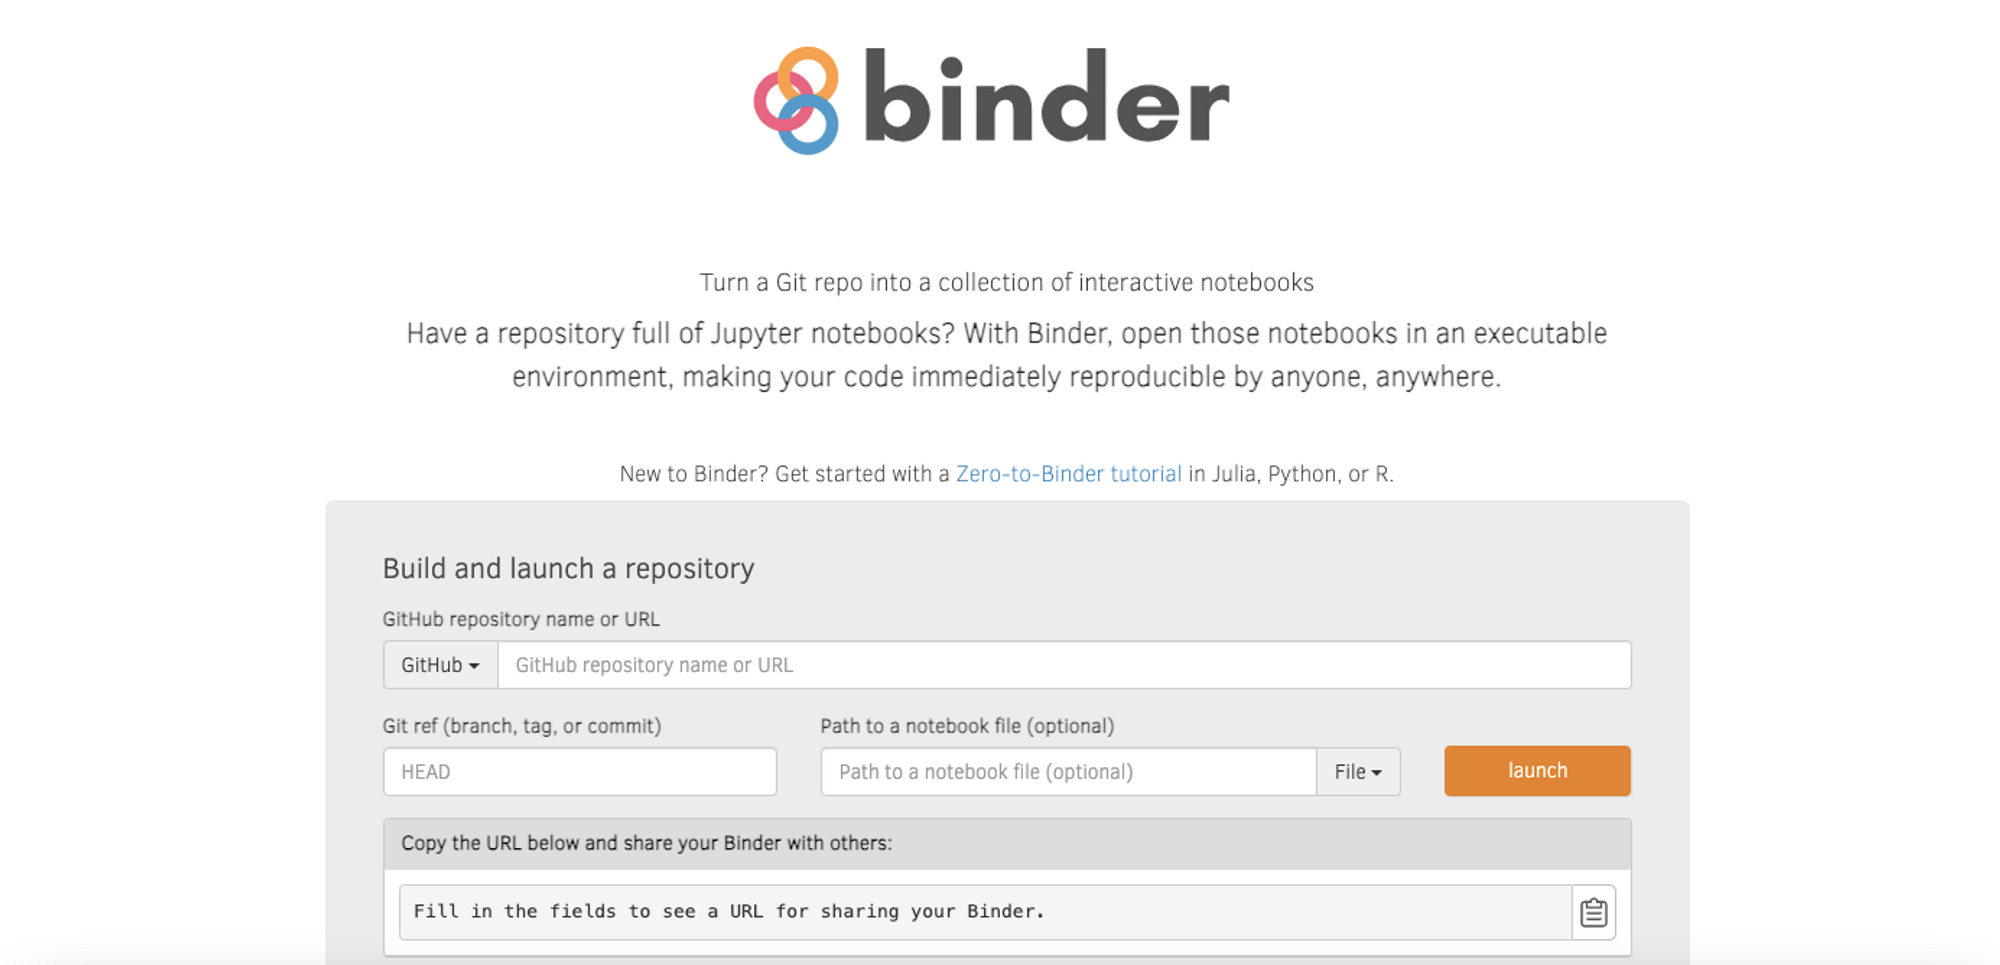
The problem with Binder is that it runs your notebooks in an isolated environment. So, once you close your session, all the changes that you have made in notebooks are lost until you download them locally. To be precise, this tool is good for quickly reproducing a notebook but sharing and collaboration still lacking.
Another tool that comes with easy sharing, interactivity, and collaboration is JupyterHub. JupyterHub is a server-hosted distributed Jupyter notebook environment that allows users to access computational resources without having to worry about installation and maintenance tasks. It manages your Jupyter environments to serve different users at the same time. It can be deployed on the Kubernetes in your organization to serve a large number of users.

With Jupyterhub, users can save the Jupyter notebooks and the related data and files in a centralized location so that they can be accessed across systems. This enables quick development, notebook interactivity, collaboration, and, most importantly, shareability. Although JupyterHub looks like an ideal tool for sharing the Jupyter notebooks and data it comes with the added complexity of managing our own Jupyter notebook servers.
Finally, there are a lot of cloud-based tools that help you share and run Jupyter notebooks across systems. One example is Google Colab, which provides the computation capabilities to run your notebooks. The only thing is, this computation environment is not sharable among different users i.e. two users can not work on the same notebook at the same time. But, you can still view, run, and render different notebooks with it.
Creating Interactive Dashboards with Voila
When sharing analysis results with non-technical stakeholders, you want to use interactive charts, plots, and dashboards that can easily convey the data. There are different tools to create these deliverables, but voila is the most common. Voila is a Jupyter extension that helps you create interactive visualizations and dashboards by turning your Jupyter notebooks into interactive web applications.
You can use different visualization libraries in Python like Matplotlib, Plotly, and Seaborn to create different charts and plots in your notebooks and Voila converts these notebooks to the interactive HTML where only the output of the notebook is shown not the input part.
To create interactive dashboards using Voila, you need to first install the voila library with the help of PIP as follows:
$ pip install voilaFor this section, we will use the wine quality classification dataset from Kaggle. Let’s begin with importing the necessary libraries for loading the data and visualization.
# data loading dependency
import pandas as pd
# visualization dependencies
import plotly.express as px
import seaborn as sns
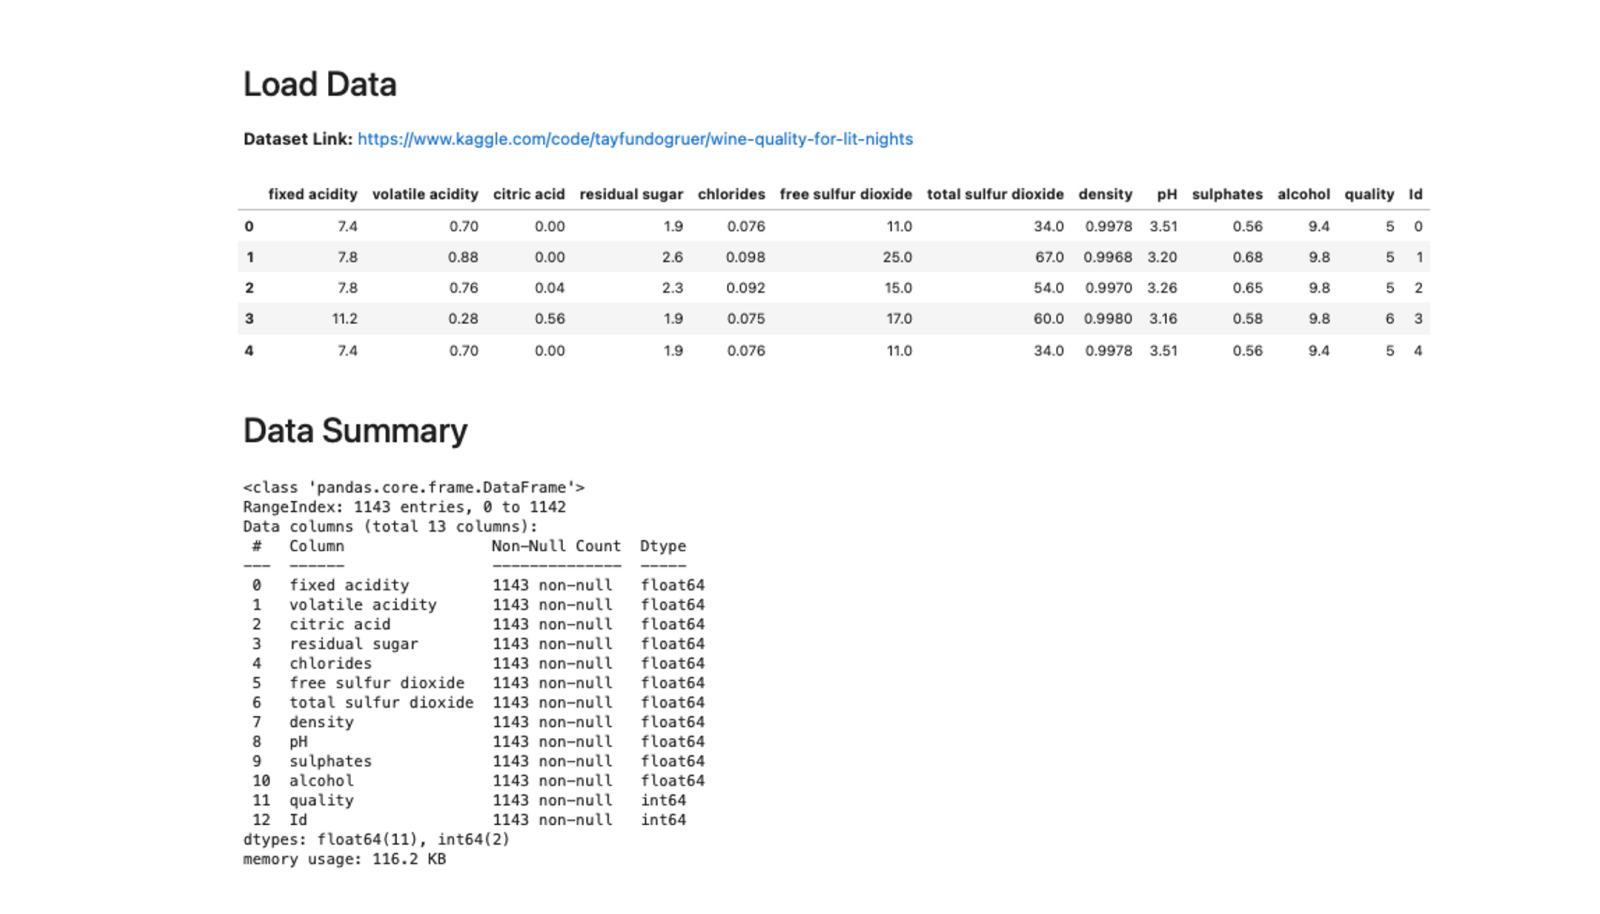
import matplotlib.pyplot as pltOnce imported, you can load the dataset with the help of the read_csv() method from pandas.
# load data
data = pd.read_csv('WineQT.csv')data.head()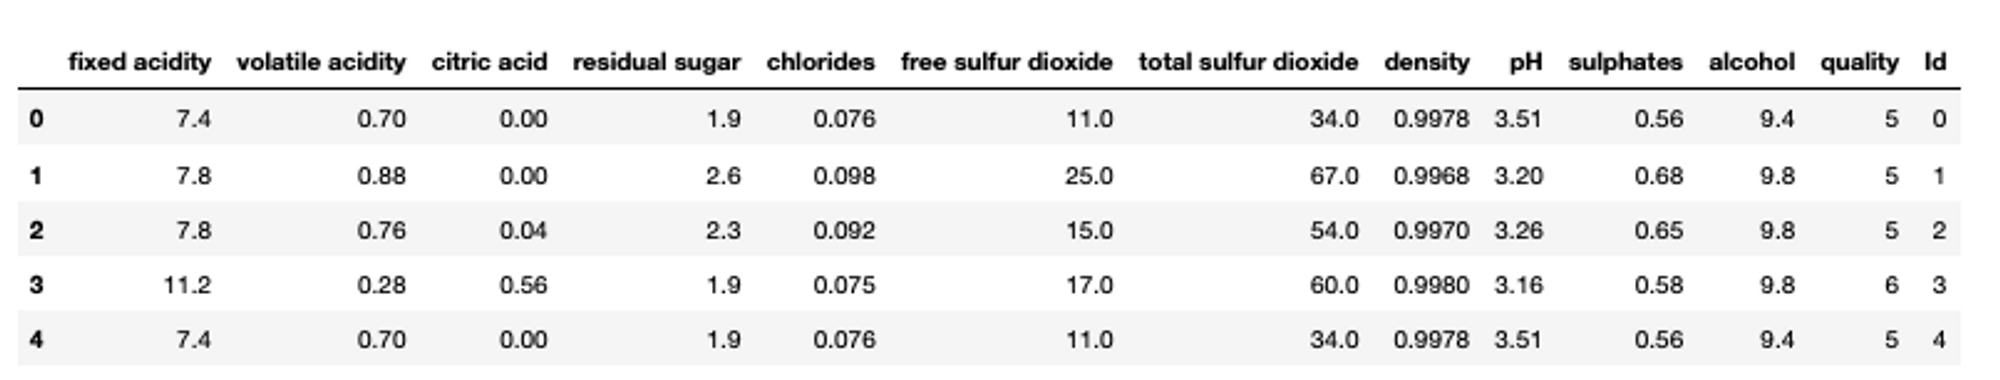
To see some basic information about the dataset, you can use the info() method:
# check dataset details
data.info()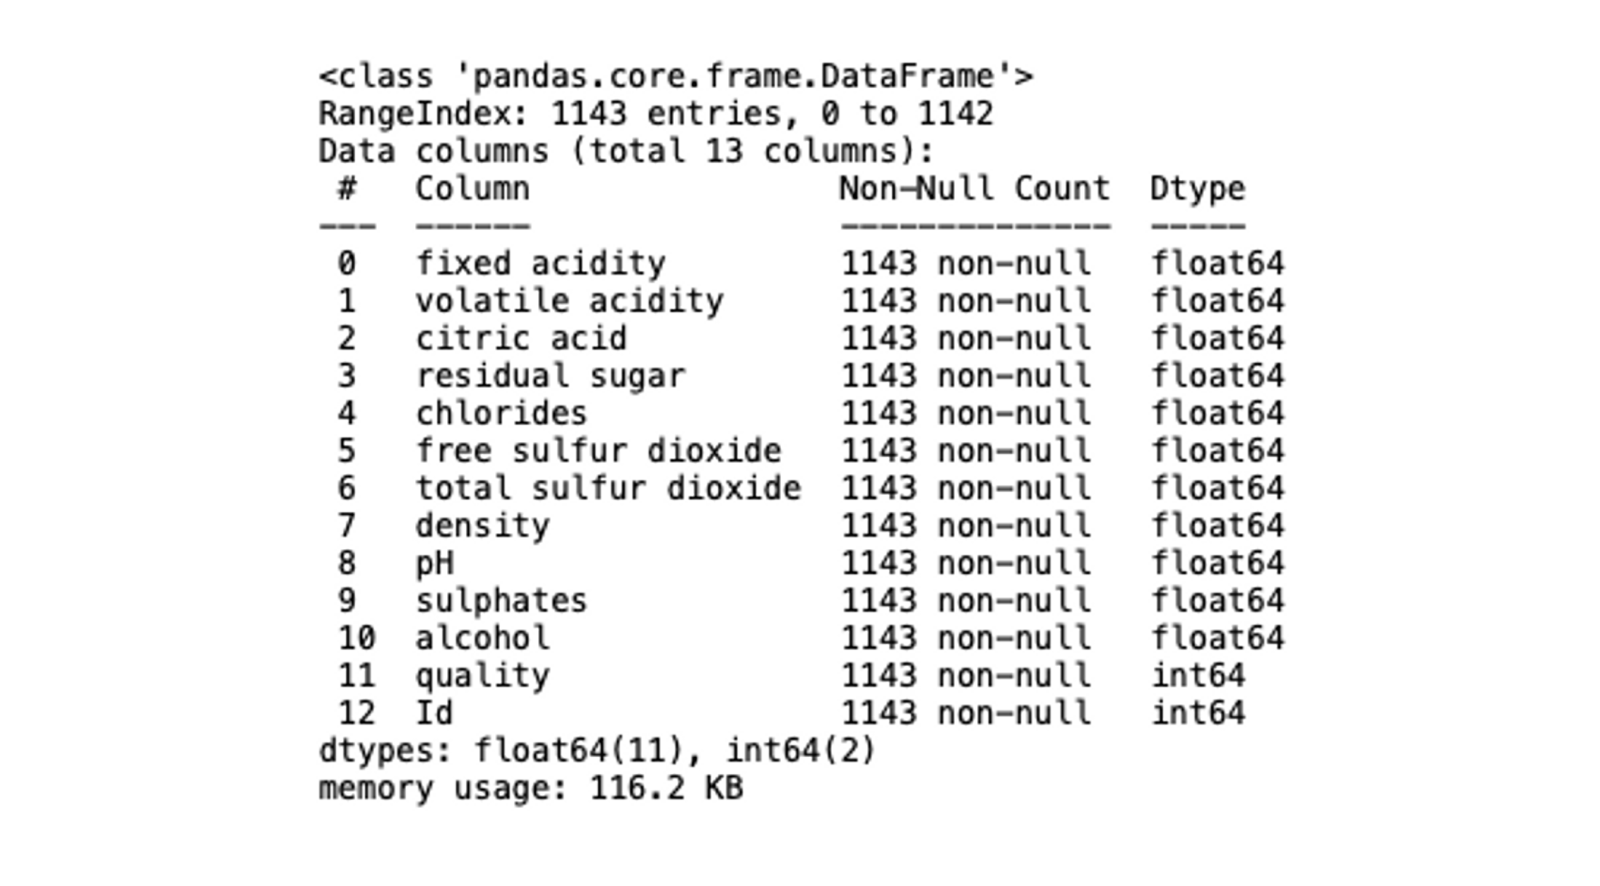
Now, let’s start with creating some simple visualizations to explore the data. First, to know about the impact of the amount of alcohol on the wine quality we can plot a scatter plot using the scatter() method form plotly as follows:
# scatter plot
px.scatter(data, x="quality", y="alcohol")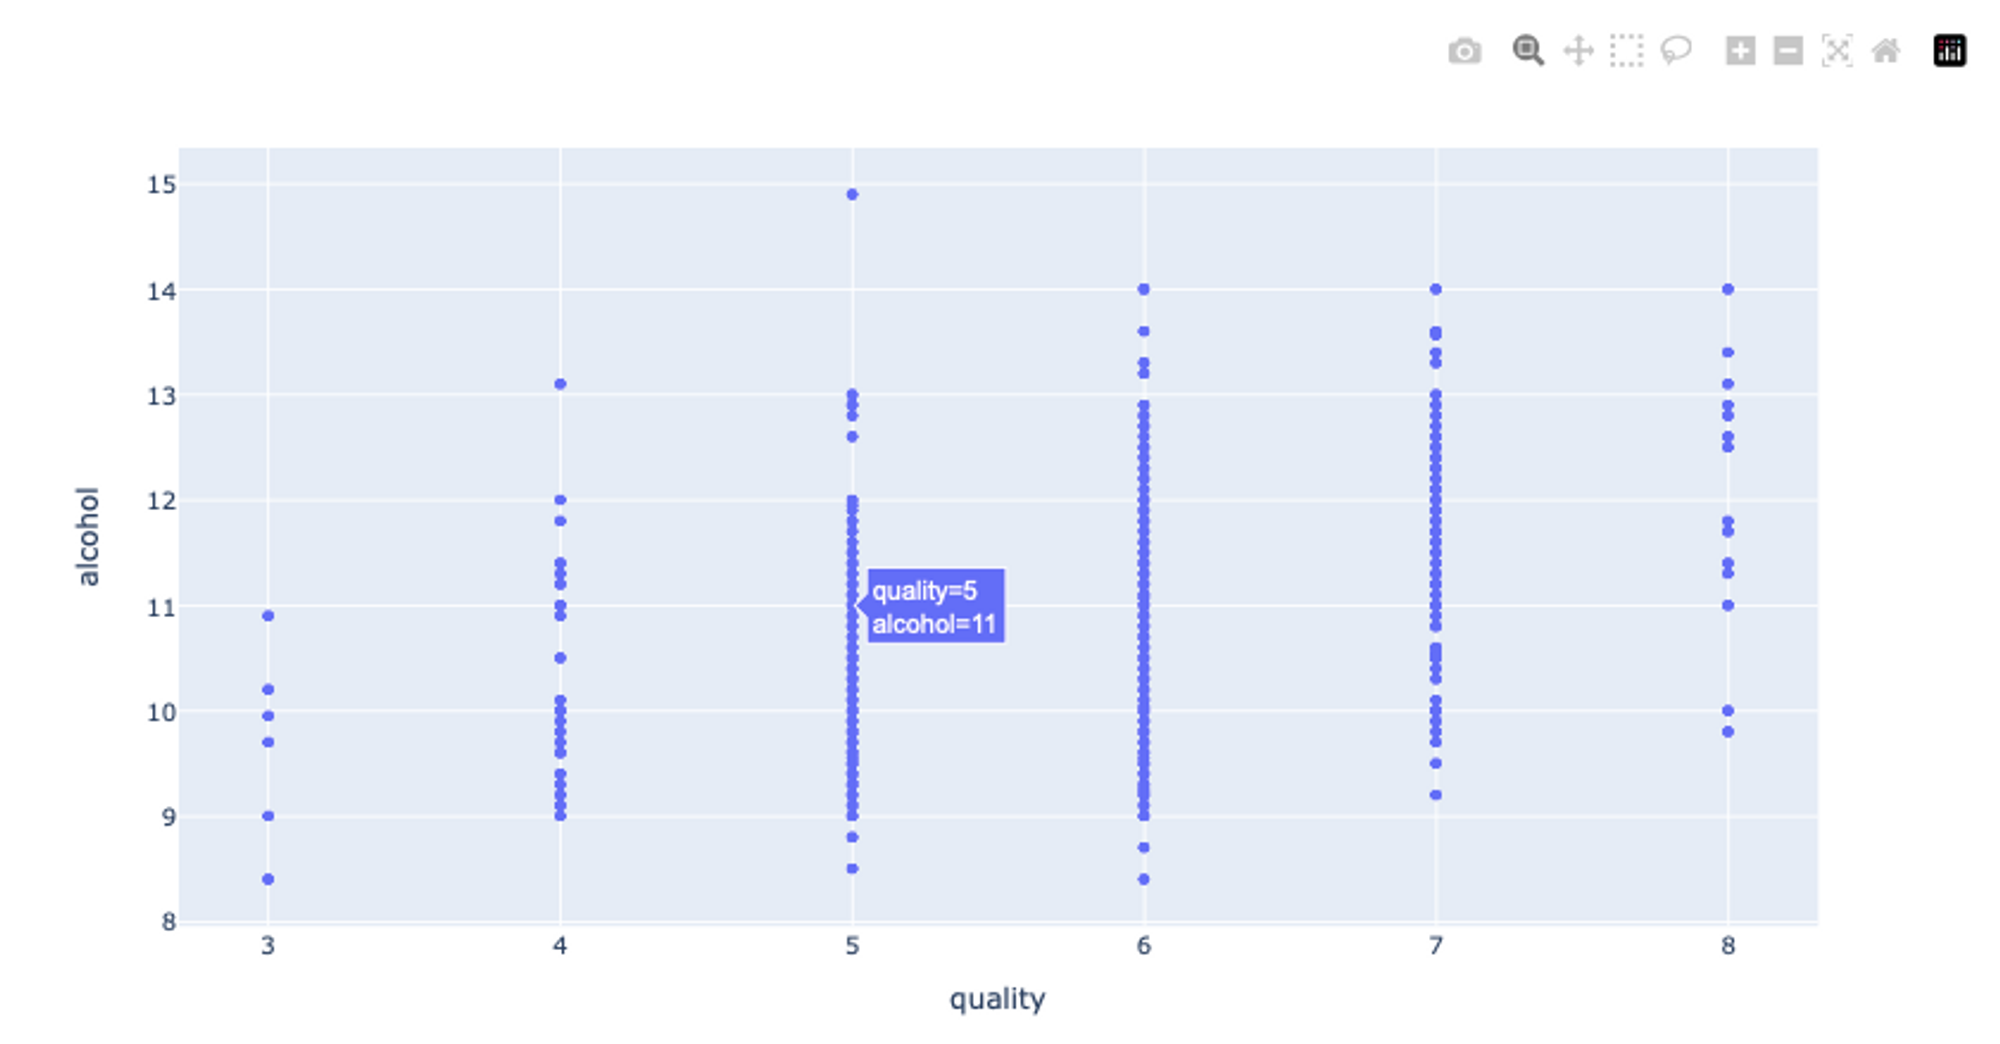
Next, let’s check the impact of all the columns in the dataset on the wine quality using the bar() method that creates a bar plot.
# bar plot
average_quality = data.drop('Id', axis=1).groupby("quality").mean()
average_quality.plot(kind="bar",figsize=(10,5))
average_quality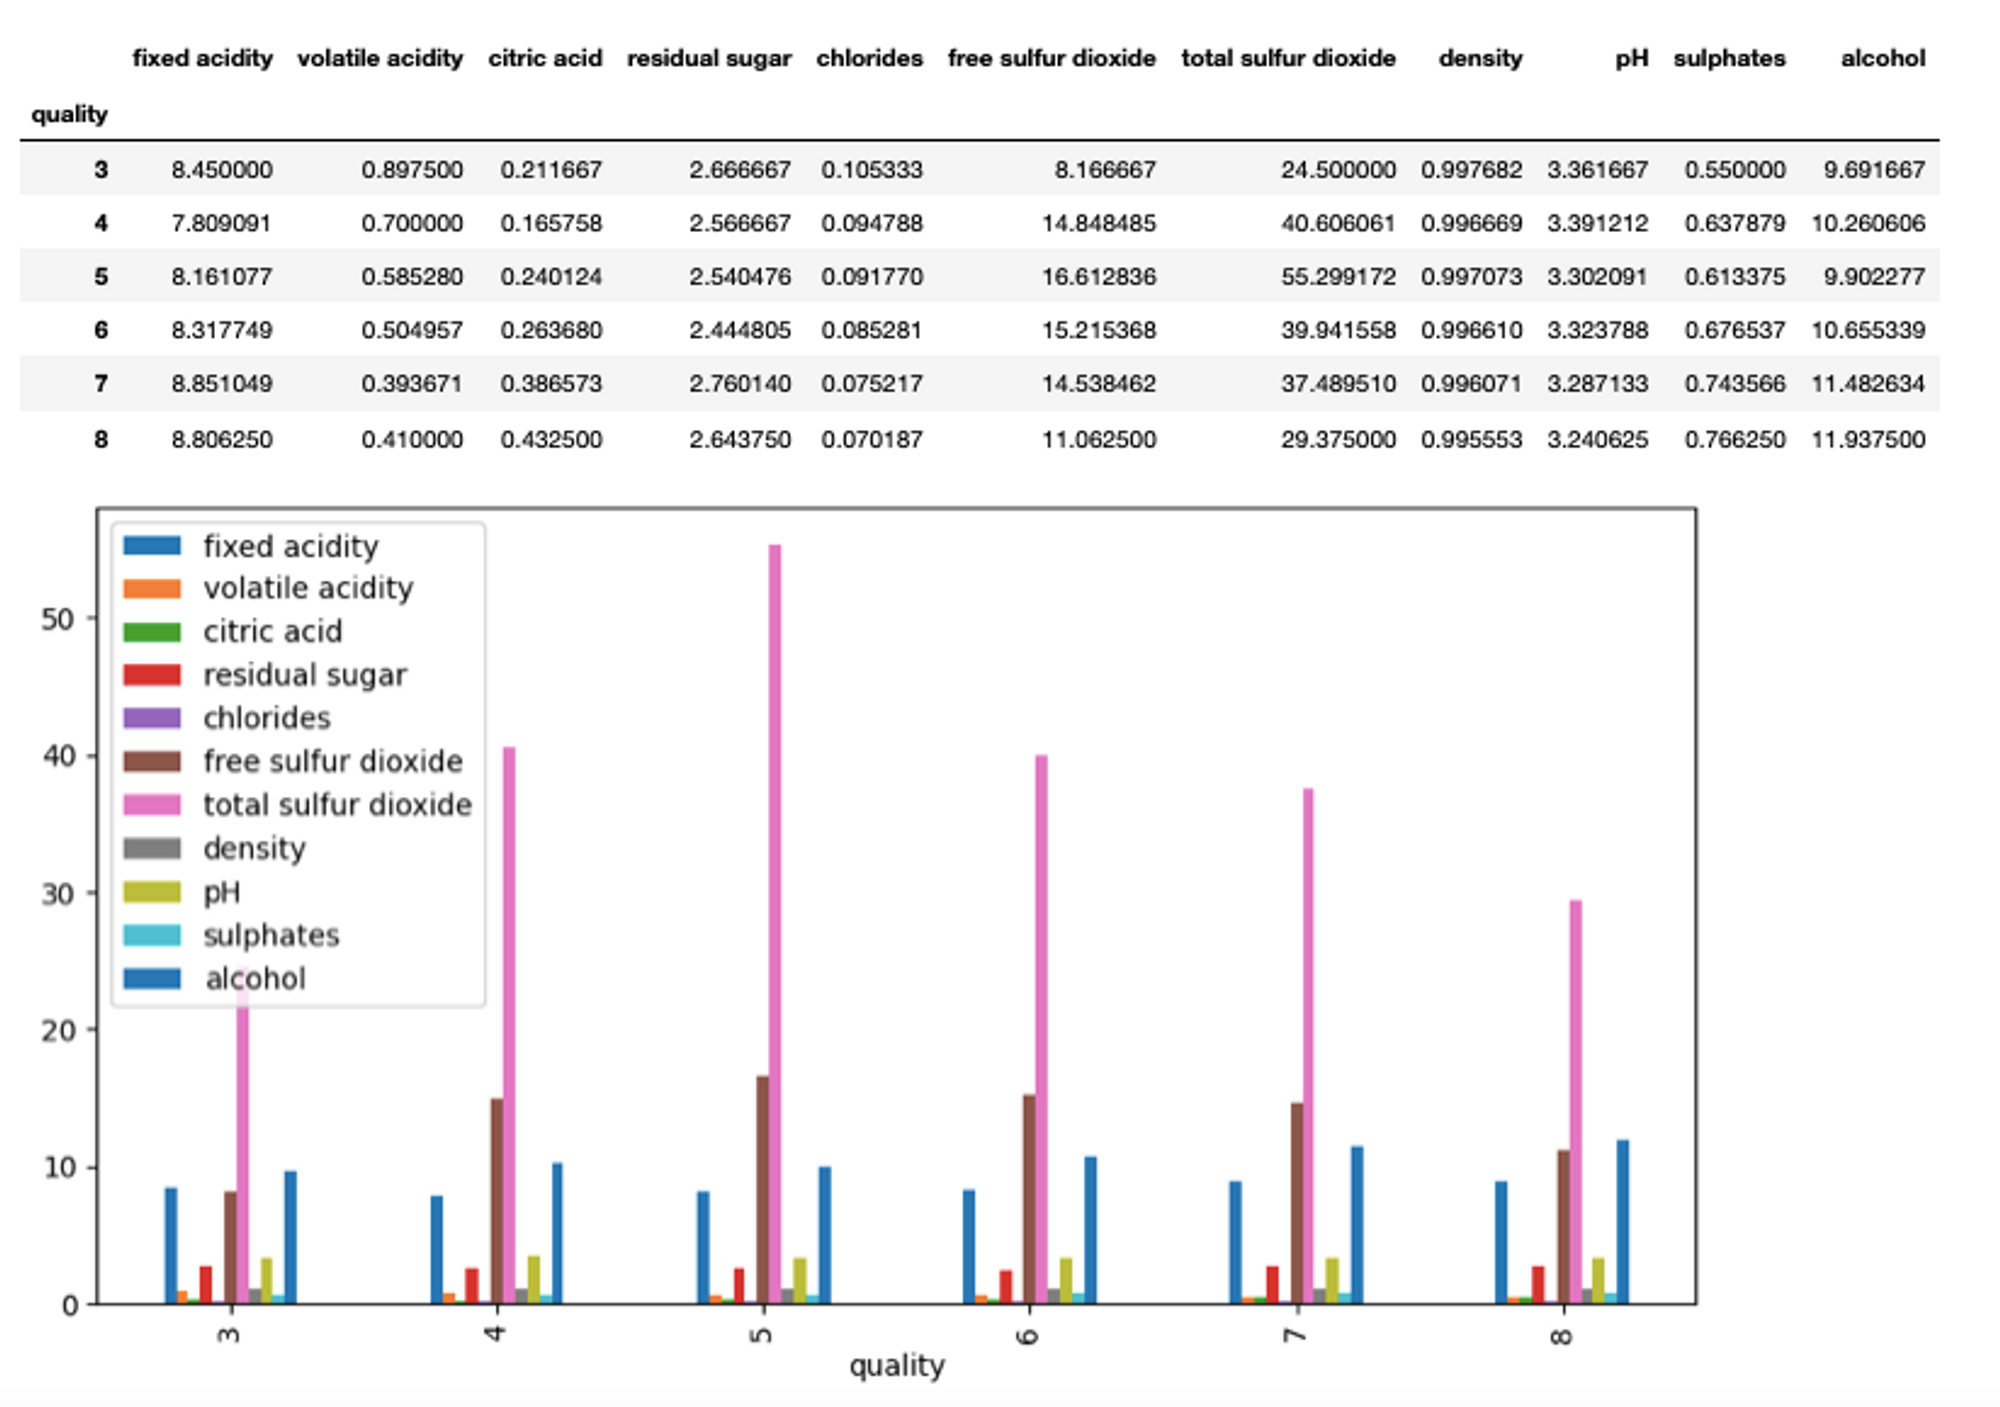
Finally, let’s create a heatmap graph to check the correlation among different features in the dataset using the heatmap() function of the seaborn library.
# heatmap
plt.figure(figsize=(10,7))
sns.heatmap(data.drop(columns=['Id']).corr(), annot=True,vmin=-1, vmax=1,fmt=".2f")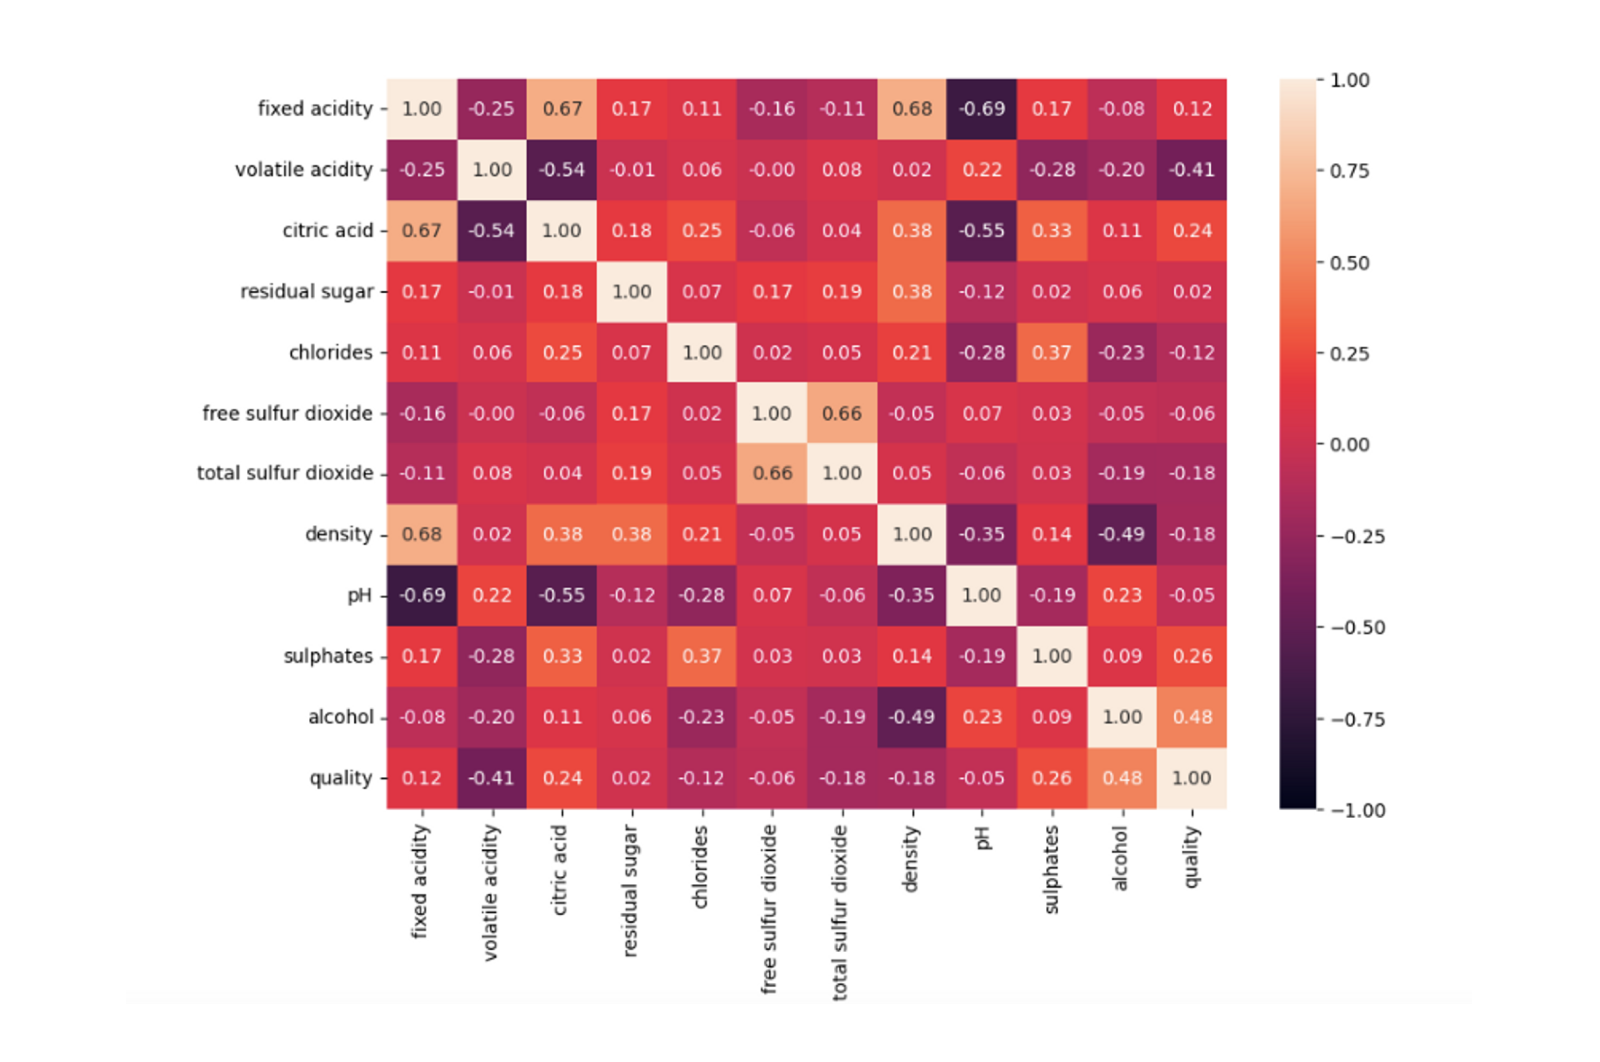
These plots are enough to test the voila’s functionality. Now, head over to the home page of Jupyter and open a terminal.
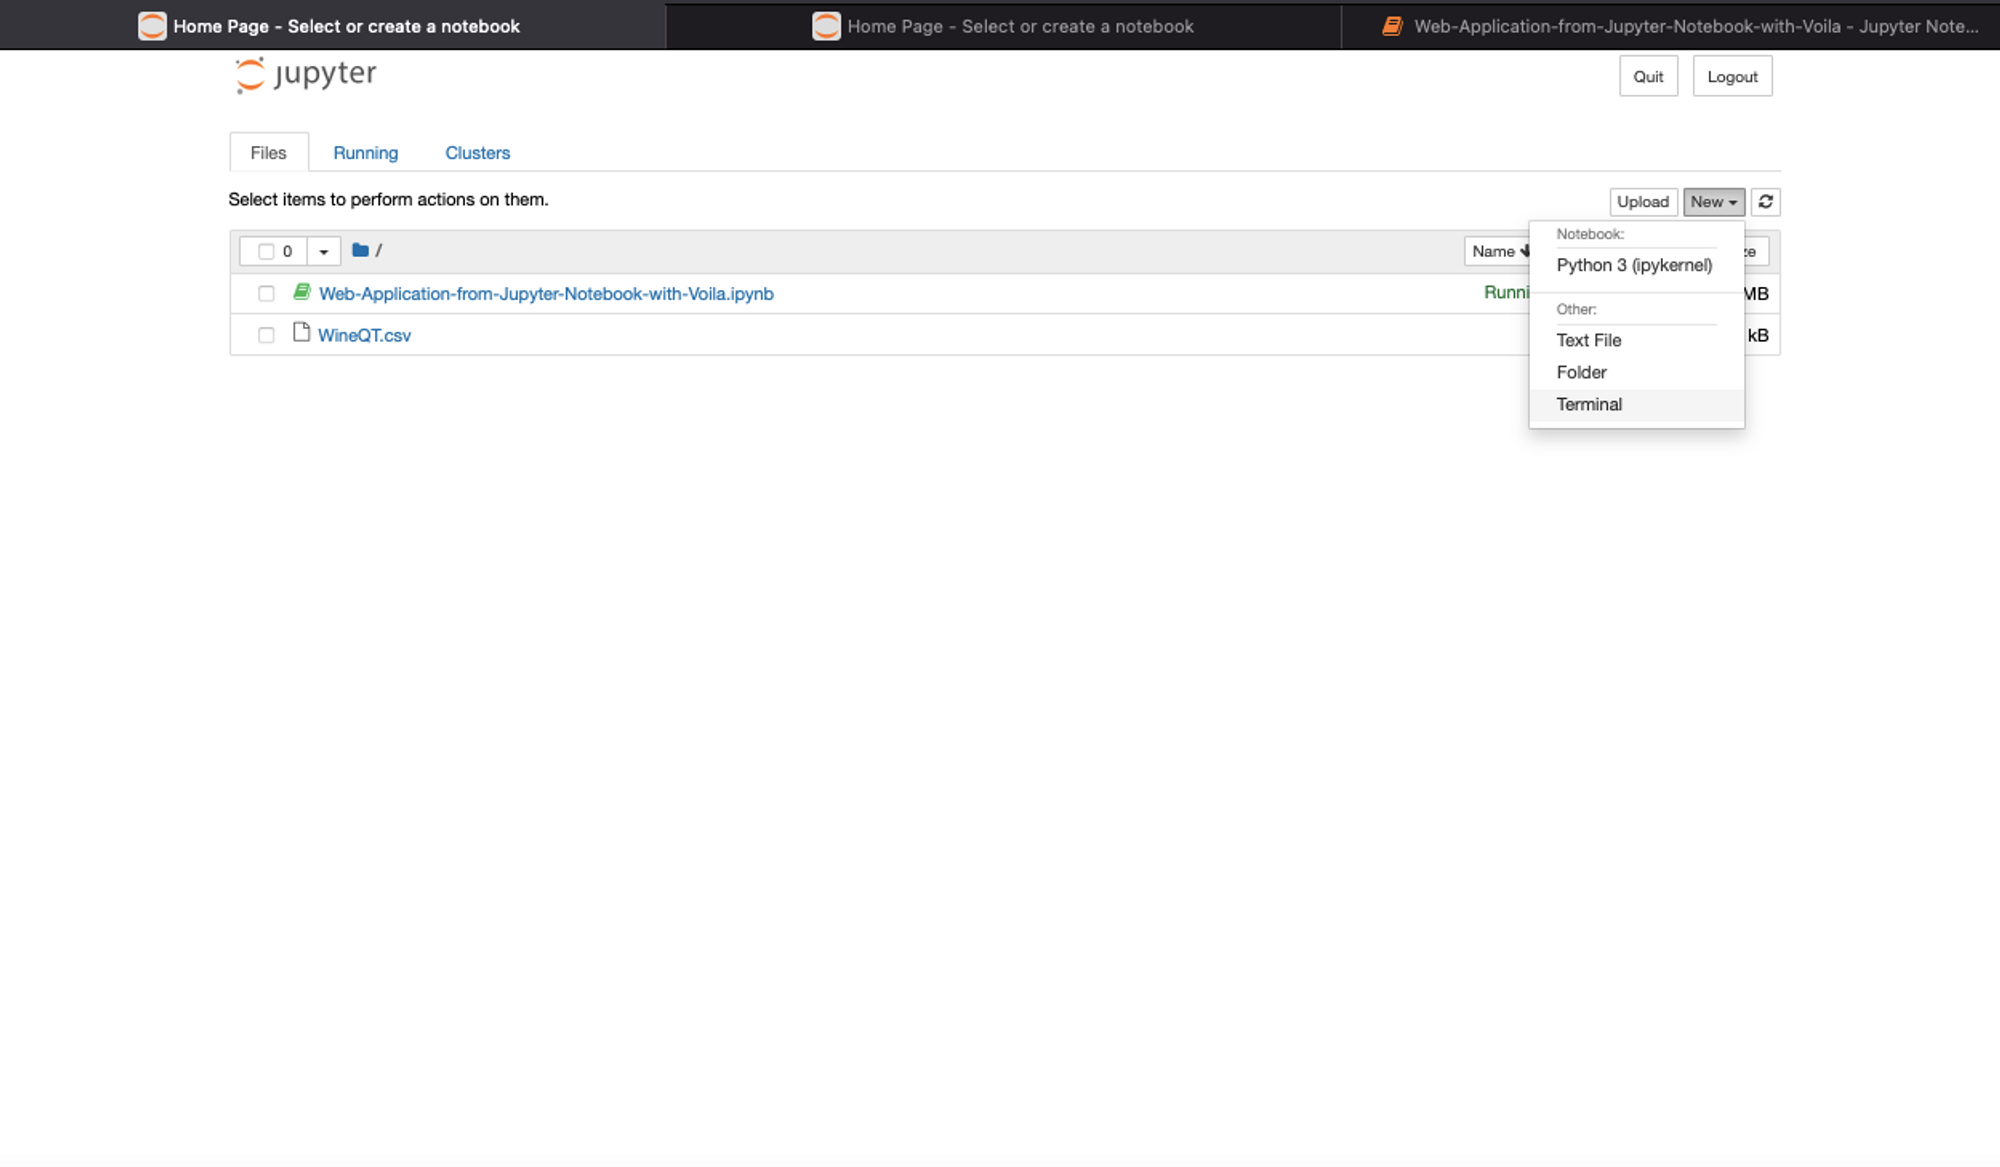
In this terminal, write the command voila notebook_name to convert a Jupiter notebook to an interactive Python web app.
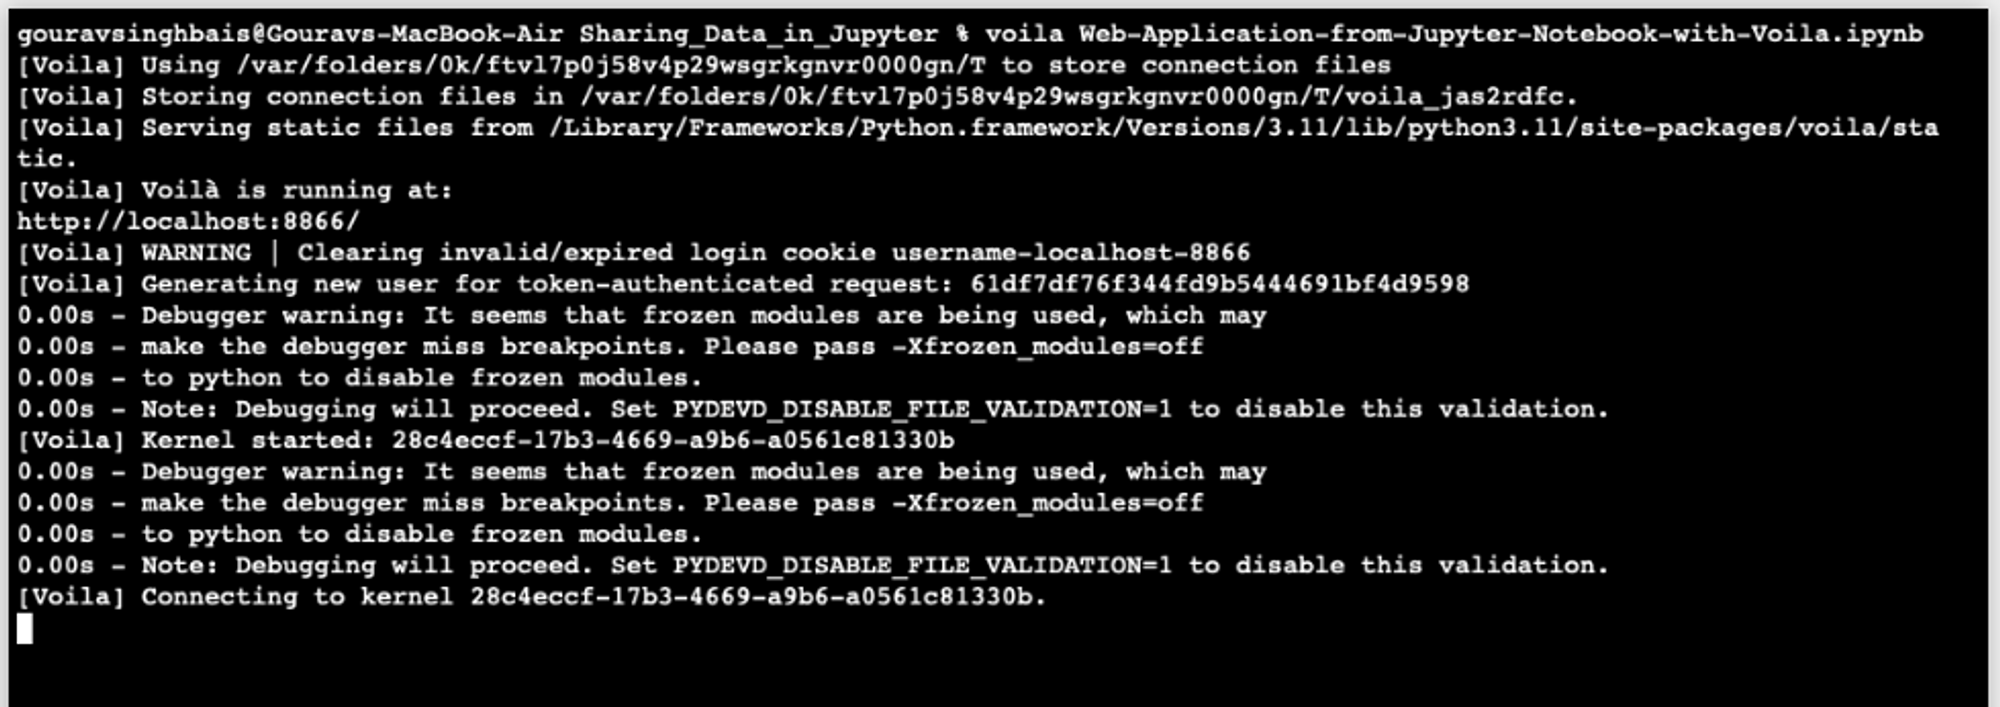
By default, this app runs on your local system (http://localhost:8866) and renders all your output data graphs there.
You can now share these dashboards with others for the quick analysis that you have made.
Screenshots and Sharing
Taking screenshots of the Jupyter Notebook cells is also a way to share the necessary results especially when you don’t want to share the entire Jupyter Notebook or your audience is not familiar with the Jupyter. You can use different tools for taking screenshots of the cells and paste them into a document or a report explaining the purpose of them. You can then share this document or screenshots directly with others over email or messaging apps.
While this is a pretty straightforward approach to sharing the results and analysis, it fails to deliver the reproducibility and interactivity options. Also, it adds an overhead of manually taking the screenshots and organizing multiple cell captures if needed.
Apart from all these options mentioned above, some new cloud-based tools are also coming into the market for better development and collaboration over Jupyter notebooks such as Hex, which allows you to build interactive shareable reports on top of it notebook UI. Also, platforms like Azure and AWS provide online notebook tools such as Sagemaker Notebooks or Azure Notebooks. that make the whole development and collaboration easy by enabling shareability.
Data Sharing Considerations
Data Dependencies
Data is the foundation of any kind of analysis that you are trying to perform with Jupyter notebooks. Sharing the Jupyter notebooks in .ipynb format does not necessarily include any data files that you might be working on. If the other party with whom you are sharing the notebook does not have the required data, they can not reproduce, replicate, or tweak your work. Moreover, this data is necessary for collaboration and ensures that all team members are working with the same dataset, avoiding discrepancies and misunderstandings.
Emails, Google Drive, and Github are the most common ways of sharing small datasets. However, these are not the right platforms to host datasets, due to access control issues and limited space.
The most efficient way to share this data is to use cloud storage such as AWS S3, Dropbox, Google Storage, and Azure Blob Storage. These storage platforms provide high-capacity storage and have good access control infrastructure.
Once you upload your data in these storage spaces, you are provided with a URI through which the dataset is accessible to the users with access permissions. This data can also be hosted on your organization’s remote server and can be accessed using the APIs. Finally, you can use tools like JupyterHub or Azure Notebooks that, along with providing the Jupyter environment, provide you the ability to store datasets in a centralized location.
Credential Management
Using credentials when accessing databases or other cloud-based services in Jupyter is a very common practice. As these credentials are private you should take measures to protect sensitive information like database usernames, passwords, API keys, and tokens. You should not include credentials or private data of any kind in your Jupyter notebook cells. Instead, you can either read the credentials from a config file or set them as environment variables in your system.
When sharing these credentials with others, make sure that the files are properly encrypted and that you are sharing data with authorized users. You can also use Key Vaults or Secret Management Tools like HashiCorp Vault, AWS Secrets Manager, or Azure Key Vault to save and share passwords among your team. If working on a shared environment there is no need to share credentials with files instead set them as environment variables so that anyone can access them with proper permissions.
Version Control
When using Jupyter notebooks for machine learning or data science use cases, you tend to try multiple data preprocessing techniques or and machine learning models. If you don’t keep track of all the things that you have tried, then you might end up in a never-ending loop of trying the same things again and again. There could also be the issue that you and your fellow developers might be working on the same thing if there is no proper collaboration. In this case, you need a tool that provides you the version control facilities as well as collaboration opportunities.
Tools like GitHub, and Bitbucket, allow you to save your work in repositories. It facilitates seamless sharing of notebooks and datasets across different environments and among team members, providing a standardized and controlled way to distribute and access files. Finally, using branching and merging, team members can work on different aspects of a project independently and then combine their work systematically.
Handling Execution Order
Jupyter notebooks are designed to execute the cells in order where each cell relies on the results or variables generated in preceding cells. Running these cells out of order can disrupt the whole logic flow, inconsistent overwriting of variables, potentially leading to inconsistent and erroneous outcomes. Debugging the code can also be a pain for developers and you can not share the results with stakeholders as the results produced can be wrong.
Running notebooks out of sequence ultimately affects reproducibility since it becomes challenging to recreate the exact state of the notebook at any given point, which makes collaboration and validation more difficult. The scope of wrong execution order is not limited to the cells but to a list of notebooks as well. Suppose you have a list of notebooks where one reads the data from the database, the other preprocesses the loaded data, and the next one works on identifying the best ML model. If you try to run the second one at the beginning it will not make any sense as the data is not loaded to process.
It is a good practice to maintain a document that specifies the implementation details and the execution order of the notebooks to reproduce your work. Conclusively, It’s crucial to run Jupyter notebooks in a sequential and organized manner if you want to keep the integrity and consistency of your work.
You can find the notebook and dataset used for this tutorial here.
Sharing Jupyter Notebooks
Sharing insights and findings is a cornerstone of effective data science. While Jupyter Notebooks offer a powerful platform for data analysis and visualization, their true potential shines when they're shared and opened up for collaboration.
As we've explored, there are numerous methods and considerations when it comes to sharing these notebooks. Whether you're selecting specific parts of a notebook to share, considering the inclusion of data, or choosing the right platform, the key is to be thoughtful and strategic. Ensure your data's security, but also make it accessible enough to drive collaboration and understanding.
After all, the value of a Jupyter Notebook isn't just in its ability to compile code and produce visuals—it's in its power to communicate, foster teamwork, and drive informed decision-making.
Want to learn more about Jupyter notebooks?
Here are some of our other articles:


