USE CASES

Data Clustering

Unleash the power of data clustering—an unsupervised machine learning technique that uncovers patterns and groups similar data together without the need for labeled data.

Customer Segmentation Grid image

Customer Segmentation

Group users and customers into intelligent segments

cluster algos

Clustering algorithms

Group similar data points together to discover patterns, structures, or subgroups within a dataset.

Cluster real

Cluster analysis

Build an interactive K-means clustering app in minutes with Hex. Scale, reduce, and encode your features using Python— and then create an interactive app using input parameters.

doc similarity grid

Document Similarity with Embeddings

Explore document similarity using embeddings, swiftly visualizing and interpreting text clusters from your SQL warehouse.

Don't see what you need?

We're always expanding our collection of examples and templates. Let us know what you're working on, and we'll whip up an example just for you.

Request a template

A quick guide to Data Clustering

Clustering is a machine learning technique that groups similar data points together based on certain characteristics, effectively forming clusters. It’s an unsupervised learning method and does not require labeled data for training.

Understanding Clustering

In machine learning, clustering helps to uncover the inherent groupings within data, thereby aiding in exploratory data analysis. It can also be used to preprocess data, as an initial step before applying other machine learning algorithms.

In clustering, data points are grouped based on their similarity or distance. This can be computed using various metrics such as Euclidean distance, Manhattan distance, or cosine similarity, depending on the context and nature of the data. Data points in the same cluster are more similar to each other than those in different clusters.

Types of Clustering Algorithms

Clustering algorithms represent a variety of methods for partitioning data into subsets:

  • Hard and Soft Clustering: Hard clustering assigns each data point to a distinct cluster, while in soft clustering, a data point can belong to multiple clusters with different degrees of membership.

  • Hierarchical Clustering: This type of clustering builds a hierarchy of clusters by either a bottom-up or top-down approach. It's particularly useful when the relationship among the data is hierarchical and allows visualization through dendrograms.

  • Partitioning Clustering: Partitioning clustering divides data into non-overlapping subsets or clusters without any hierarchy. K-means is a widely used partitioning clustering technique.

  • Density-based Clustering: Density-based clustering algorithms identify clusters as dense regions of data points separated by sparse regions. DBSCAN is a well-known example of this type.

  • Grid-based Clustering: Grid-based methods quantize the data space into a finite number of cells that form a grid structure and then perform all the operations on these grids.

Popular Clustering Algorithms

Each clustering algorithm has unique characteristics and applications. Understanding these can help select the most appropriate algorithm for a specific task.

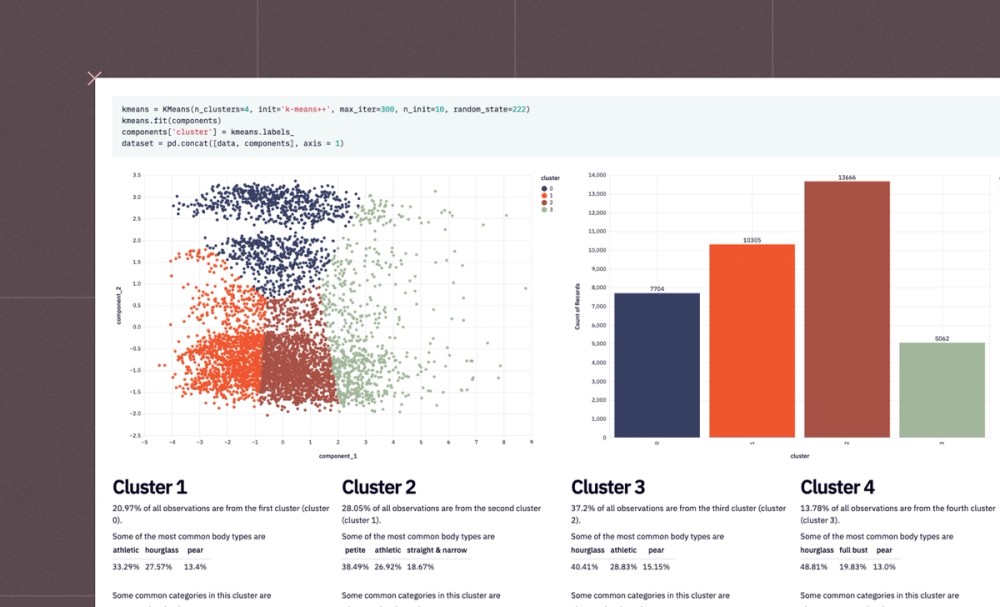
  • K-means Clustering: K-means is a popular partitioning method that divides data into K non-overlapping clusters. It's widely used because of its efficiency and simplicity.

  • Hierarchical Clustering: Hierarchical clustering creates a tree of clusters, which allows for an interpretable hierarchy of clusters. It's often used when the number of clusters is not known a priori.

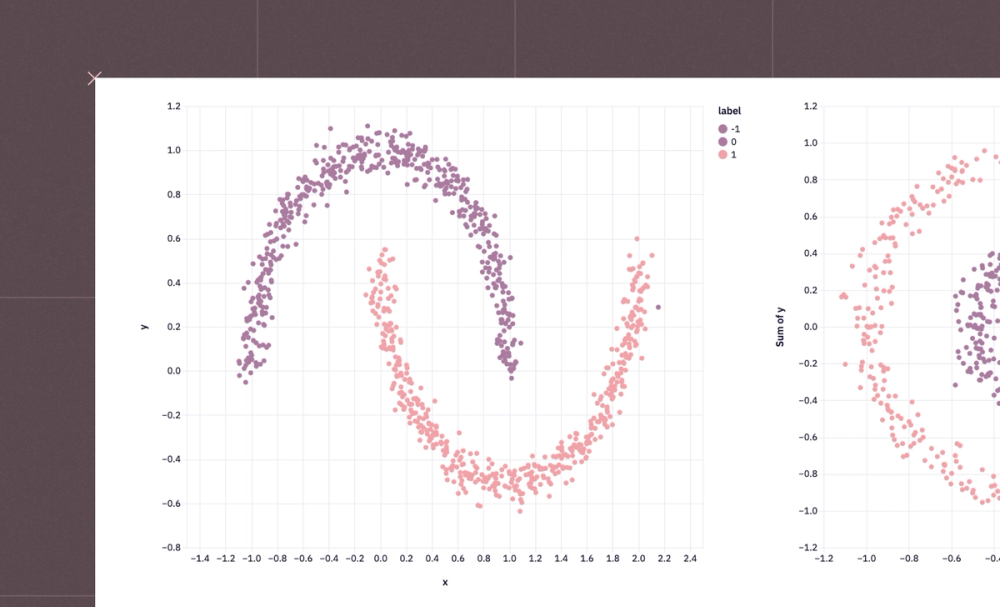
  • DBSCAN (Density-Based Spatial Clustering of Applications with Noise): DBSCAN is a density-based clustering algorithm that can discover clusters of different shapes and sizes. It's particularly useful for spatial data analysis and anomaly detection.

  • Spectral Clustering: Spectral clustering uses the eigenvectors of a similarity matrix to reduce the dimensionality of the data before clustering in fewer dimensions. It's capable of identifying complex structures.

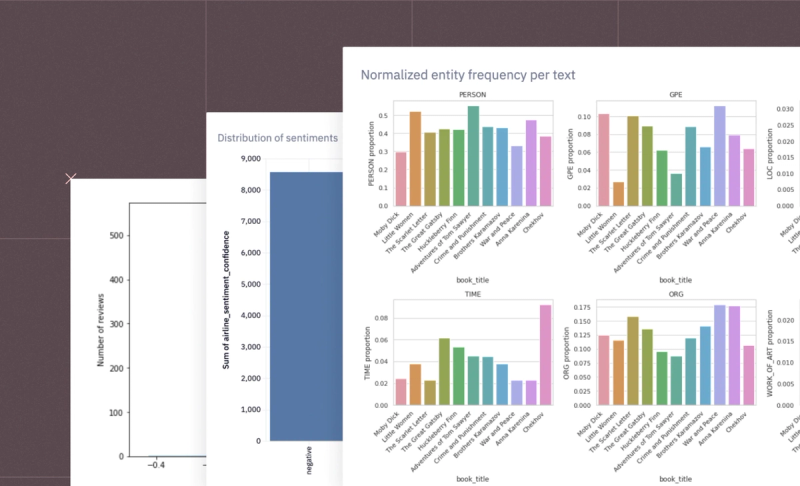
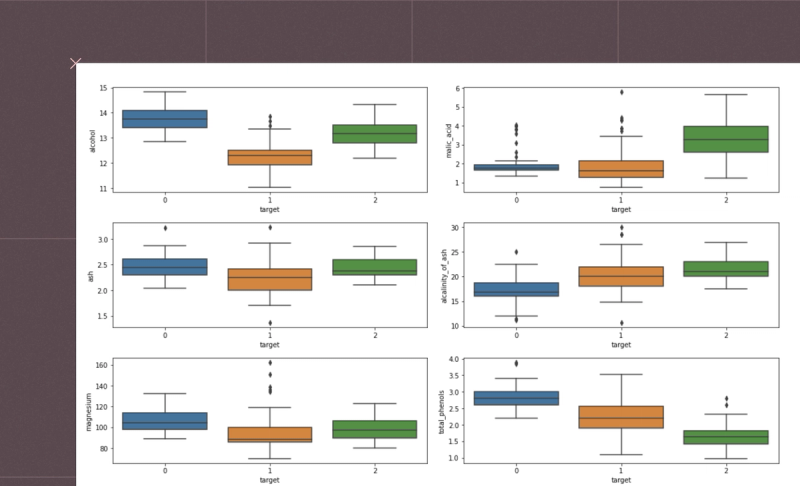
Finding the right number of clusters is crucial in clustering. Techniques such as the Elbow method, Silhouette analysis, and Gap statistic can help determine the optimal number of clusters.

On this page, you'll find interactive examples demonstrating data clustering. If you see something interesting, click "Get a copy" to dive deeper and adapt any example to your requirements.

See what else Hex can do

Discover how other data scientists and analysts use Hex for everything from dashboards to deep dives.

USE CASES
use-case-category-grid-image-kpi-sentiment-analysis

Sentiment Analysis

Multiple contributors

Decipher subjective information in text to determine its polarity and subjectivity, explore advanced techniques and Python libraries for sentiment analysis.

USE CASES
use-case-category-grid-image-natural-language-processing

Natural Language Processing

Multiple contributors

Empower your AI and ML applications to interpret, recognize, and generate human language with powerful Natural Language Processing (NLP) algorithms.

USE CASE
feature selection grid

Feature Selection

Seamlessly apply feature selection methods to data fresh from your SQL warehouse

BLOG
brand-inaccessability-hero

The Poles of Brand Inaccessibility

Izzy Miller · August 28, 2023

Using modern data tools to discover modern opportunities for exploration

BLOG
nlp blog hero

A Comprehensive Guide to Natural Language Processing Algorithms

Andrew Tate · May 25, 2023

Learn about the simpler text processing cousins of LLMs like GPT-4

FAQ

How do I use Python for cluster analysis?
chevron-down

Python libraries like scikit-learn and scipy provide a range of clustering algorithms including K-means, DBSCAN, and Hierarchical clustering which can be used for cluster analysis.

What is the most accurate clustering algorithm for text data?
chevron-down

Accuracy depends on the specific dataset and task, but generally, TF-IDF coupled with K-means or Hierarchical Clustering is often used for text data.

How do you determine if your dataset can be clustered?
chevron-down

Using visualization methods or cluster tendency algorithms like Hopkins Statistic, you can estimate if a dataset contains meaningful clusters.

Why is it important to normalize the data before clustering?
chevron-down

Normalization ensures all features contribute equally to the result, preventing any one feature from dominating due to its scale.

How do I compare results of different clustering methods?
chevron-down

Comparison can be done using internal evaluation metrics such as silhouette score, Dunn index, or external metrics like Rand index if true labels are known.

Do I need training data if I use clustering?
chevron-down

No, clustering is an unsupervised learning technique that doesn’t require labeled training data.

What is streaming data clustering? What are its applications?
chevron-down

Streaming data clustering is the process of clustering data that continuously arrive over time. It's used in real-time applications like online customer segmentation, real-time anomaly detection, and tracking evolving trends.

How do I decide the cluster size based on the data?
chevron-down

The choice of cluster size often depends on the data and the specific use case. Methods such as the Elbow Method or the Silhouette Method can help determine the optimal number of clusters.

What are the major clustering approaches?
chevron-down

The major clustering approaches include partitioning methods (like K-means), hierarchical methods, density-based methods (like DBSCAN), and grid-based methods.

Are there any clustering algorithms for tagged data?
chevron-down

Yes, constrained clustering algorithms, such as Constrained K-means and COP-Kmeans, can handle tagged data.

Can't find your answer here? Get in touch.