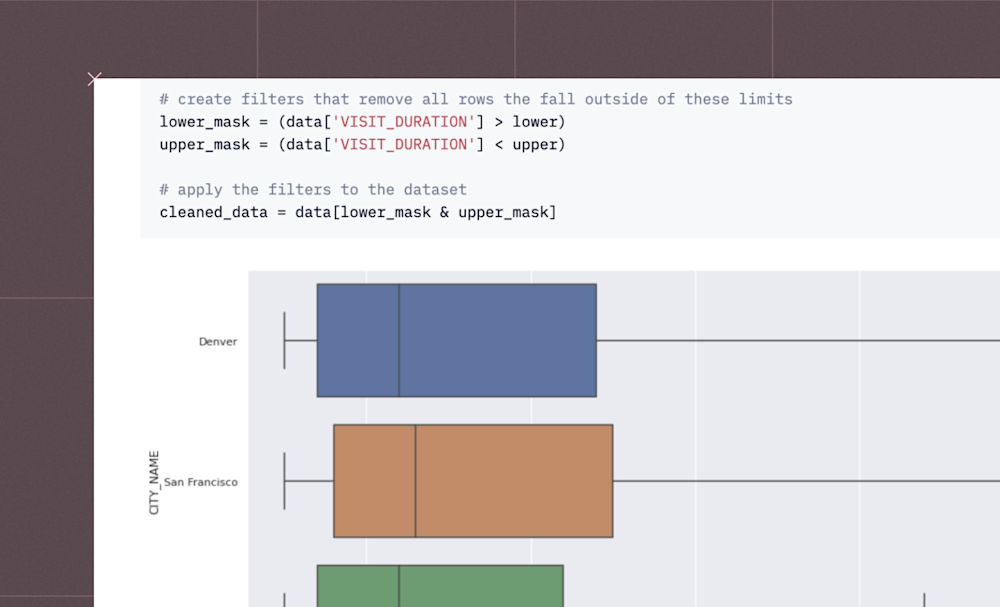
Input parameters are a core, unique part of Hex. Input parameters can be created in the Notebook view and then added, optionally, to an app.
Izzy Miller
Enhance your marketing and sales strategies with a detailed Customer Segmentation model built using SQL & Python. Using K-Means clustering, you can intelligently segment your customer base into distinct groups based on purchase behavior, demographics, and other significant characteristics, enabling targeted marketing campaigns and personalized customer experiences. Hex lets you use Python's machine learning libraries for feature scaling and encoding, and K-Means for defining clear, actionable customer clusters— and also makes it easy to power these analyses with data right from your SQL warehouse.
Detect and analyze anomalies in your dataset using robust Outlier Detection methods. With Hex, you can easily integrate Python's Scikit-learn, use IQR techniques, or apply Z-Scores to pinpoint outliers. Streamline your data analysis, ensure quality, and drive accurate results by efficiently identifying and addressing these deviations.
See how to use data science to enhance inventory decisions with this comprehensive project focused on analyzing, predicting, and optimizing inventory levels. Using historical sales data and trends, we build a robust predictive model with Python and SQL that factors in seasonality, trends, and demand fluctuations. Hex's seamless integration of SQL, Python, and intuitive visualization tools makes it easy to explore inventory data, build predictive stock-level models, and communicate findings in an easy-to-understand, interactive report. This model ensures you maintain the optimum level of stock during peak periods, thus minimizing costs and preventing out-of-stock scenarios.
Hex provides a flexible workspace to parse text data like social media posts and perform sentiment analysis with SQL and Python. Hex's polyglot environment means you can use Python packages like NLTK and SpaCy directly on data from your warehouse— or in this case, just a good old fashioned logistic regression against a simple .csv file. From simple 5-minute project to production deployed data applications, Hex makes it easy to perform any kind of sentiment analysis on social media (or any) data.
With Hex, you can easily dive into cohort analysis using Python and unlock insights about your customer groups. Explore their behavior over time, spot retention patterns, and discover valuable nuggets of information. By defining cohorts based on shared characteristics, like the month of their first purchase, you'll gain a deeper understanding of how different customer sets behave. Hex empowers you to make smarter decisions and optimize your business strategies by leveraging the power of cohort analysis.
Understand how collective user tastes can be used to find products that are similar to each other and make personalized recommendations based on purchase history. Hex makes it easy to build a recommendation engine using collaborative filtering with Python, and then deploy it as an interactive web app.
Period over period analysis in a notebook has never been easier or more flexible. With a powerful Python workspace that also supports SQL, you can build a fully interactive report for anyone, and give them the tools to customize their timeframes and periods of interest. When you're done, just click "Publish" and your results are instantly shareable.
Reduce customer churn with predictive insights. Discover how our Random Forest model can forecast potential customer drop-offs before they happen, saving you the higher costs of acquiring new clients. Dive into our project to see how we turn data into retention strategies for your business.
Izzy Miller, Dev Advocate at Hex
Hex is your go-to platform for flexible time series forecasting directly with your data warehouse, enabling you to construct powerful predictive time series models using Python and SQL, without any needless data shuffling. It's particularly handy when integrated with libraries like Prophet for detailed daily temperature forecasting. Once you've nailed your model, it's simple to add interactive elements, making your forecasts not just informative, but engaging. You can take your model straight from creation to production, all from within the intuitive Hex interface. No fuss, no extra steps - just efficient, effective data science at your fingertips.
Building a natural language processing app that uses Hex, HuggingFace, and a simple TF-IDF model to do sentiment analysis, emotion detection, and question detection on natural language text.
Exploratory data analysis in Hex is like no other tool you've used before. SQL, Python, rich text, and a library of no-code tools are right at your fingertips in the same workspace. When you're done, just click "Publish" and your results are instantly shareable.
Discover how Hex data scientists and analysts use Hex for everything from dashboards to deep dives.
Table display cells are a way to visualize, filter, and format tabular data without writing any code. Simply choose a dataframe and use the Table display settings to apply any fitlers, change the data format of any column, hide any column, wrap text.
Hex’s first-class Python support unlocks a world of opportunity for data exploration.
Query your warehouse, uploaded files, or dataframes directly with SQL.
Map cells let you visualize geographic data in a customizable interactive map.
Chart cells let you visualize and explore the dataframes in a Hex project, without writing code.
Text and Markdown cells let you add narrative, explanations, and context to your data project.