USE CASES

Time Series

Discover meaningful patterns and trends by visualizing data over time.

Time series prophet grid image
Featured

Time Series Forecasting with Prophet

Izzy Miller, Dev Advocate at Hex

Make simple time series modeling easy and configuration-free with Prophet

Time Series Forecasting Cover

Time Series Forecasting

One workspace with everything you need to build complex time series models

time series snowpard

Time series analysis in Snowpark

Forecast hourly restaurant traffic using UDTFs in Snowpark

Don't see what you need?

We're always expanding our collection of examples and templates. Let us know what you're working on, and we'll whip up an example just for you.

Request a template

A quick guide to Time Series

Time series analysis is a statistical field that deals with analyzing temporal data. Time series analysis can be broken down into several key steps:

Time series preprocessing

Time series preprocessing prepares and cleans time series data before it's used for analysis. Methods include:

  • Resampling involves changing the frequency of your data points. For instance, you might resample from a daily frequency to a monthly frequency. by aggregating daily observations into monthly averages.

  • Detrending involves removing any underlying trend in your time series data. Detrending can be accomplished by methods like differencing, where you subtract the previous observation from the current observation, or by fitting a line to the trend and subtracting it.

  • Deseasonalizing refers to removing the seasonal component of time series data. Seasonality is a pattern of a fixed period that repeats in the data, like an increase in sales every December. Deseasonalizing could involve subtracting the seasonal component identified by a method like moving averages or decomposition.

  • Normalization refers to the process of rescaling the data to have a specific mean and standard deviation, often to improve the performance of certain models or to allow different time series to be compared on the same scale.

Following time series preprocessing, you can undertake exploratory data analysis to plot the data and explore its basic characteristics to understand its underlying structures and patterns, before modeling the data and using it in future predictions.

Time series modeling

Time series modeling is the process of identifying the most appropriate model that best captures the statistical properties and patterns in the time series data. The aim is to explain the underlying structure of the observations, which could include trend, seasonality, cycles, autocorrelation, or randomness. The model can then be used to describe the behavior of the time series and understand its underlying dynamics.

Two common models here are ARIMA and SARIMA:

  • ARIMA (AutoRegressive Integrated Moving Average) is a model for time series analysis that combines differencing (to make the data stationary), autoregression, and a moving average model to forecast future points in the series.

  • SARIMA (Seasonal AutoRegressive Integrated Moving Average): SARIMA models extend ARIMA models by adding a seasonal differencing term, allowing them to effectively model and forecast time series data with a seasonal component.

Time series modeling

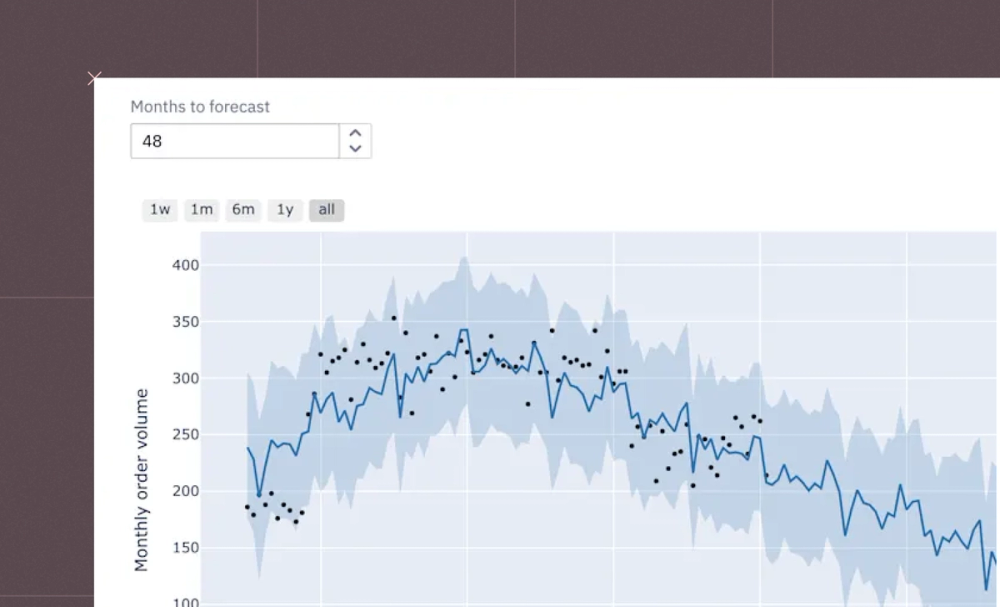
Time series forecasting is a predictive technique that builds on time series modeling and analyzes patterns, trends, and seasonality in past observations to predict future outcomes.

Various models can be used for time series forecasting, such as:

  • Exponential smoothing involves calculating the weighted average of past observations, where the weights decrease exponentially as the observations get older, hence giving more importance to recent observations.

  • State space models are a class of mathematical models that allow for the representation of linear and non-linear, and univariate and multivariate time series, capturing complex temporal dynamics and often used in conjunction with the Kalman Filter for forecasting.

  • Recurrent Neural Networks (RNNs) are a type of neural network optimized for processing sequences of data, like time series, by using loops within the network to maintain information across time steps, thus making them effective for forecasting tasks with complex, non-linear time dependencies.

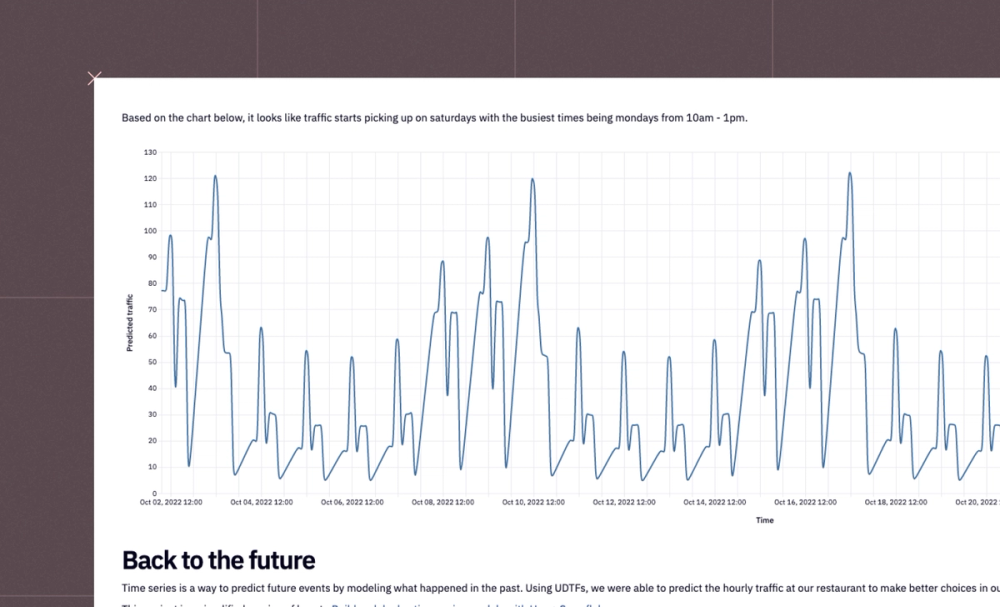
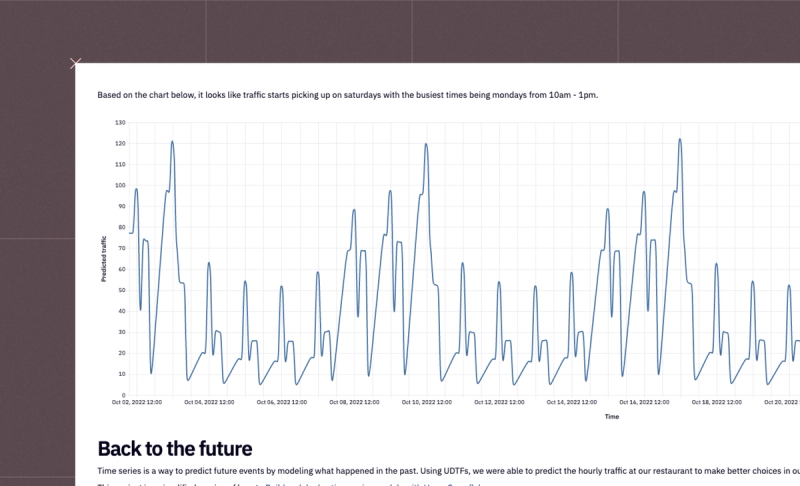
On this page, you'll find interactive examples demonstrating time series analysis, time series forecasting, time series modeling, and other analyses of time series in Python. If you see something interesting, click "Get a copy" to dive deeper and adapt any example to your requirements.

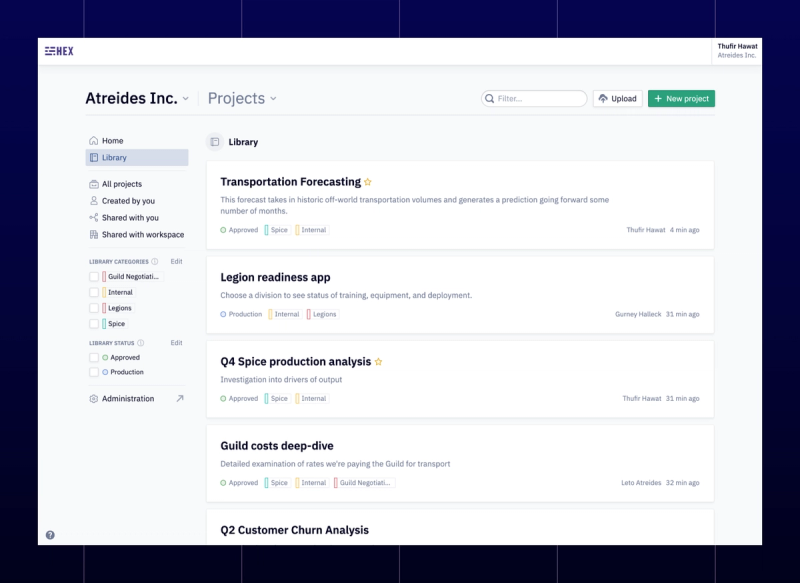
See what else Hex can do

Discover how other data scientists and analysts use Hex for everything from dashboards to deep dives.

BLOG
library-view

Introducing: Knowledge Library

Barry McCardel · January 18, 2022

High-impact data work isn’t just about churning out analysis; it’s about creating knowledge.

USE CASE
time series snowpard

Time series analysis with Snowpark

Forecast hourly restaurant traffic using UDTFs in Snowpark

USE CASE
Time series prophet grid image

Time Series Forecasting with Prophet

Izzy Miller, Dev Advocate at Hex

Make simple time series modeling easy and configuration-free with Prophet

Unveiling Patterns Using Time Series Visualization

Jason Albrean · December 1, 2023

Time series visualization is crucial for understanding trends. Using a mock AirPassengers dataset, the article highlights upward trends, seasonal patterns, and year-over-year growth in the airline industry.

Understanding the Importance of Stationarity in Time Series

Andrew Tate · December 1, 2023

Stationarity, the constancy of a time series' stats, is key for analysis. It eases modeling, interpretation, and enhances performance. Tests like ADF, KPSS, or visual methods confirm stationarity, vital for solid time series models.

Detecting Seasonality Through Autocorrelation

Andrew Tate · December 18, 2023

Autoencoders can detect seasonality in time series data, while strategies like seasonal differencing and ARIMA models help businesses forecast and plan by understanding patterns using ACF, PACF, and seasonal decomposition.

FAQ

What is autocorrelation in time series analysis?
chevron-down

Autocorrelation, also known as serial correlation, is a statistical correlation that measures the degree of similarity between a given time series and a lagged version of itself over successive time intervals. It is especially useful in identifying seasonality or repeated patterns in a time series.

What is stationarity and why is it important in time series analysis?
chevron-down

Stationarity refers to a property of a time series whereby its statistical properties such as mean, variance, and autocorrelation remain constant over time. Many time series models assume stationarity as it simplifies the process of modeling and forecasting.

What is the difference between Time-series and Signal?
chevron-down

While both time series and signals represent data points indexed in time, time series is usually applied to data collected at regular intervals and used in fields like economics and finance, while signal is often used for continuously varying data and used in fields like electrical engineering and sound processing.

What is a periodogram time series?
chevron-down

A periodogram is a tool in time series analysis used to identify the periodic signals in a time series data, usually by displaying the 'strength' of different frequencies in a frequency spectrum plot.

How is time series data different from non-time series data?
chevron-down

Time series data is indexed by time and the order of the data matters, making it dependent on previous observations, whereas non-time series data does not have a time component and each observation is independent.

What is time series analysis forecasting?
chevron-down

Time series analysis forecasting is a statistical technique used to predict future values based on previously observed values in the series.

Can time series analysis be used to predict stock trends?
chevron-down

Yes, time series analysis can be used to predict stock trends, but the stock market is influenced by many unpredictable factors, so predictions should be used cautiously and are not always accurate.

Can machine learning be used for time-series analysis?
chevron-down

Yes, machine learning techniques such as recurrent neural networks (RNNs) and Long Short-Term Memory (LSTM) networks can be used effectively for time series analysis.

Does R-squared matter in time series data? If not, then why?
chevron-down

R-squared can be misleading in time series analysis because it can artificially inflate when applied to non-stationary data, leading to false conclusions about the model's effectiveness.

Why can't you use linear regression for time series data?
chevron-down

Linear regression assumes that observations are independent of each other, while in time series data, observations are usually dependent on previous time points (autocorrelation), violating this assumption.

Can't find your answer here? Get in touch.