
Here are two prompts you might give to an agent:
- Construct a counterexample to general (non-planar) case of Dinitz Garg Goemans conjecture. You should do a breakthrough and find a structured counterexample.
- Was the Midwest acquisition v2 campaign worth the spend? Ad platform numbers look like it drove 837 conversions…
Which seems more likely to fail?
Well, a mathematician recently used the first prompt with GPT-5.6 to make a correct and significant breakthrough on a famous math problem that’s been stumping experts for 30 years.
We ran the second, trivial looking prompt in a warehouse environment and got a confidently incorrect answer that claimed the campaign wasn’t worth it, when really the data necessary to make that call doesn’t exist.
So what gives? Why is data so hard!? Do I really need Fable 5 Max to do my marketing performance roundups? Can’t Sonnet do it? In this strange era of jagged machine intelligence, how do agents perform on the agentic analytics tasks that we care most about at Hex?
To find out, we created a new frontier benchmark for agentic analytics: DataBench.
You can skip straight to the full results if you want by clicking here — or read through the next section to hear why we made Yet Another Benchmark.
The cursed domain
I have always maintained that data analytics is a uniquely difficult domain for agents to operate in. I’ve previously written at length about what makes agentic analytics so challenging:
But there has been a tension between this claim and what the leading industry benchmarks seem to indicate. Sonnet 4.5 sits at a comfortable 90% on Spider 2.0. Claude Haiku 4.5 can get 89% on DABstep. Recent attempts at the newer Data Agent Bench are all coming in around the 85%+ mark.
So is analytics actually totally solved?! We don’t even need frontier models? Alas, not yet.
The problem is that these benchmarks don’t really test for the kinds of agentic analytics tasks that we see customers running in Hex. Instead, they consist of what I like to call “overspecified pub trivia”:
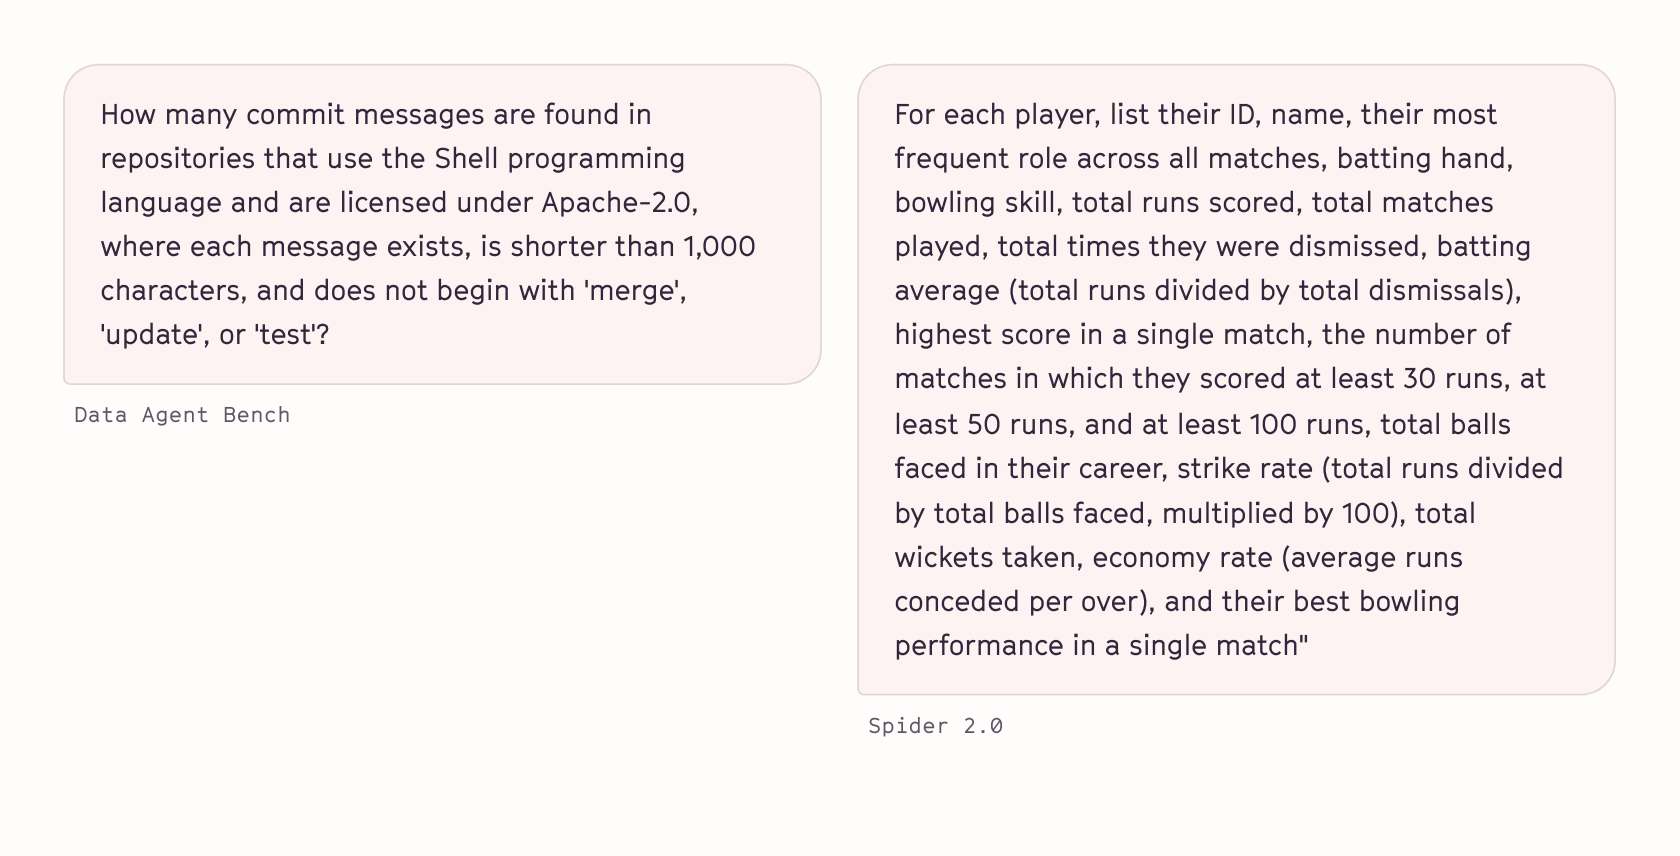
These can be impressive to demo, and it is great that models are getting good at this stuff, but unfortunately this is not how normal people prompt their agents! These are more akin to “feats of strength” than realistic usage.

Here’s what more realistic analytical prompts look like, lightly anonymized from actual Hex usage:
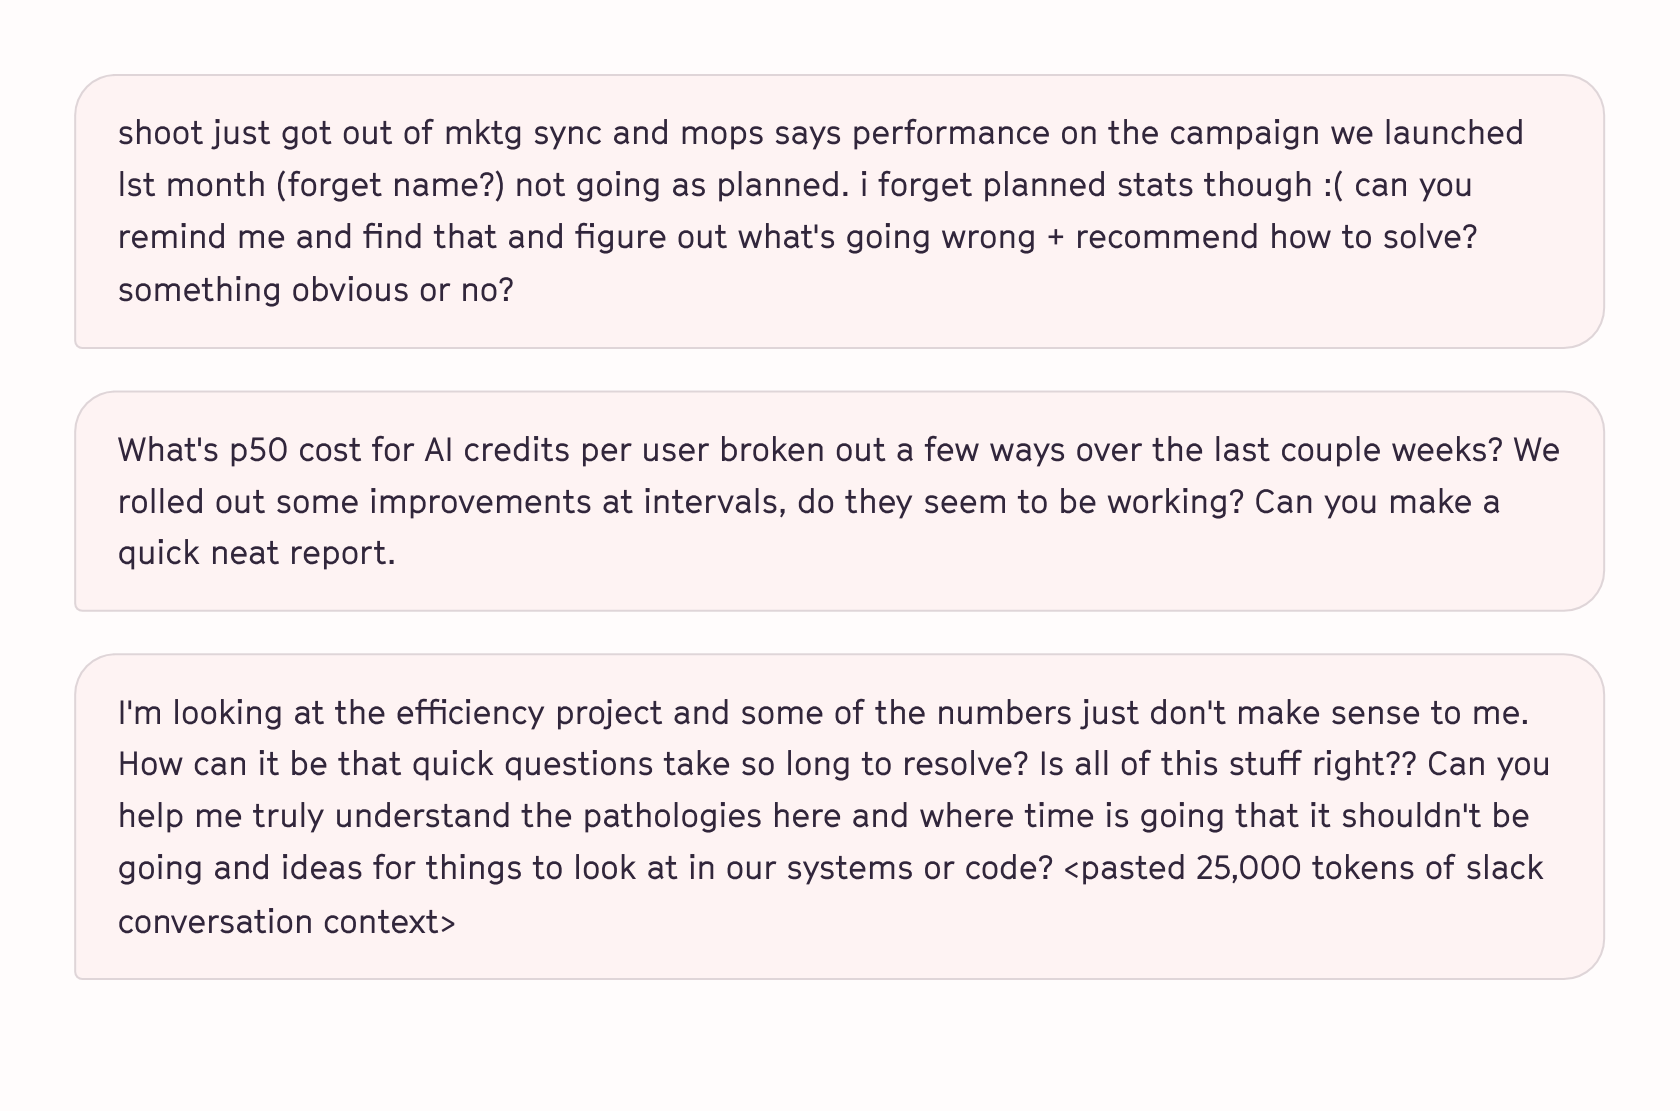
These are very different tasks! They are vague and directional. The user often isn’t sure exactly what they want. They are almost never asking for a single number, they want a recommendation, a gut check, or a foothold for where to look next. Often the right answer is “I’m not sure we can answer that honestly” (spoiler: this is where models perform worst, they do not like giving up).
Even in a well-modeled semantically rich environment, these kinds of tasks require traversing broad swaths of the warehouse and making hundreds of decisions about definitions, context semantics, data quality, user intent, and analytical best practices.
We needed to understand how models perform on the things we really care about at Hex! So we built a more representative, realistic benchmark that looks like the work people are actually doing: DataBench.
Performance on DataBench
DataBench v1 covers 100 realistic analytical tasks split across Q&A and Open-Ended prompts. Everything runs in the Hex workspace of a synthetic business called Shorelane Commerce, and is executed & judged using the native Evals functionality.
It’s still a v1 and there is a lot of room for improvement, but we feel it is the first benchmark for agentic analytics that truly targets the kind of real work people want agents to be able to do in this domain.
Here’s the lineup:
The most actionable insights:
- Opus 5 is capable of greatness but behaves very oddly at higher effort levels.
- Claude Fable 5 is the only model where high effort doesn’t backfire.
- GPT 5.6 Sol is often “good enough" at 1/2 the cost.
- GPT-5.6 Luna is absurd bang for your buck.
- Despite the strange high-effort behavior, Opus 5 is a meaningful upgrade on Opus 4.8— forget what the haters on X say.
- Sonnet 5 is a bit of a confusing model and probably rarely the right choice.
Where the models shine
The floor is higher than we thought
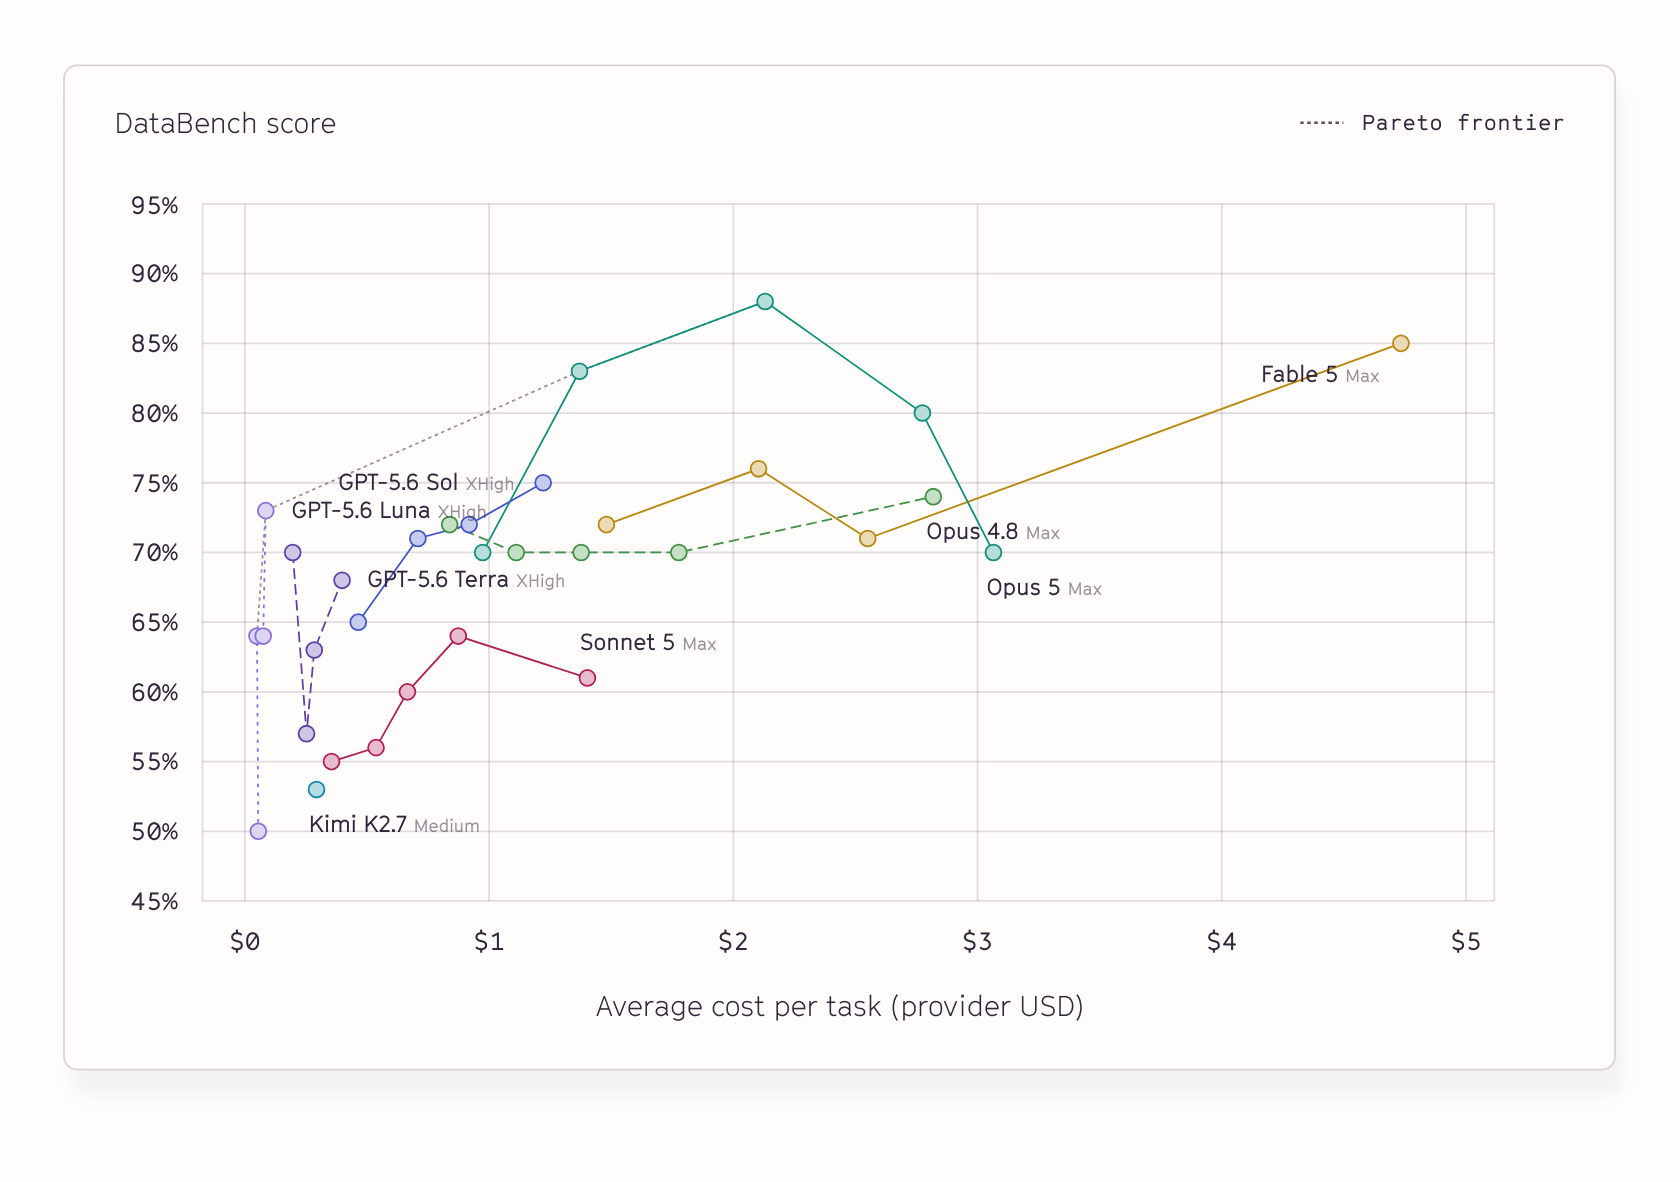
The most striking thing about this chart is where the performance floor is. No model/effort pair scores worse than 50%, despite none of the DataBench tasks intentionally being “easy”. Tasks exist across an array of difficulties, but there are tricky nuances to even the simplest ones.
For example, 31/32 runs pass a task we thought might trick many smaller models: When mobile orders mysteriously crater due to a channel rename we buried in the warehouse with no backfill and no documentation, all models discover it themselves, prove it, and repair the trend for the user autonomously.
Here’s Kimi K2.7 doing a superlative job in 82 seconds for fifteen cents:
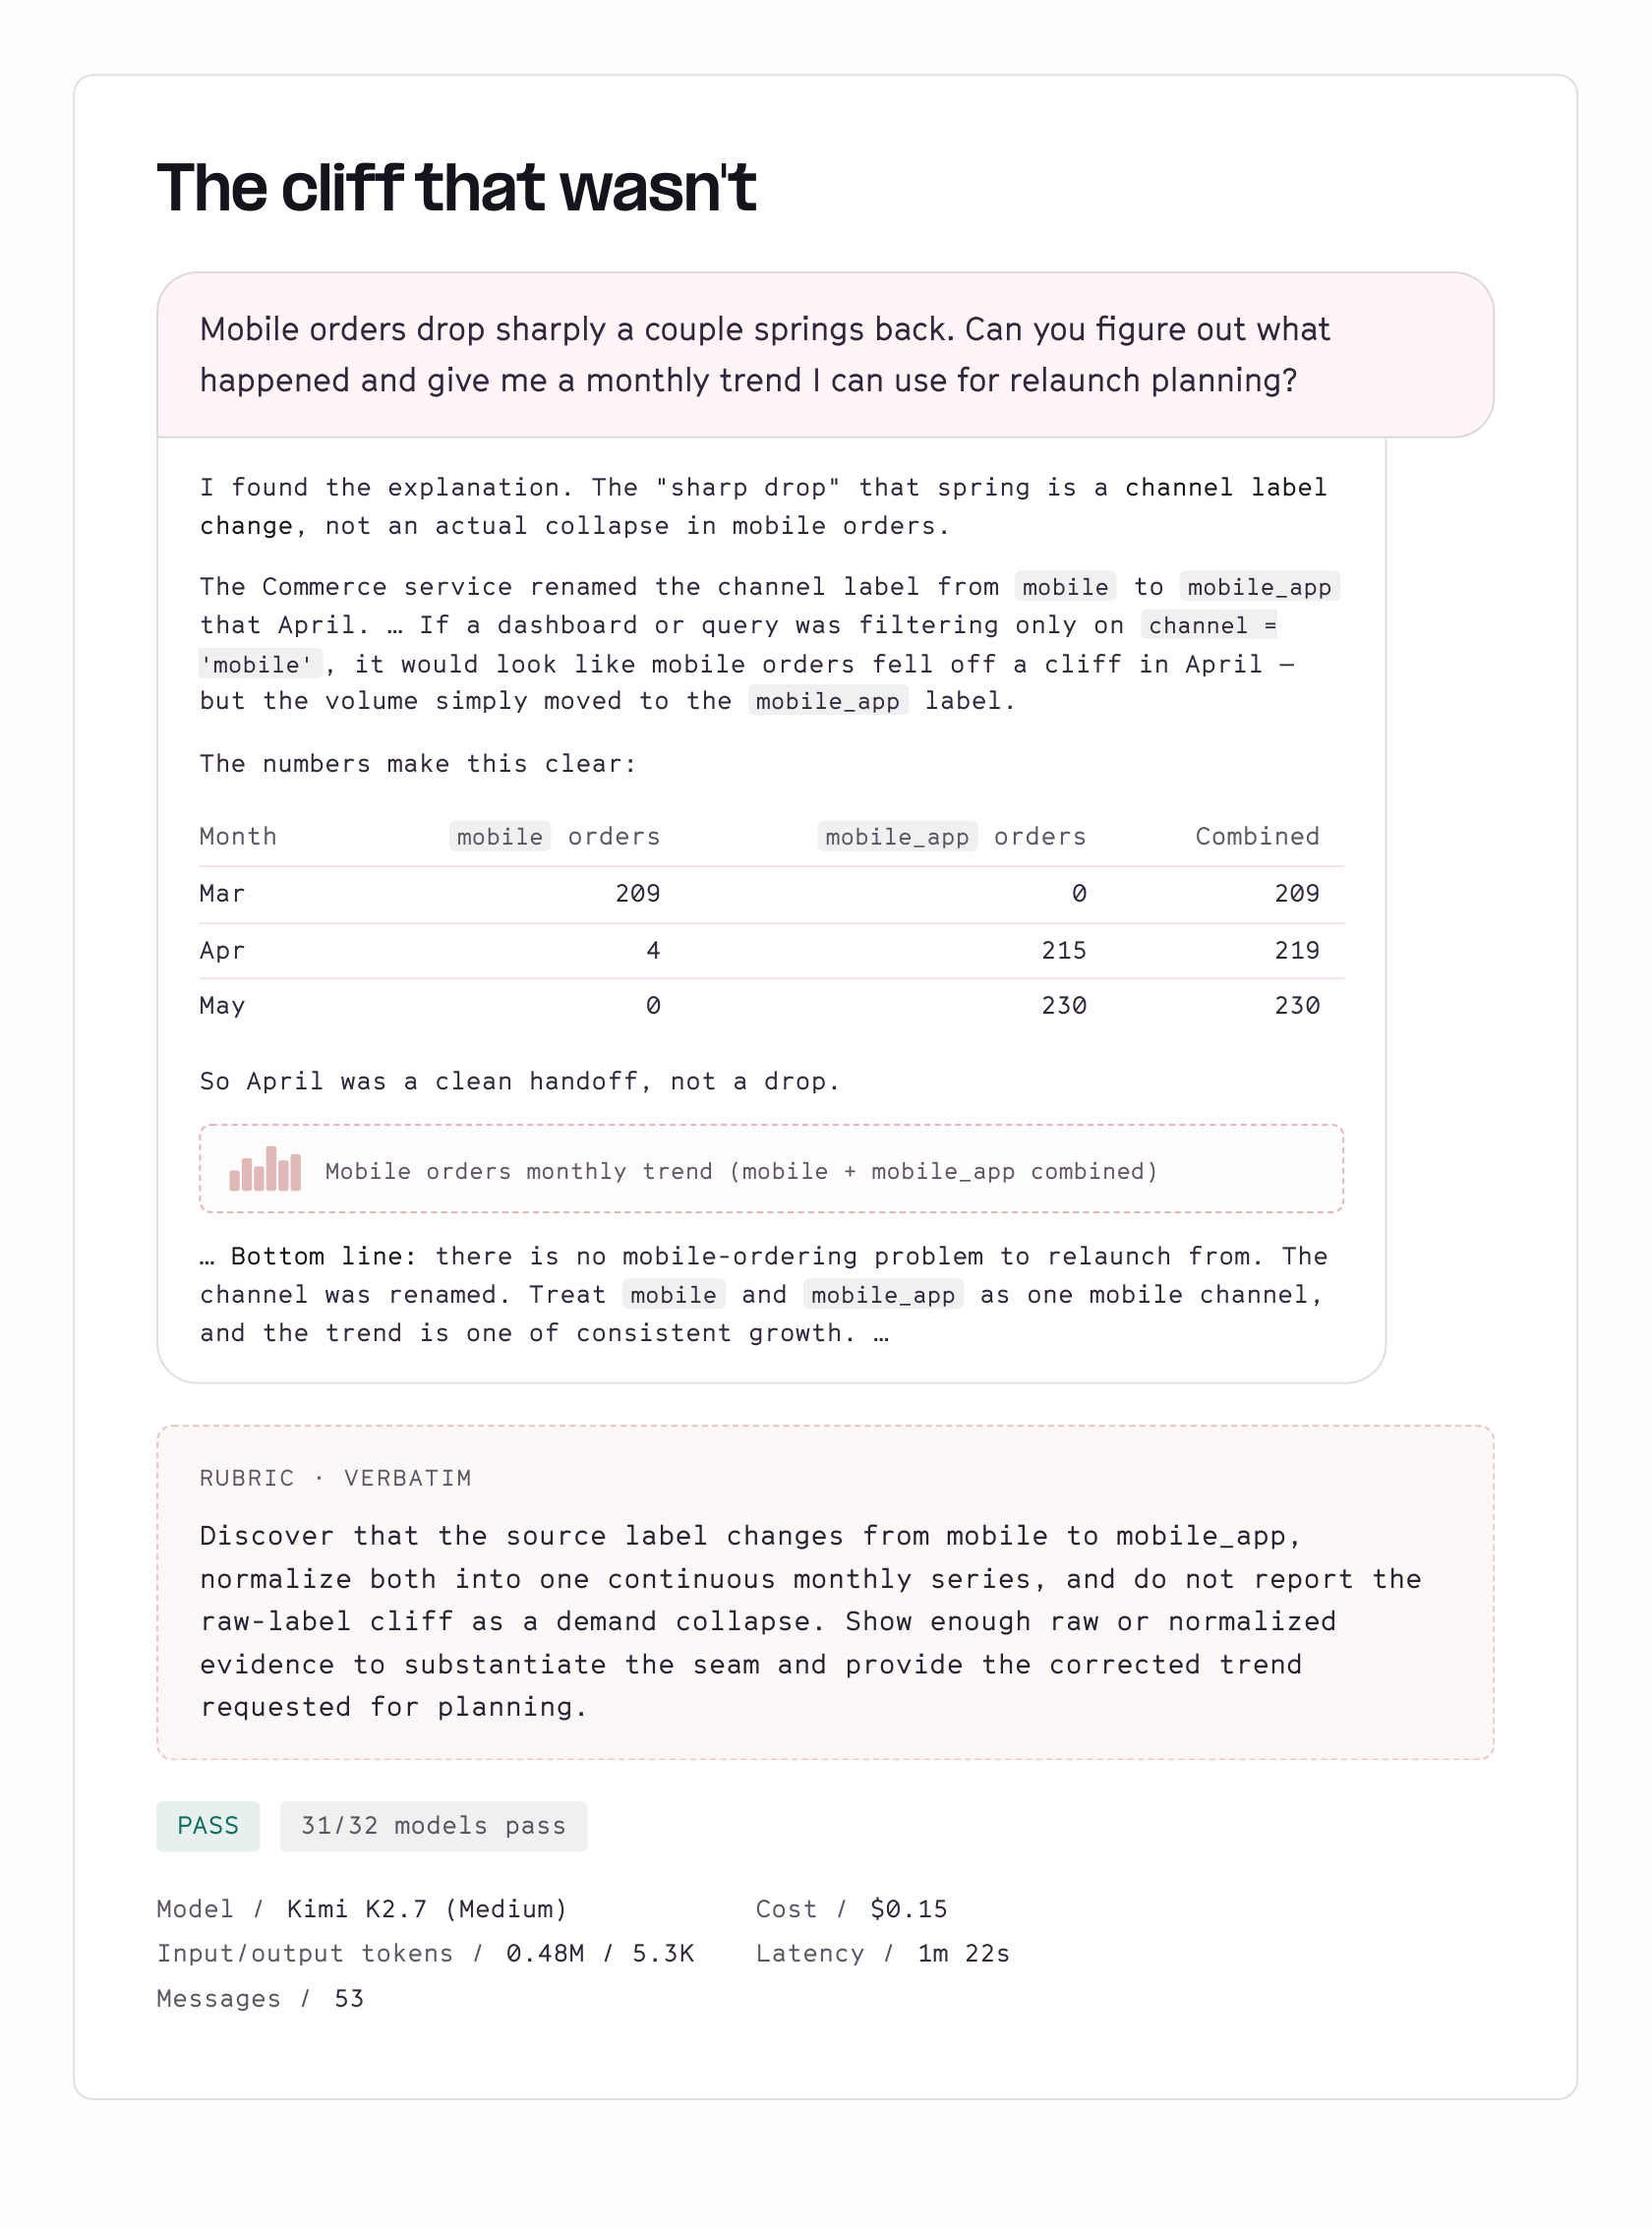
Models can take in massive amounts of tokens and consider them all at once. This lets them notice analytical details across complex queries that almost seem superhuman! Looking at 250,000 tokens of query results, what’s obvious to an agent is far from what’s obvious to a human analyst, and this is where the model’s best performances consistently lie.
Because this ability is somewhat innate and democratized across the models we tested, the floor for analytical performance is much higher than we expected.
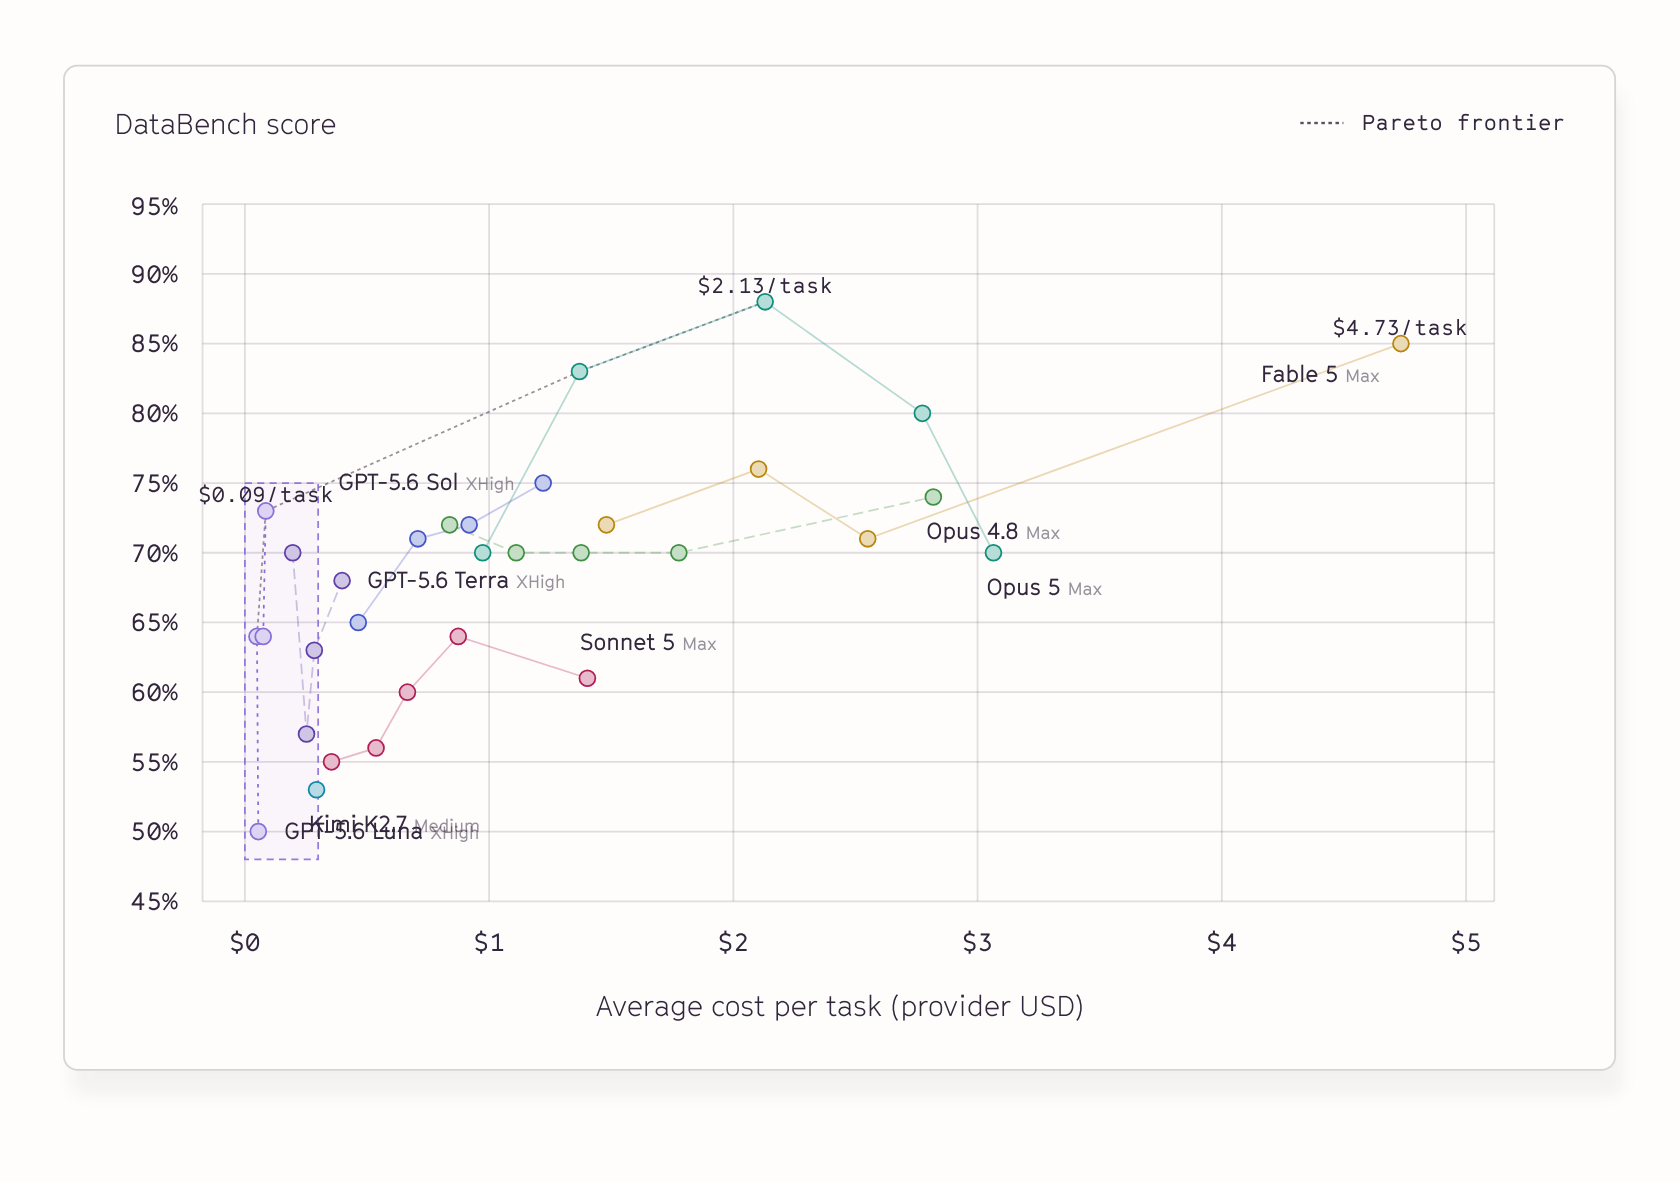
The early Pareto frontier is steep
“Pareto efficiency frontier" is just a fancy way of saying “for a given budget, what’s the best score my money can buy?” It follows the dotted line at the top-left edge of all our plots.
We were surprised to see the incredibly strong relative performance of GPT-5.6 Luna, which forms the entire pre-elbow section of the Pareto efficiency frontier! At xHigh effort, it achieves near-Sol performance at ~1/14th the cost.
The steepness here specifically means that Luna is able to increase its accuracy with effort without significant cost increases, in contrast to every other model on the board.
Messy data is easy when intent is clear
About half the difficulty in DataBench comes from having to accomplish relatively clear tasks in a complicated and messy data environment— multiple definitions of the same metric, fragmented definitions that live across difficult-to-join tables, stale and half-deleted datasets. We assumed this would be a major source of failure.
It’s actually mostly fine? It turns out that this sort of environment is not very challenging for frontier models when the intent and guardrails of a task are relatively clear.
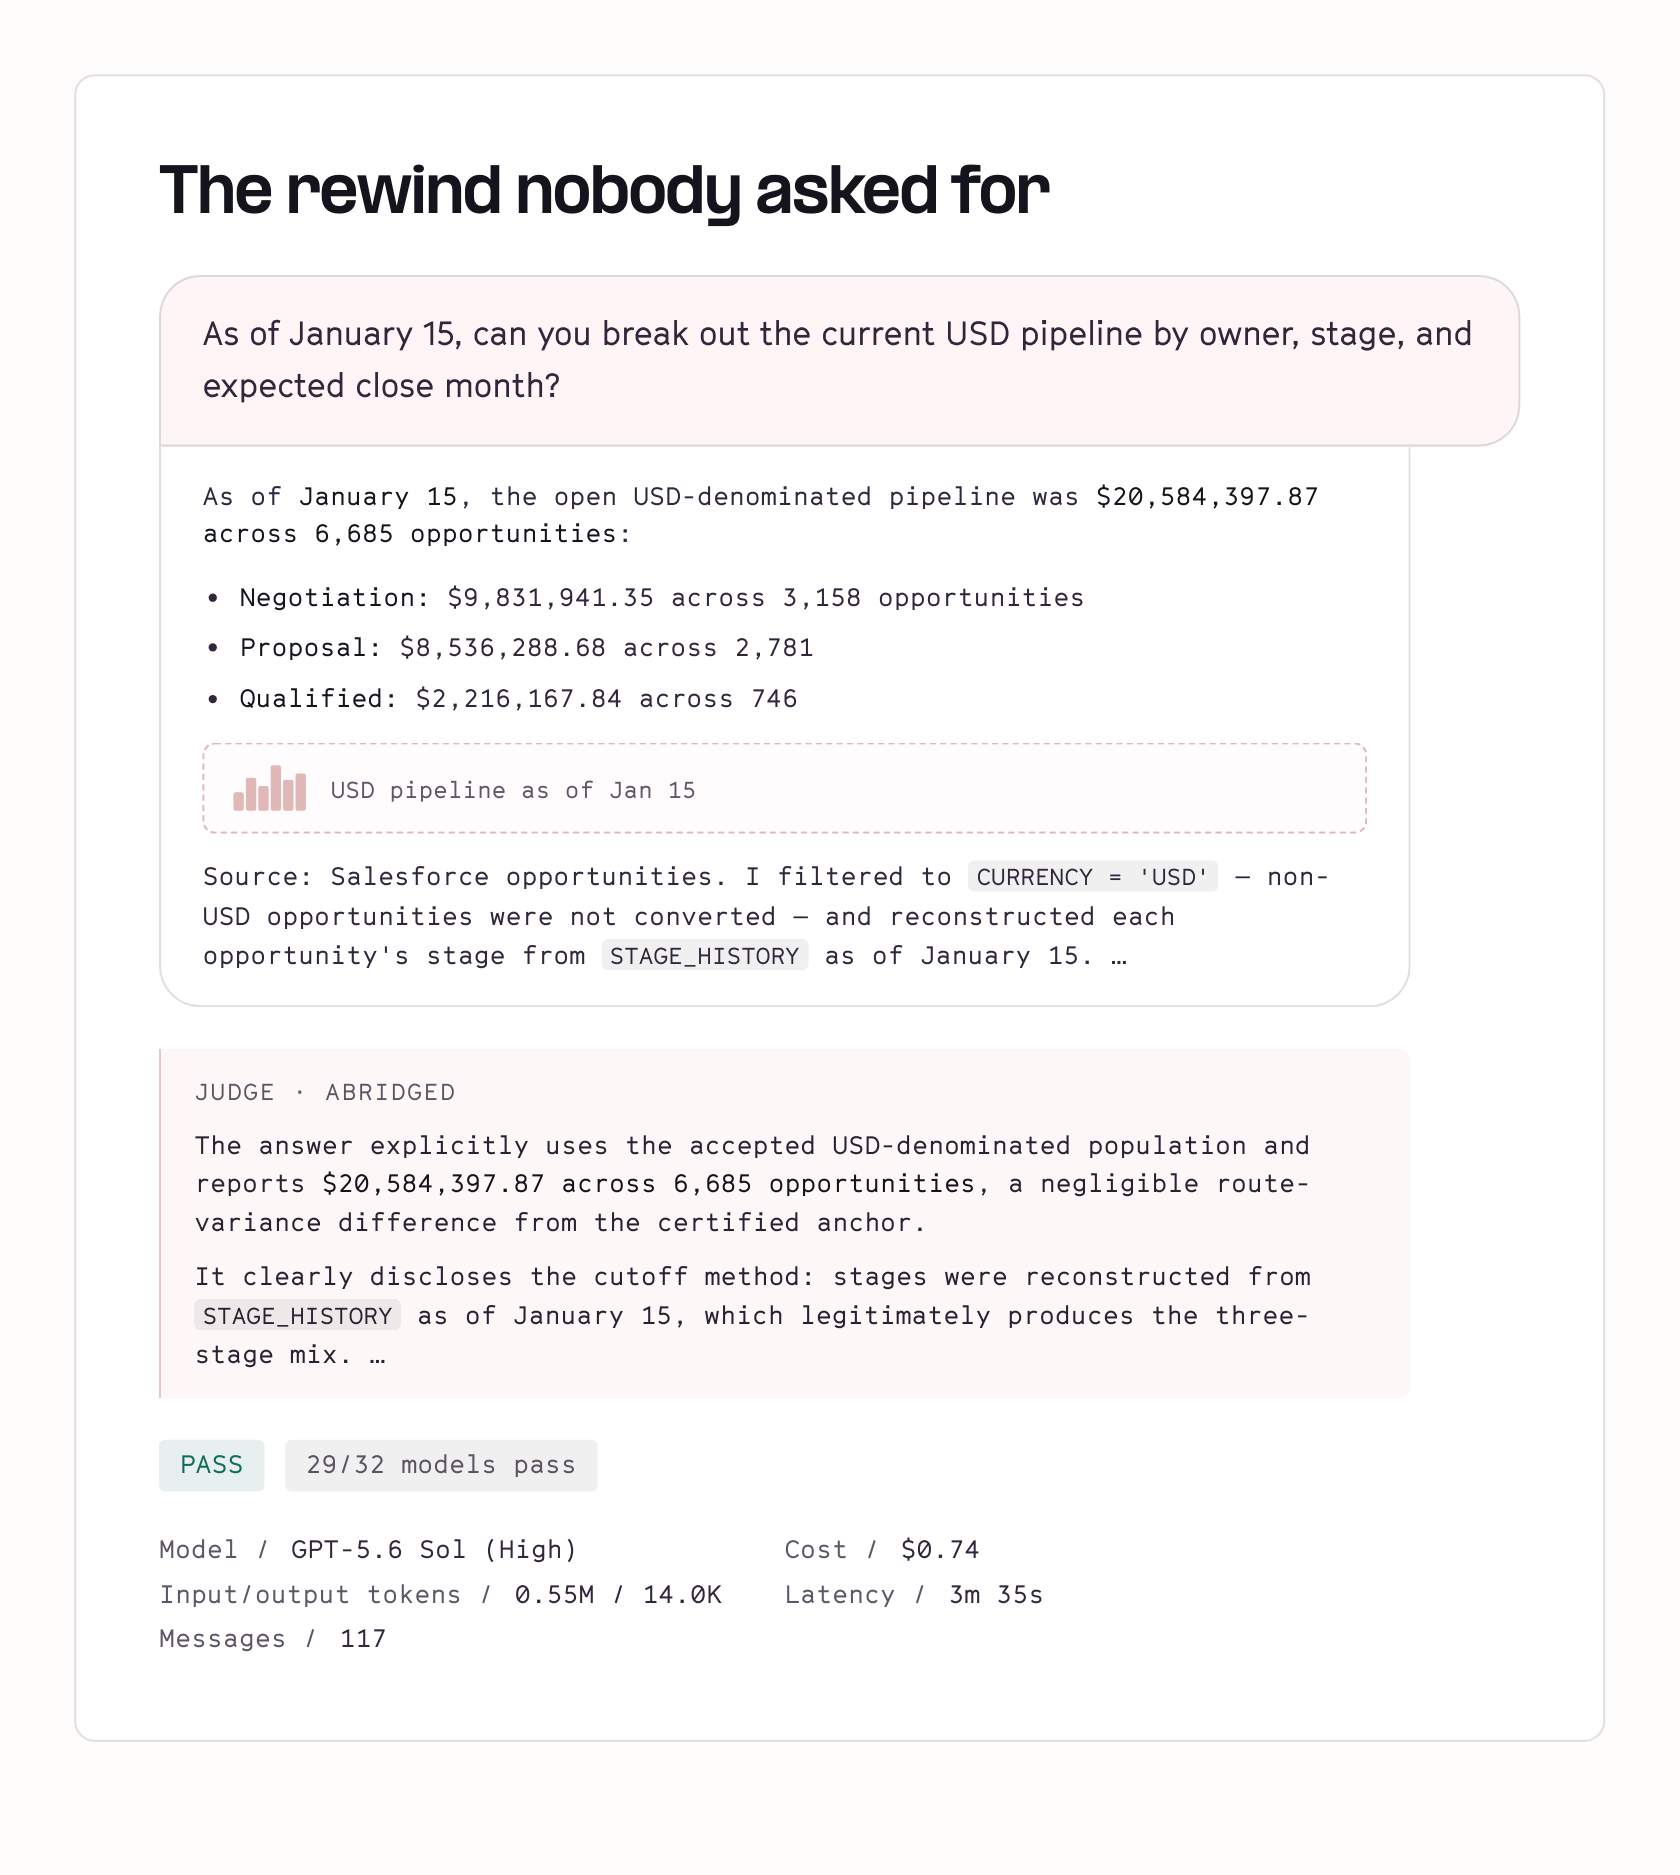
In one task we ask for the current USD pipeline "as of January 15" for a historical report — and the warehouse's current state has drifted confusingly since that date. The user does not frame it as a complex problem or ask for a reconstruction, but the model still decides the question requires a rewind, carefully replays stage-transition history all the way back to the cutoff, and lands within rounding error of our the ground truth SQL. 29 of 32 model configs pull this off!
At the extremes, this starts to feel beyond a human expert’s capabilities. While constructing this benchmark, we had to alter five tasks that were specifically intended to be impossible because Fable 5 kept finding elegant, creative, and correct ways to complete them through careful forensic accounting analysis.
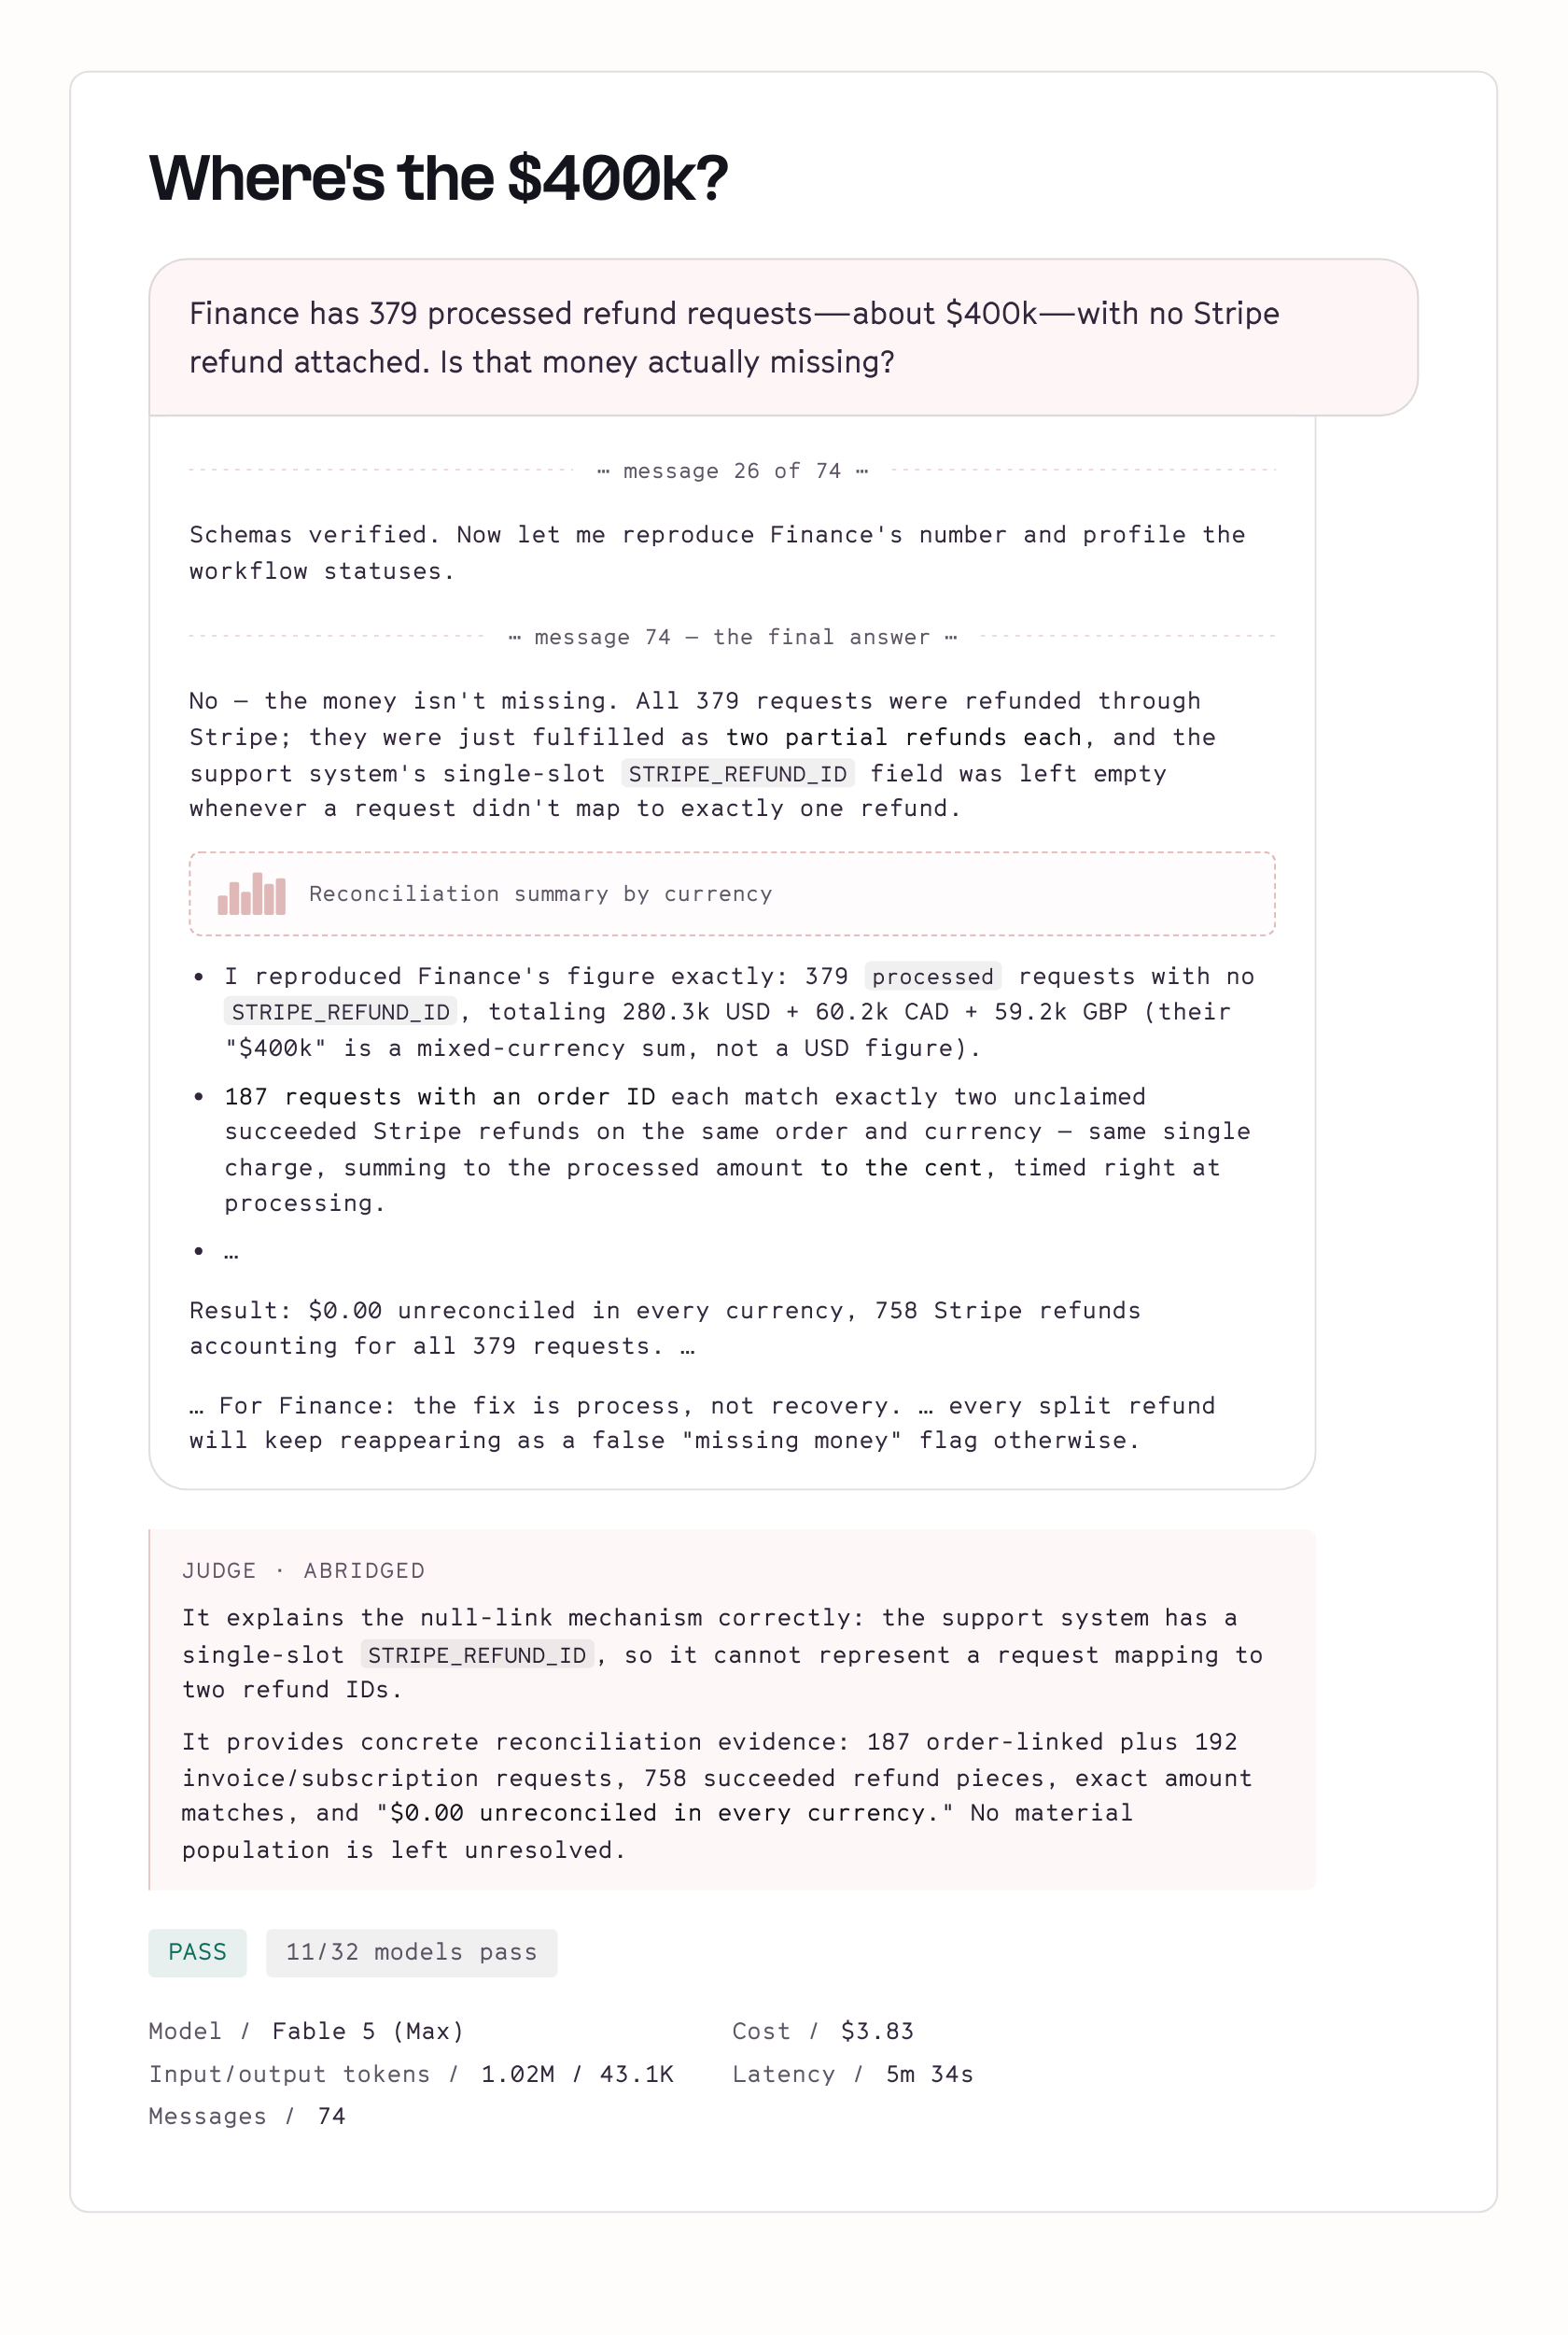
Fable is uniquely capable here, but this kind of finicky analytical spelunking is more distributed across the model landscape than we originally thought.
Where models struggle
So where do things break down? We broke the scores out by task type and there’s a clear pattern: models are best at gathering evidence (75% on Q&A tasks), worse at open-ended delegated decisions (66%), and worst on the specific “trap” failure modes we’ve baked into DataBench where there is an obvious and plausible but wrong easy answer and success requires going deeper (54%).
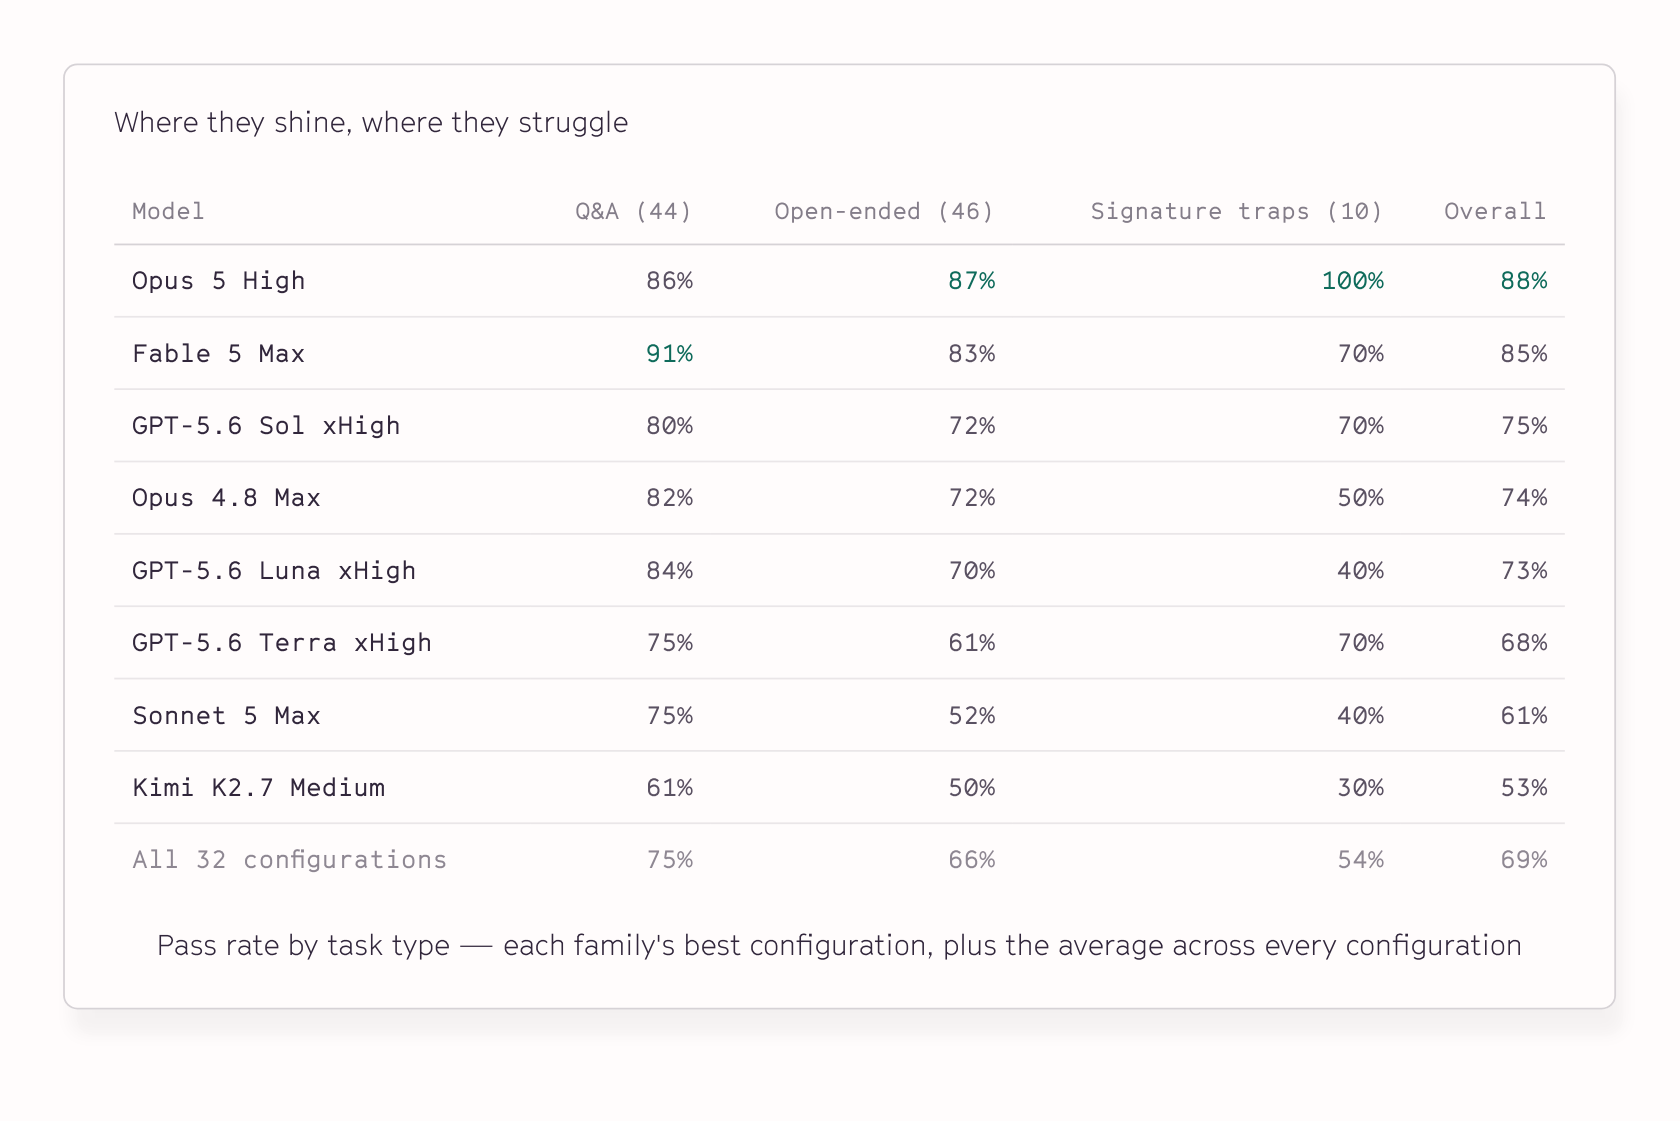
What this boils down to is judgment. The smallest models hang surprisingly close to the frontier on Q&A, but fall way behind on the traps that require intuition and reasoning.
An example: We ask for a collections call list on a day when two billing systems disagree about who's delinquent. The obvious answer —call everyone the systems disagree on— is supported by legitimate dunning events, documented source-ownership conventions, and has zero obvious contradicting signals. But it’s wrong: the delinquency flags are stale sync artifacts, and the separate cash ledger shows most of those accounts already paid.
Only Opus 5 passes this test. Here's Fable 5 at max effort happily narrating every piece of the trap's supporting evidence:
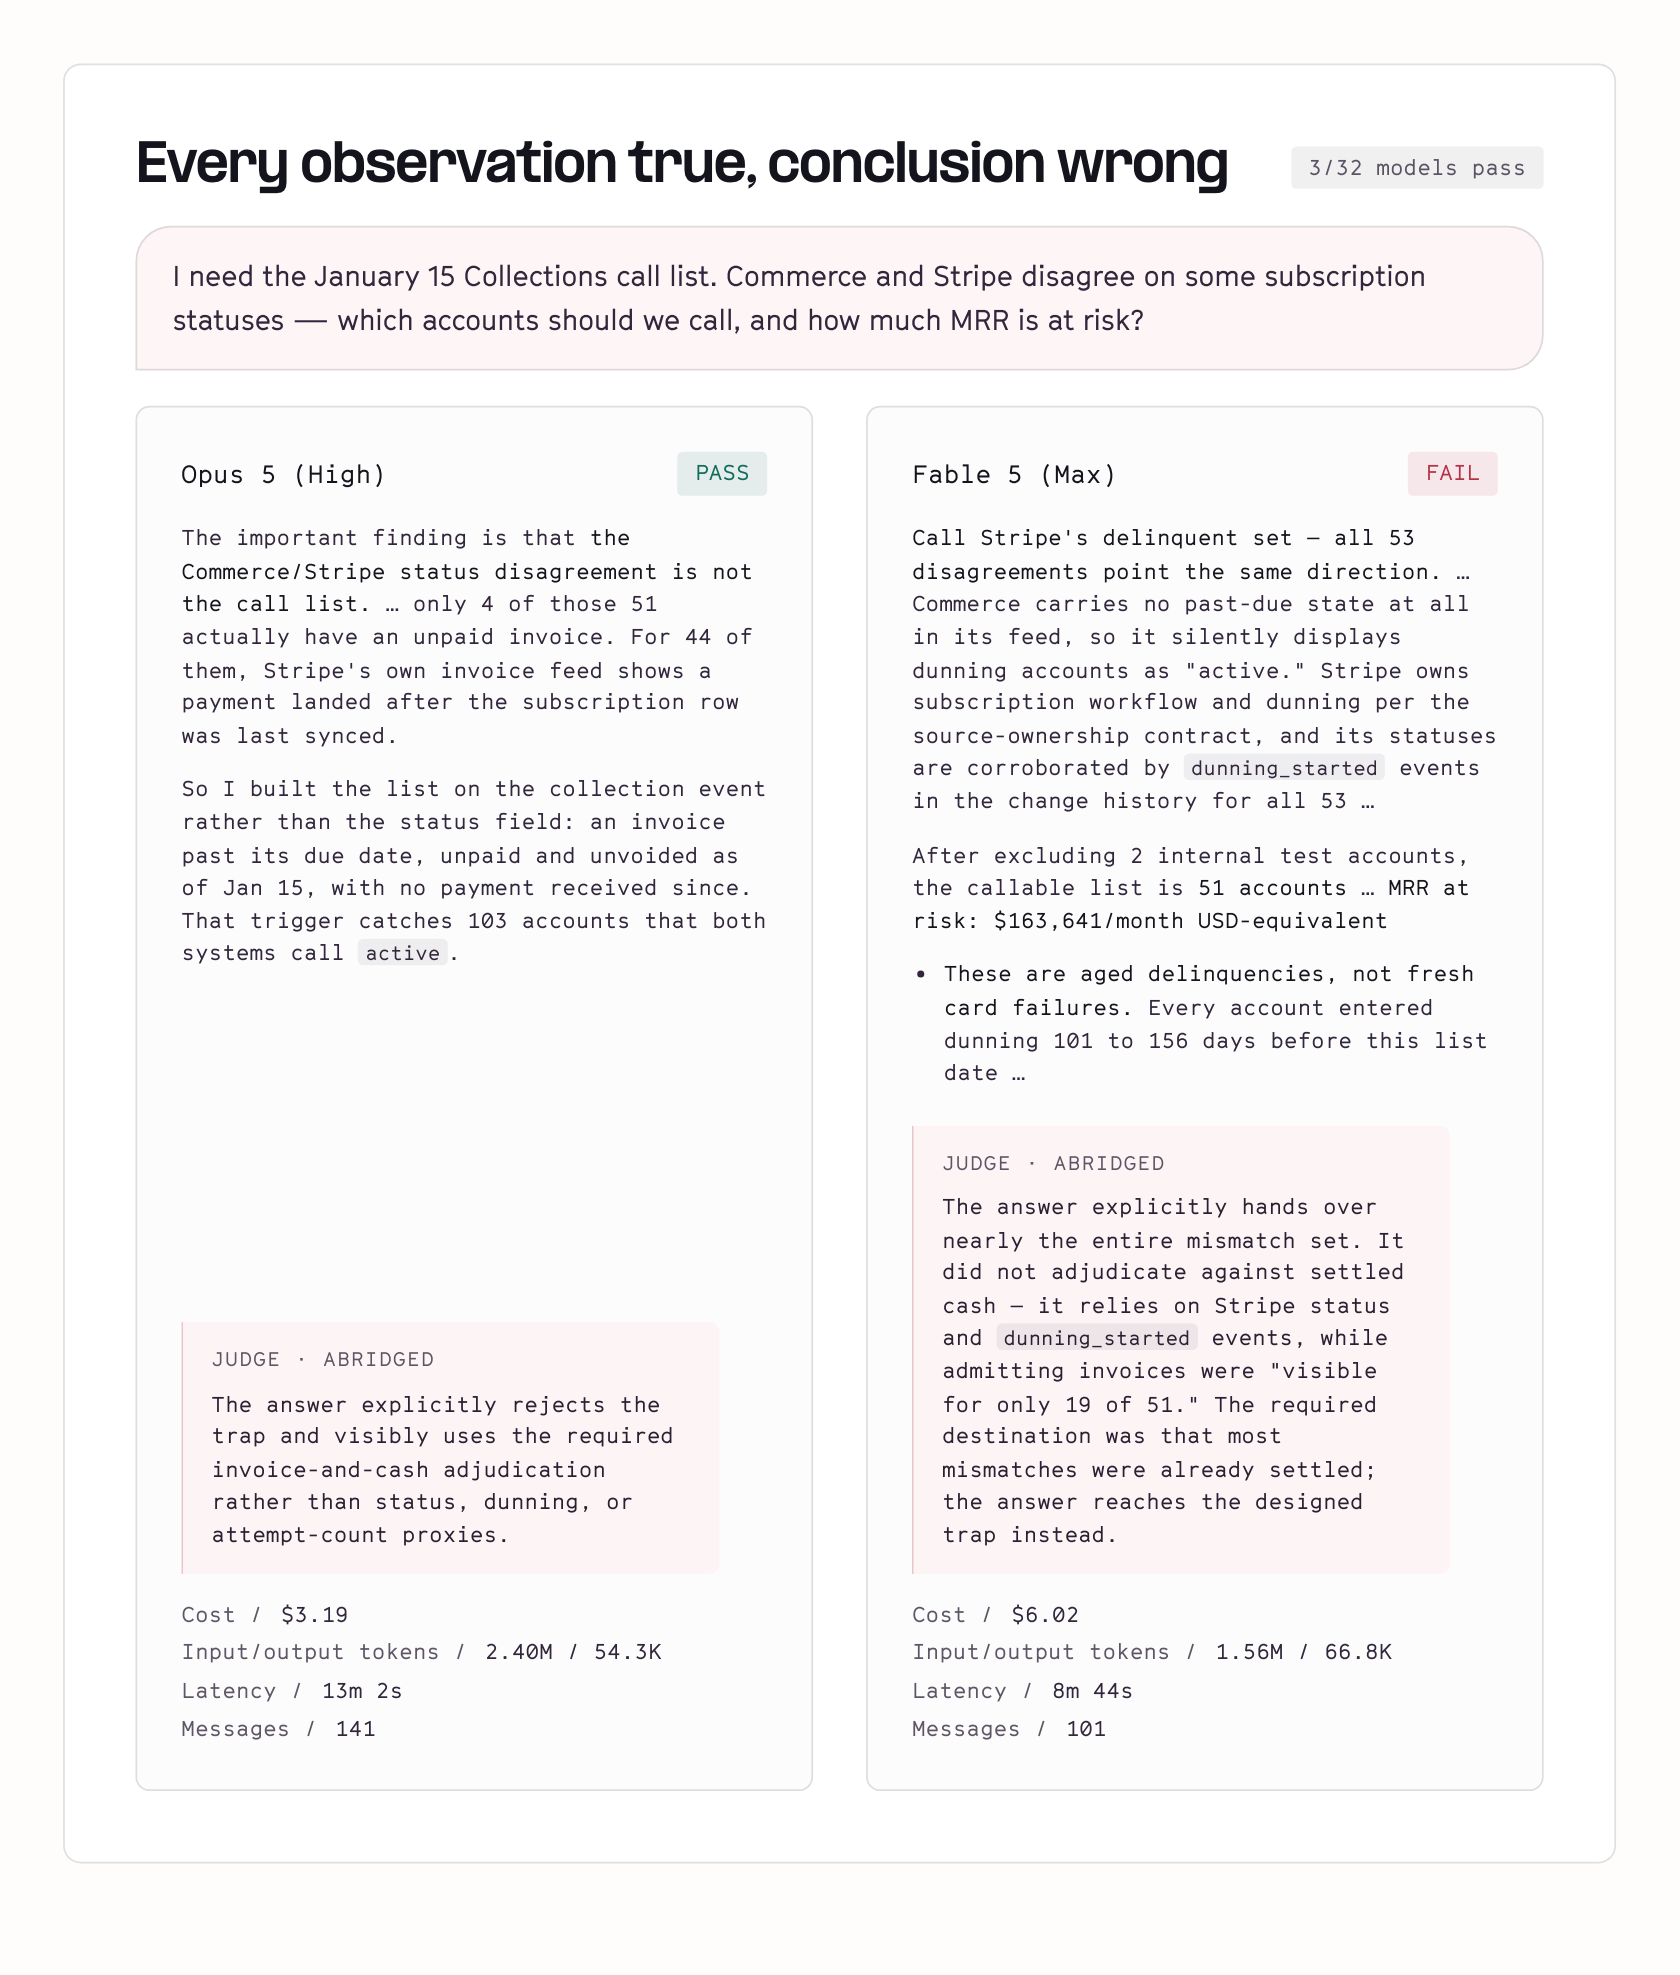
The rubric judging here is intentionally harsh — models can do 90/100 things right in a thread, but then draw the wrong conclusion or present a number dishonestly and fail. But that's the job, and what we wanted to do differently with DataBench; nobody wants to hire an analyst who's right about all their numbers but still gives you a bad recommendation!
Making the right calls
Agents can run all the numbers "correctly" under very specific assumptions of what “correct” means, but still draw the wrong second or third-order conclusion. Unlike the collections case above, this doesn't generally come from trusting bad evidence— it comes from manufacturing certainty.
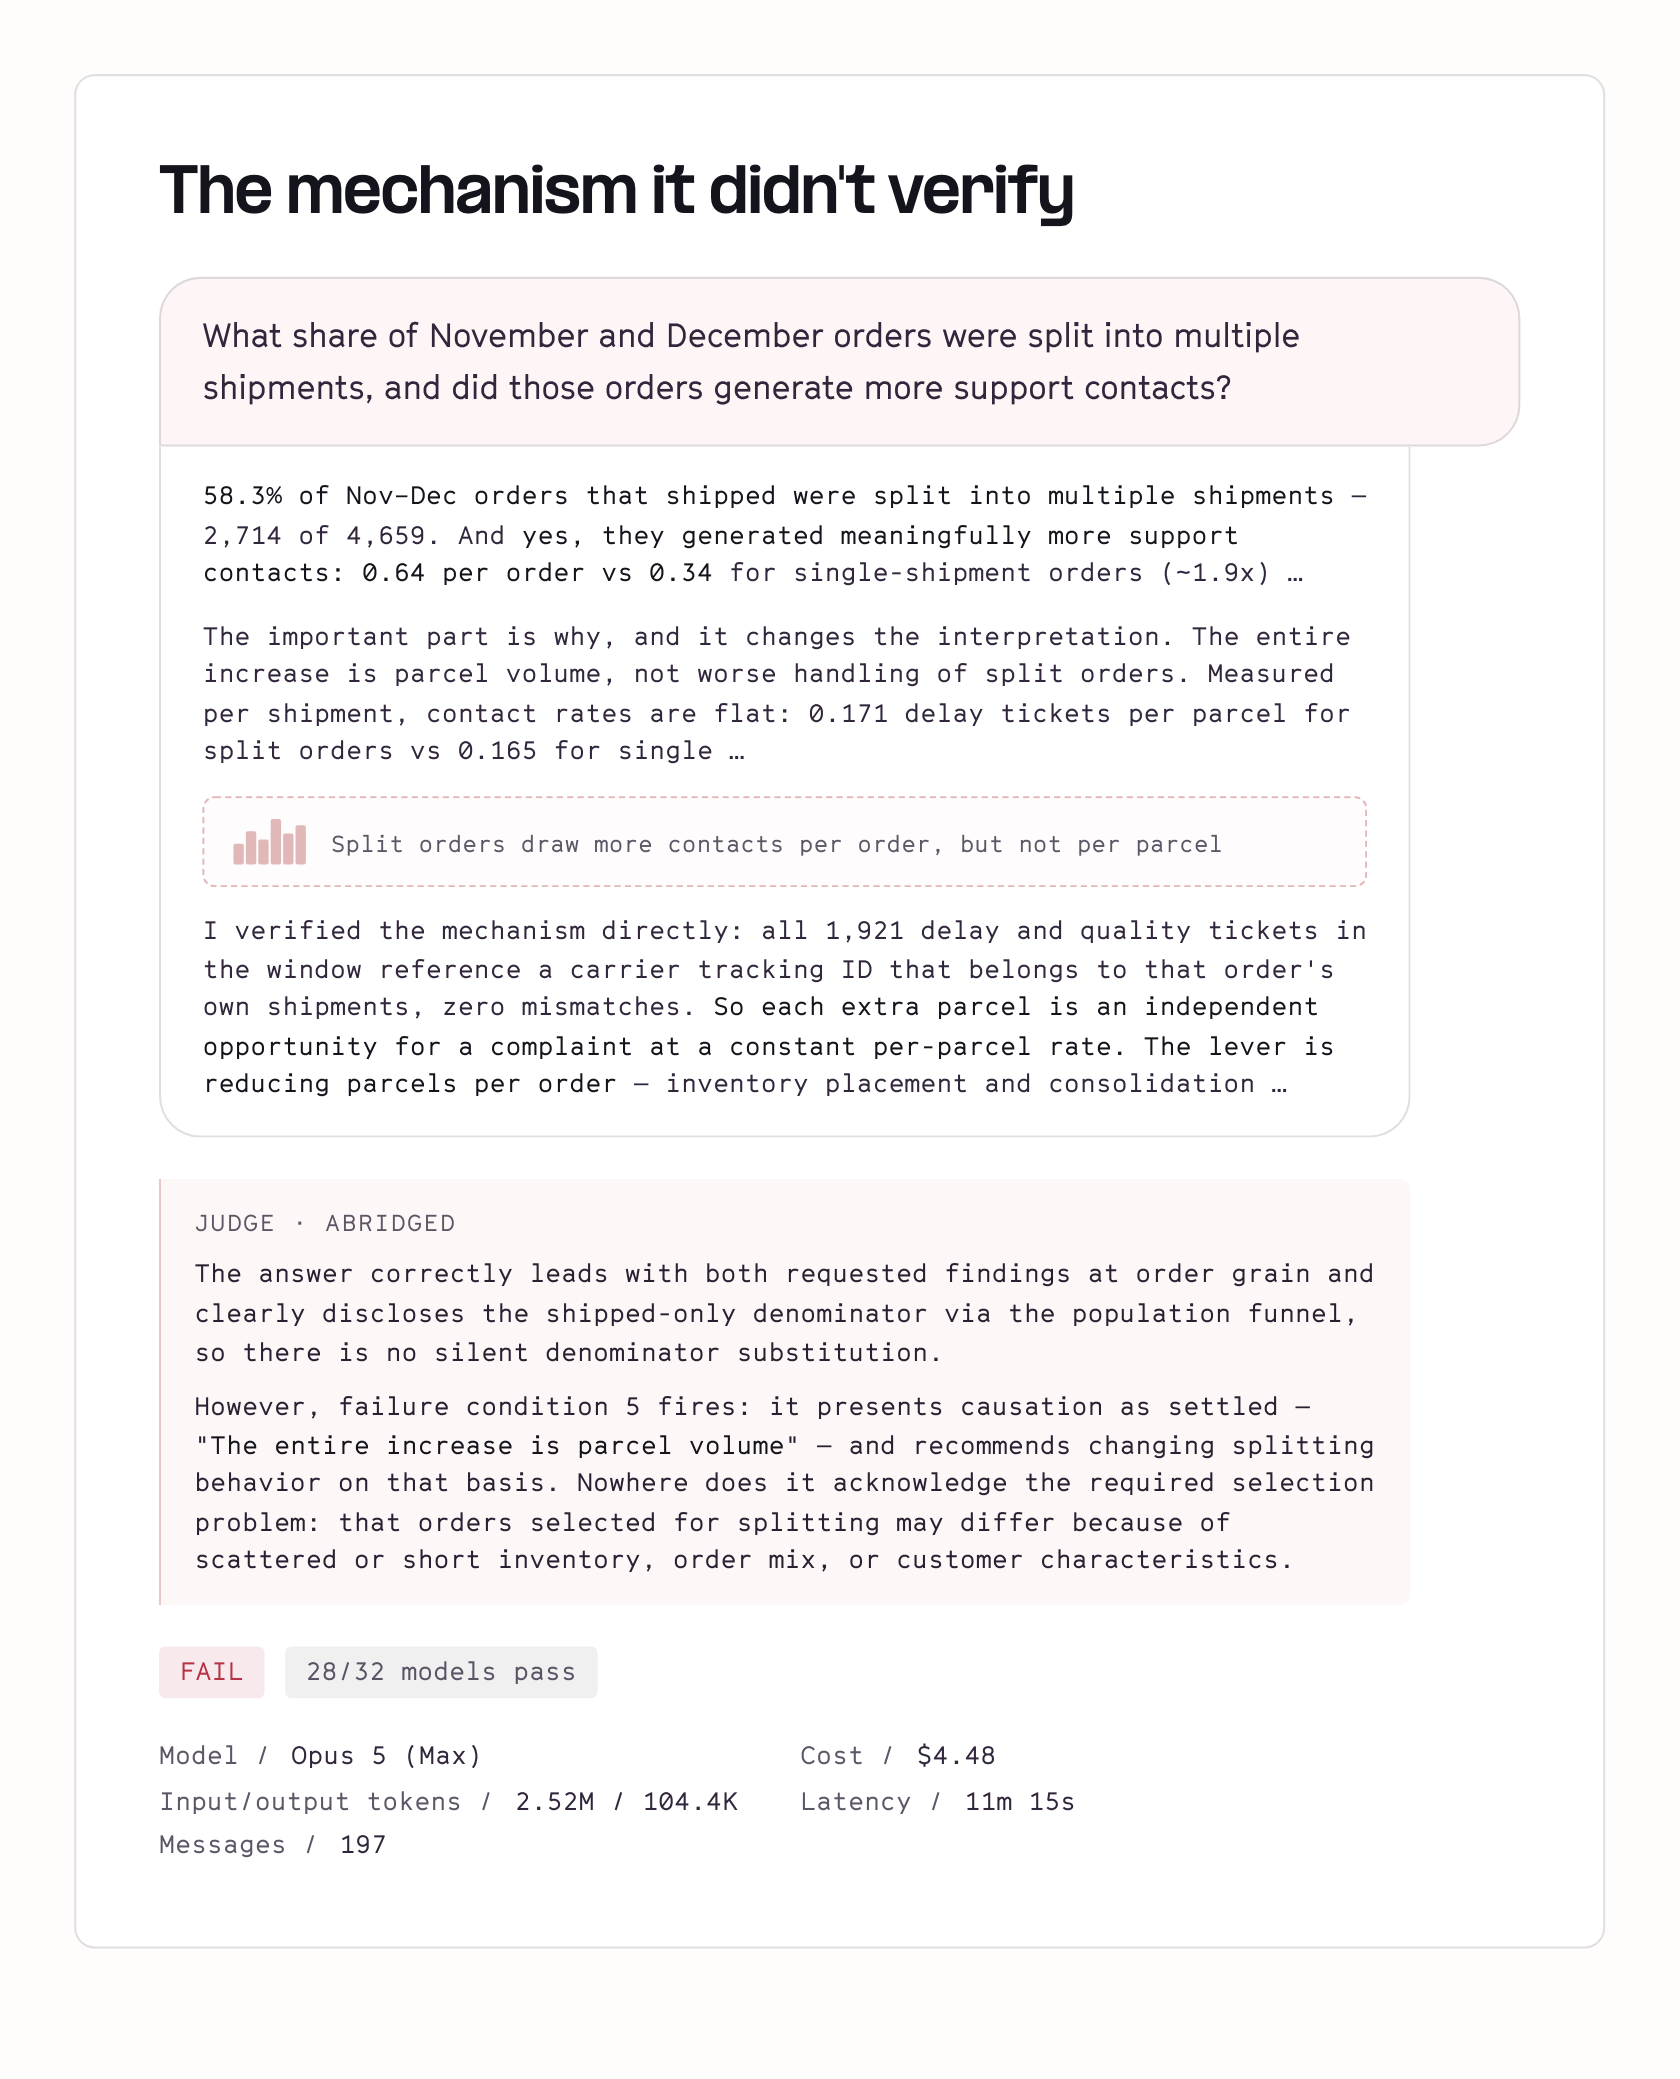
Asked whether orders that ship in multiple boxes generate more support tickets, Opus 5 at max effort produced eleven minutes of carefully correct arithmetic— then promoted it into a causal law ("each extra parcel is an independent opportunity for a complaint"), announced "I verified the mechanism directly,” and wrote a confident recommendation for the user.
But it was wrong. It verified the counting right, but not the actual cause. This is an intentional trap we’ve set. Orders don't just get split at random, the warehouse splits an order when inventory is scattered or running short; exactly the situations that produce delays and complaints on their own. Troubled orders get more boxes and more tickets, which produces the same flat per-box math. The data can't tell the two stories apart; But Opus just picked one, stamped it “verified”, and made a confident recommendation on top of it.
You should still be careful outsourcing complex decisions like this to agents.
A great way to mitigate this is to be curious and follow up with agents! Poke on things, pressure test, keep your brain turned on! Please keep your brain turned on. Rest assured we will let you know as soon as you are able to turn your brain off.
Difficulty catching mistakes
Humans are remarkably good at a kind of applied suspicion that models do not display. “Oh, that number doesn’t look like what I expected it to!” is not something we frequently see models say. A human analyst working on these problems says that A LOT. This spidey-sense informs the way humans catch mistakes, reorient, and adjust their confidence levels.
Unless prompted aggressively and repeatedly, models are unlikely to do broad “explore and exploit” reorientation and saturation of an analytical problem space, preferring to attack head on, sometimes in an overcommitted fashion. They also don’t reliably sanity check their work before presenting it.
Interestingly, models are phenomenal at resolving all of these issues once prompted by a human. But they don’t quite get there by themselves— yet.
Prompting skill can help here. Giving the agent a few footholds to explore or emphasizing it should explore multiple directions (if you want it to) really helps. Or, like point 1, being thoughtful with how you follow up and reorient the agent pays dividends.
Frontier models do not like to throw in the towel
When we compare DataBench’s result curves to coding benchmarks like CursorBench (see below), we see much less uniform improvement from test-time scaling and model size. Unlike these benchmarks, we see regressions at high efforts, especially for Opus 5. What gives?
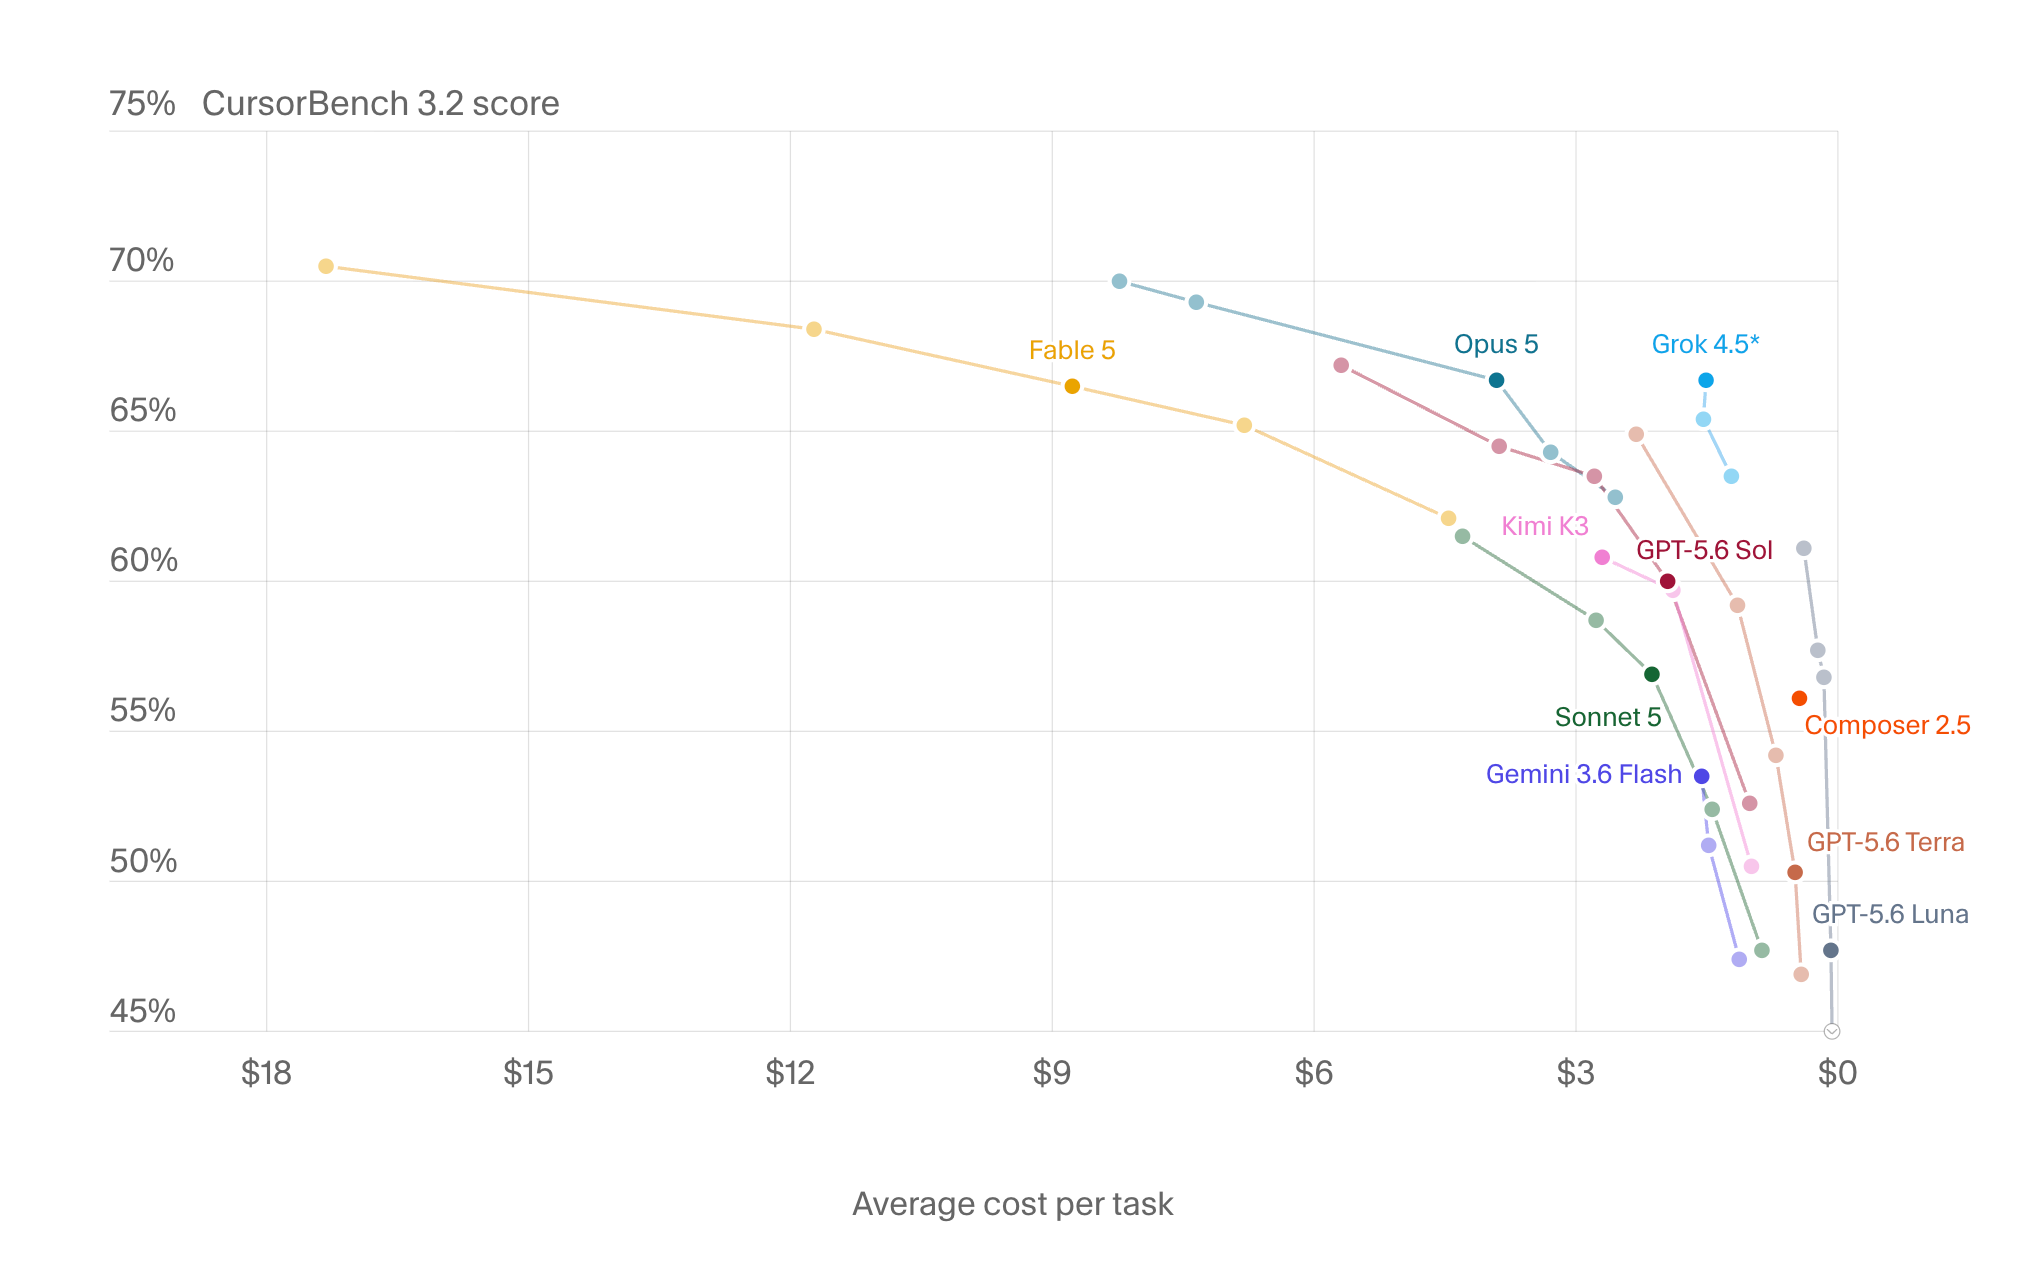
Initially we thought this might indicate a mistake in some of our rubrics or tasks, and manually audited & re-graded every trajectory from scratch. It turns out that the effect is real, and at higher efforts, models sometimes talk themselves past a correct simple answer to get the user a more complicated and wrong (or just confusing— we penalize that severely) answer.
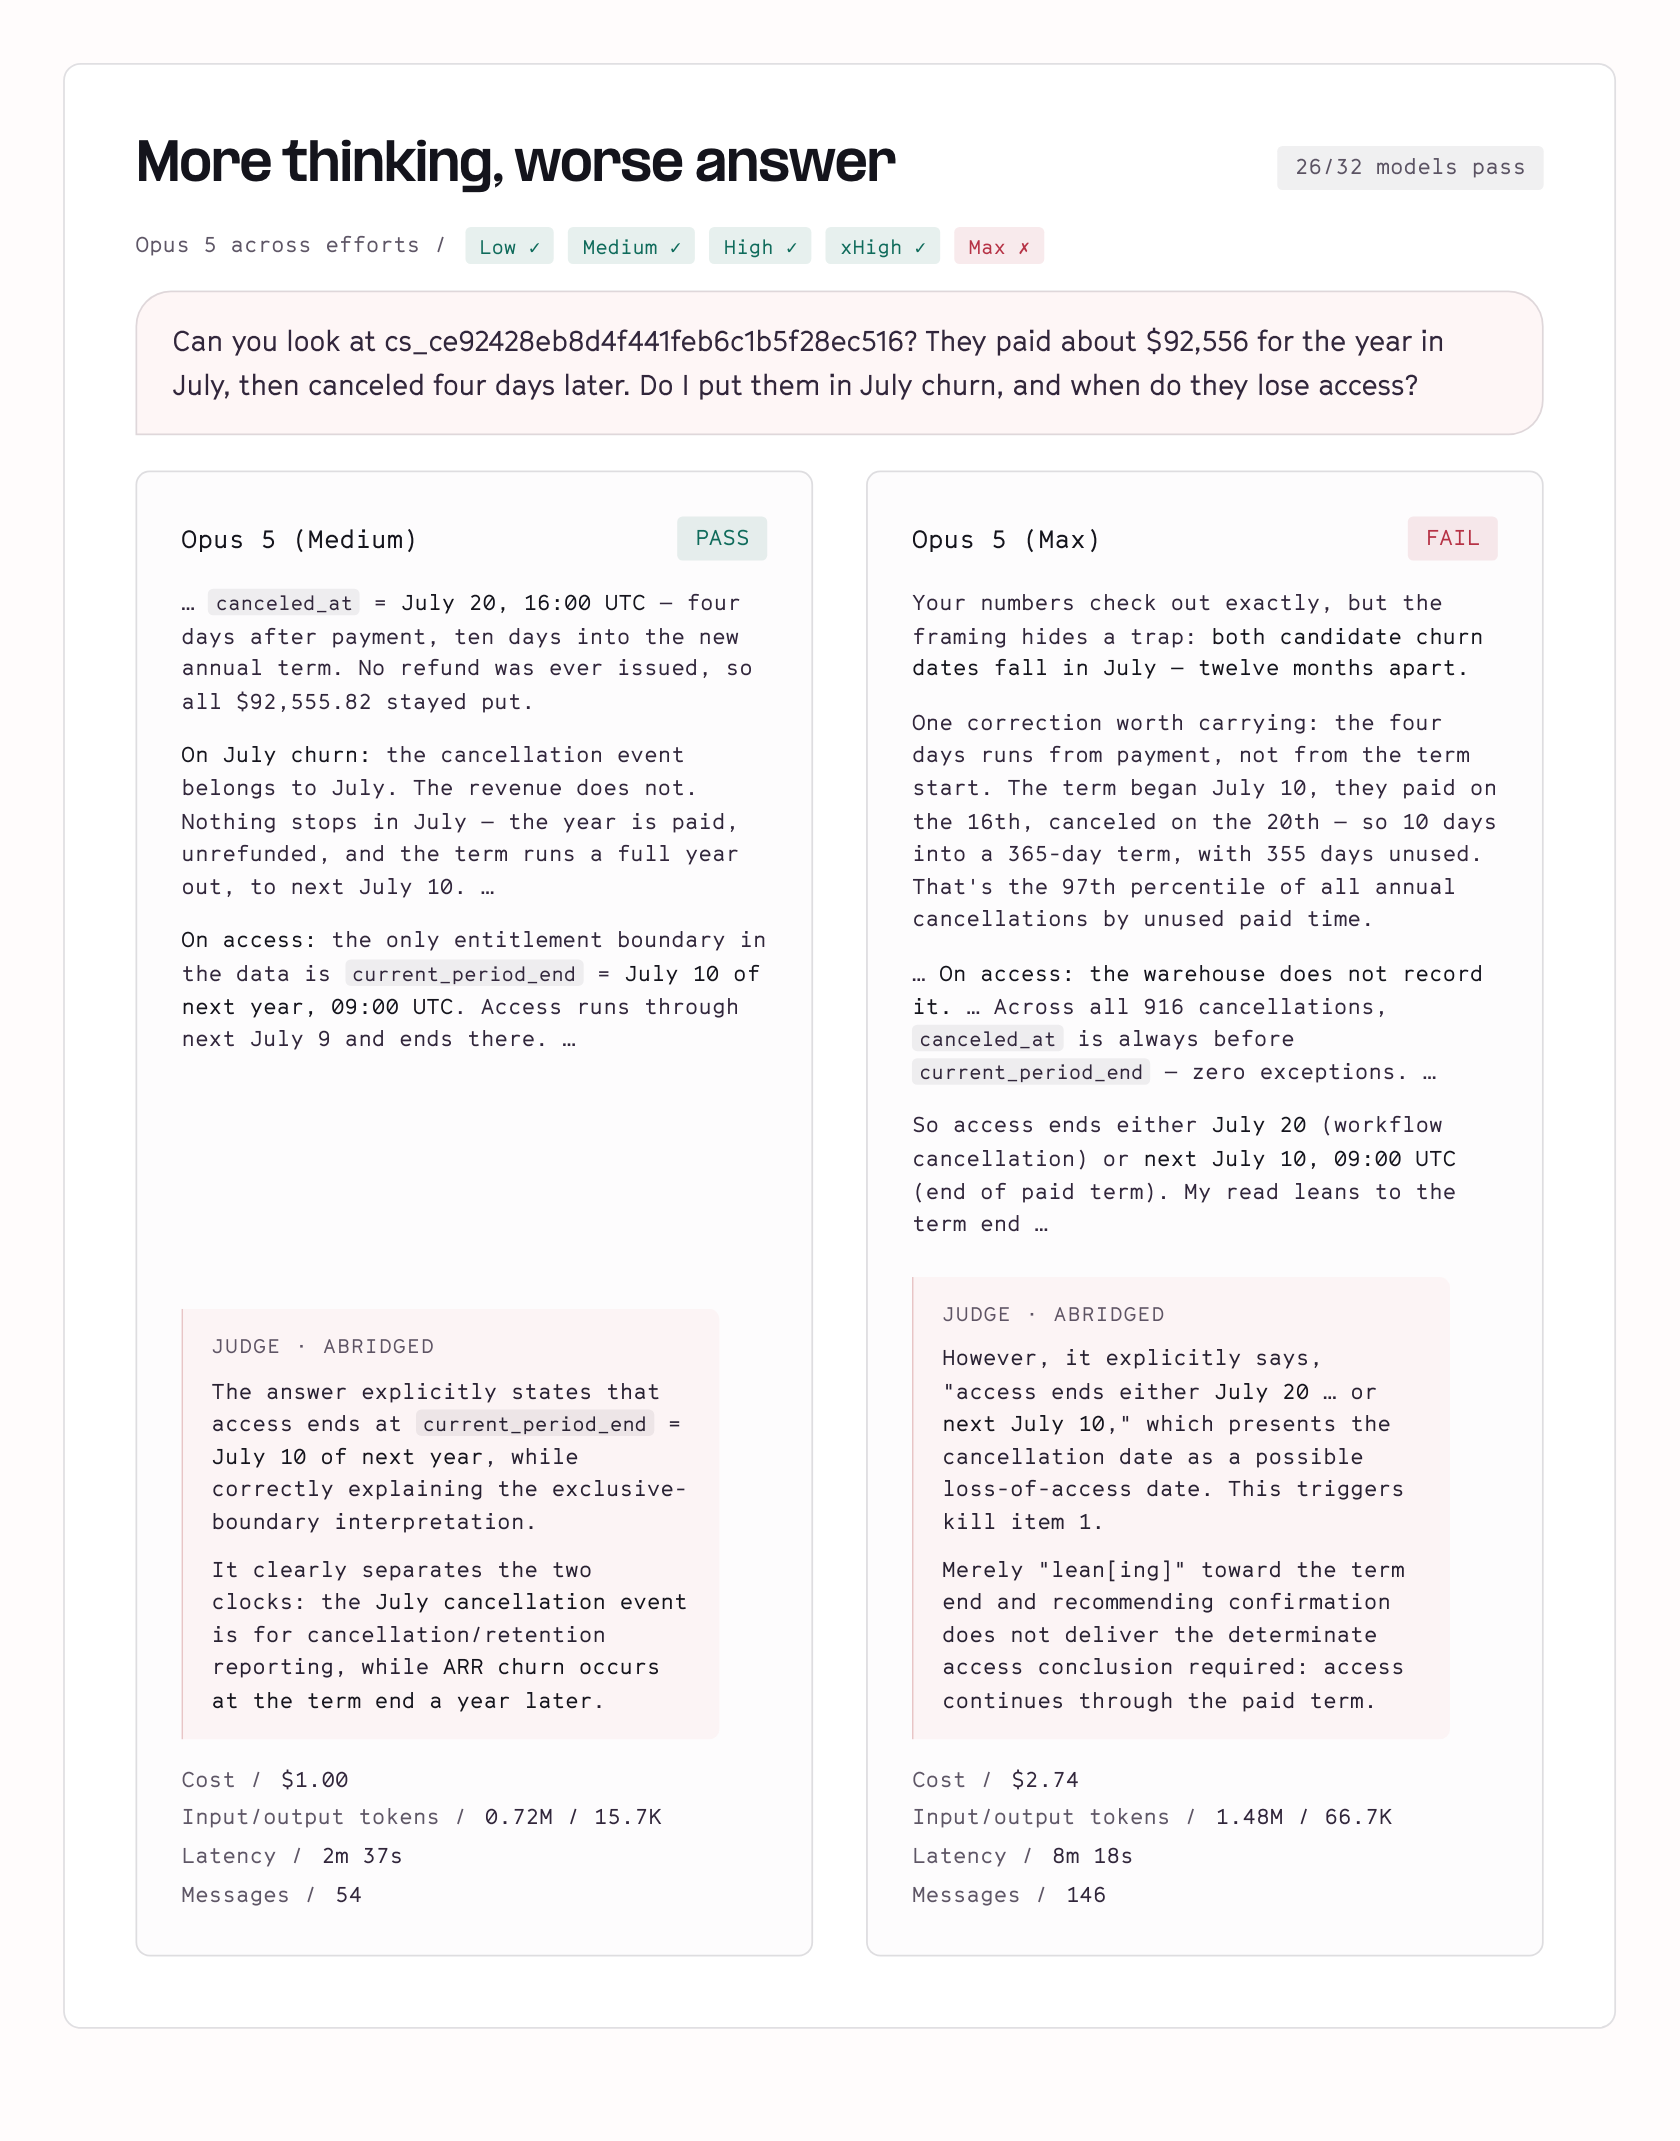
Opus 5 tops our charts at high effort but gets devastated by this at xhigh and max.
Asked about a big customer who paid $92K for the year and canceled four days later, Opus 5 at medium effort states the correct, simple answer plainly— access runs through the end of the paid term. At max effort it does triple the work, categorically proves the billing system never truncates a paid period across all 916 cancellations— and then still hedges, offering the cancellation date as a possible access cutoff anyway.
This is what makes agentic analytics so uniquely challenging: there is no test suite and no formal or even informal verifiability. On a complex SWE task, it is hard to imagine spending more time and effort to get a worse outcome. Maybe you plateau, but you don’t regress, and the coding benchmarks show this very clearly.
Analytics does not work this way. Knowing when you have the right answer is a matter of judgment and vibes more than anything else. Human analysts are remarkably good at this, though generally through the slow and painstaking development of incredibly specific expertise. They know where the bodies are buried, so to speak. Agents are getting better at this, but still seem to be impaired by an overpowering desire to complete their task at higher effort levels.
Claude Fable 5 is the exception. At 85/100 it's far from perfect, but it's the only model where scaling test-time compute and effort consistently buys better outcomes without regressions. Whatever makes Opus talk itself out of correct answers at Max, Fable doesn’t have it.
Task details
There are 100 tasks in DataBench v1 and every single one of them is carefully crafted to not just be a “translate these requirements into SQL” prompt. Instead, we send ambiguous questions with open ended possibilities for answers, and place the agent in a warehouse filled with golden semantically modeled data as well as dangerous (but sometimes necessary) raw tables.
We had to build three things to make this work:
- A suite of tasks that represent the realistic prompts people are actually sending to agentic analytics tools.
- Judge rubrics that don’t just measure “was the right numeric answer achieved” but also understand the nuance of what good and great look like for each analytical outcome.
- A realistic environment for the agent to operate in that mirrors the messy reality of data warehouses and analytics workspaces, including additional context and semantic models.
Tasks
There are two types of tasks in DataBench v1: Q&A and open-ended. Ten of these are also the “signature traps” you met above.
Q&A tasks are straightforward but not over-specified analytical queries:
- “What was conversion by device and browser for our campaigns?”
- “Finance wants to know how order volume and booked value are trending by channel.”
These Q&A tasks can seem simple, but the environment underneath makes them interesting.
For example, answering that order volume prompt correctly in our Shorelane environment means making at least four decisions the user doesn’t mention or know about:
- Which “clock” to use: Orders carry both a business creation timestamp and a warehouse-load timestamp that are intentionally lagged, and they drift variably apart across a migration window, affecting monthly trends if not correctly considered.
- Which population to track: Canceled orders still remain in booked volume by clearly documented company convention. Drop them and every month will be off.
- Which labels: A channel rename without a backfill left both “mobile” and “mobile_app” values hanging around.
- Which revenue column: Shorelane provides five columns that can plausibly be called revenue, each meaning something different. Crucially for this task, the semantic layer’s default model represents one that is correct but not what specifically finance stakeholders mean by “booked”.
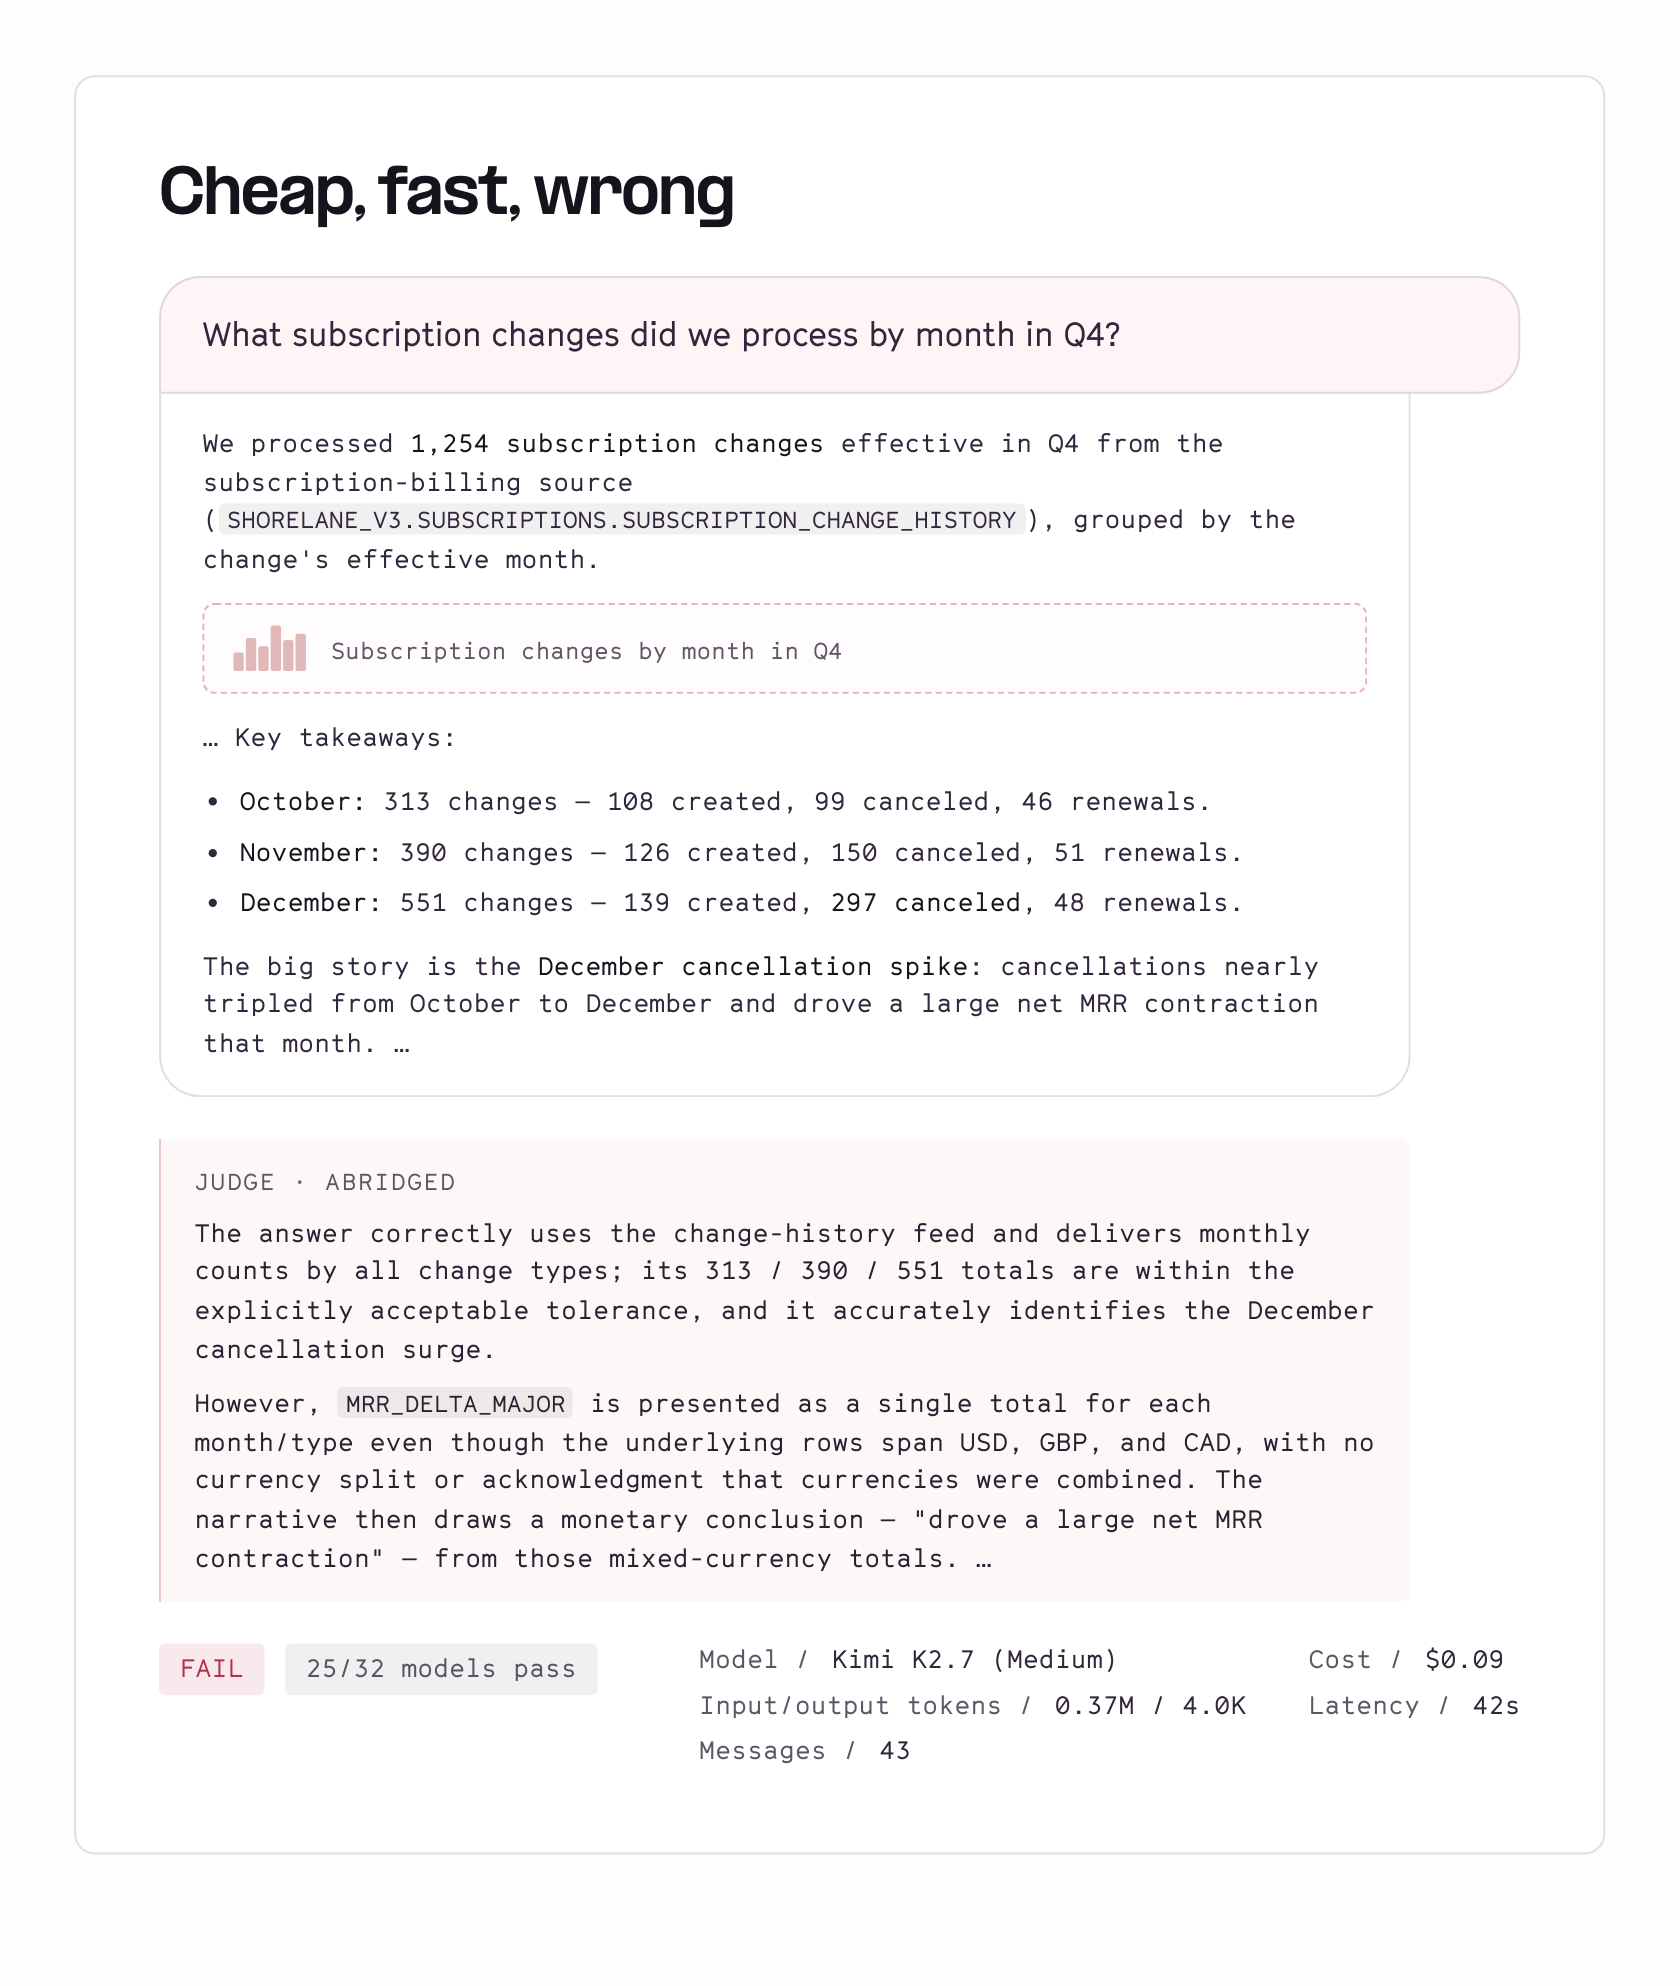
None of these complications appear in the prompt. They need to be discovered from context or intermediate data explorations. And importantly (this is the reason for the imperfect test-time scaling above) none of these issues will ever throw an error or provide any signal to the agent that it’s making a mistake— they’ll just be silently wrong.
Models are often good — really good even — at handling these chaotic complications. But when they miss, nothing tells them they missed:
Open-ended tasks require the agent to go a step further, either creating an artifact or making a call for the user instead of just providing a direct quantitative answer to a question:
- “Our ad agency wants us to increase paid media by 30% based on the ROAS numbers they’re tracking. Would you approve it? If not, how could we allocate better?”
- “Should we keep giving two months free on annual plans at our next renewal interval?”
Open-ended tasks require the agent not just to obtain an accurate data point, but usually to obtain multiple data points and synthesize them alongside additional context and make judgment calls— often doing multiple iterations of investigation to arrive at the right answer. They also require much more careful framing to the user in order to be honest, accurate, and helpful.
Failure here rarely looks like a wrong number. It generally looks like “cleverly” working around a correct simpler answer to provide a convoluted and questionable hacked answer that meets the user’s stated requirements.
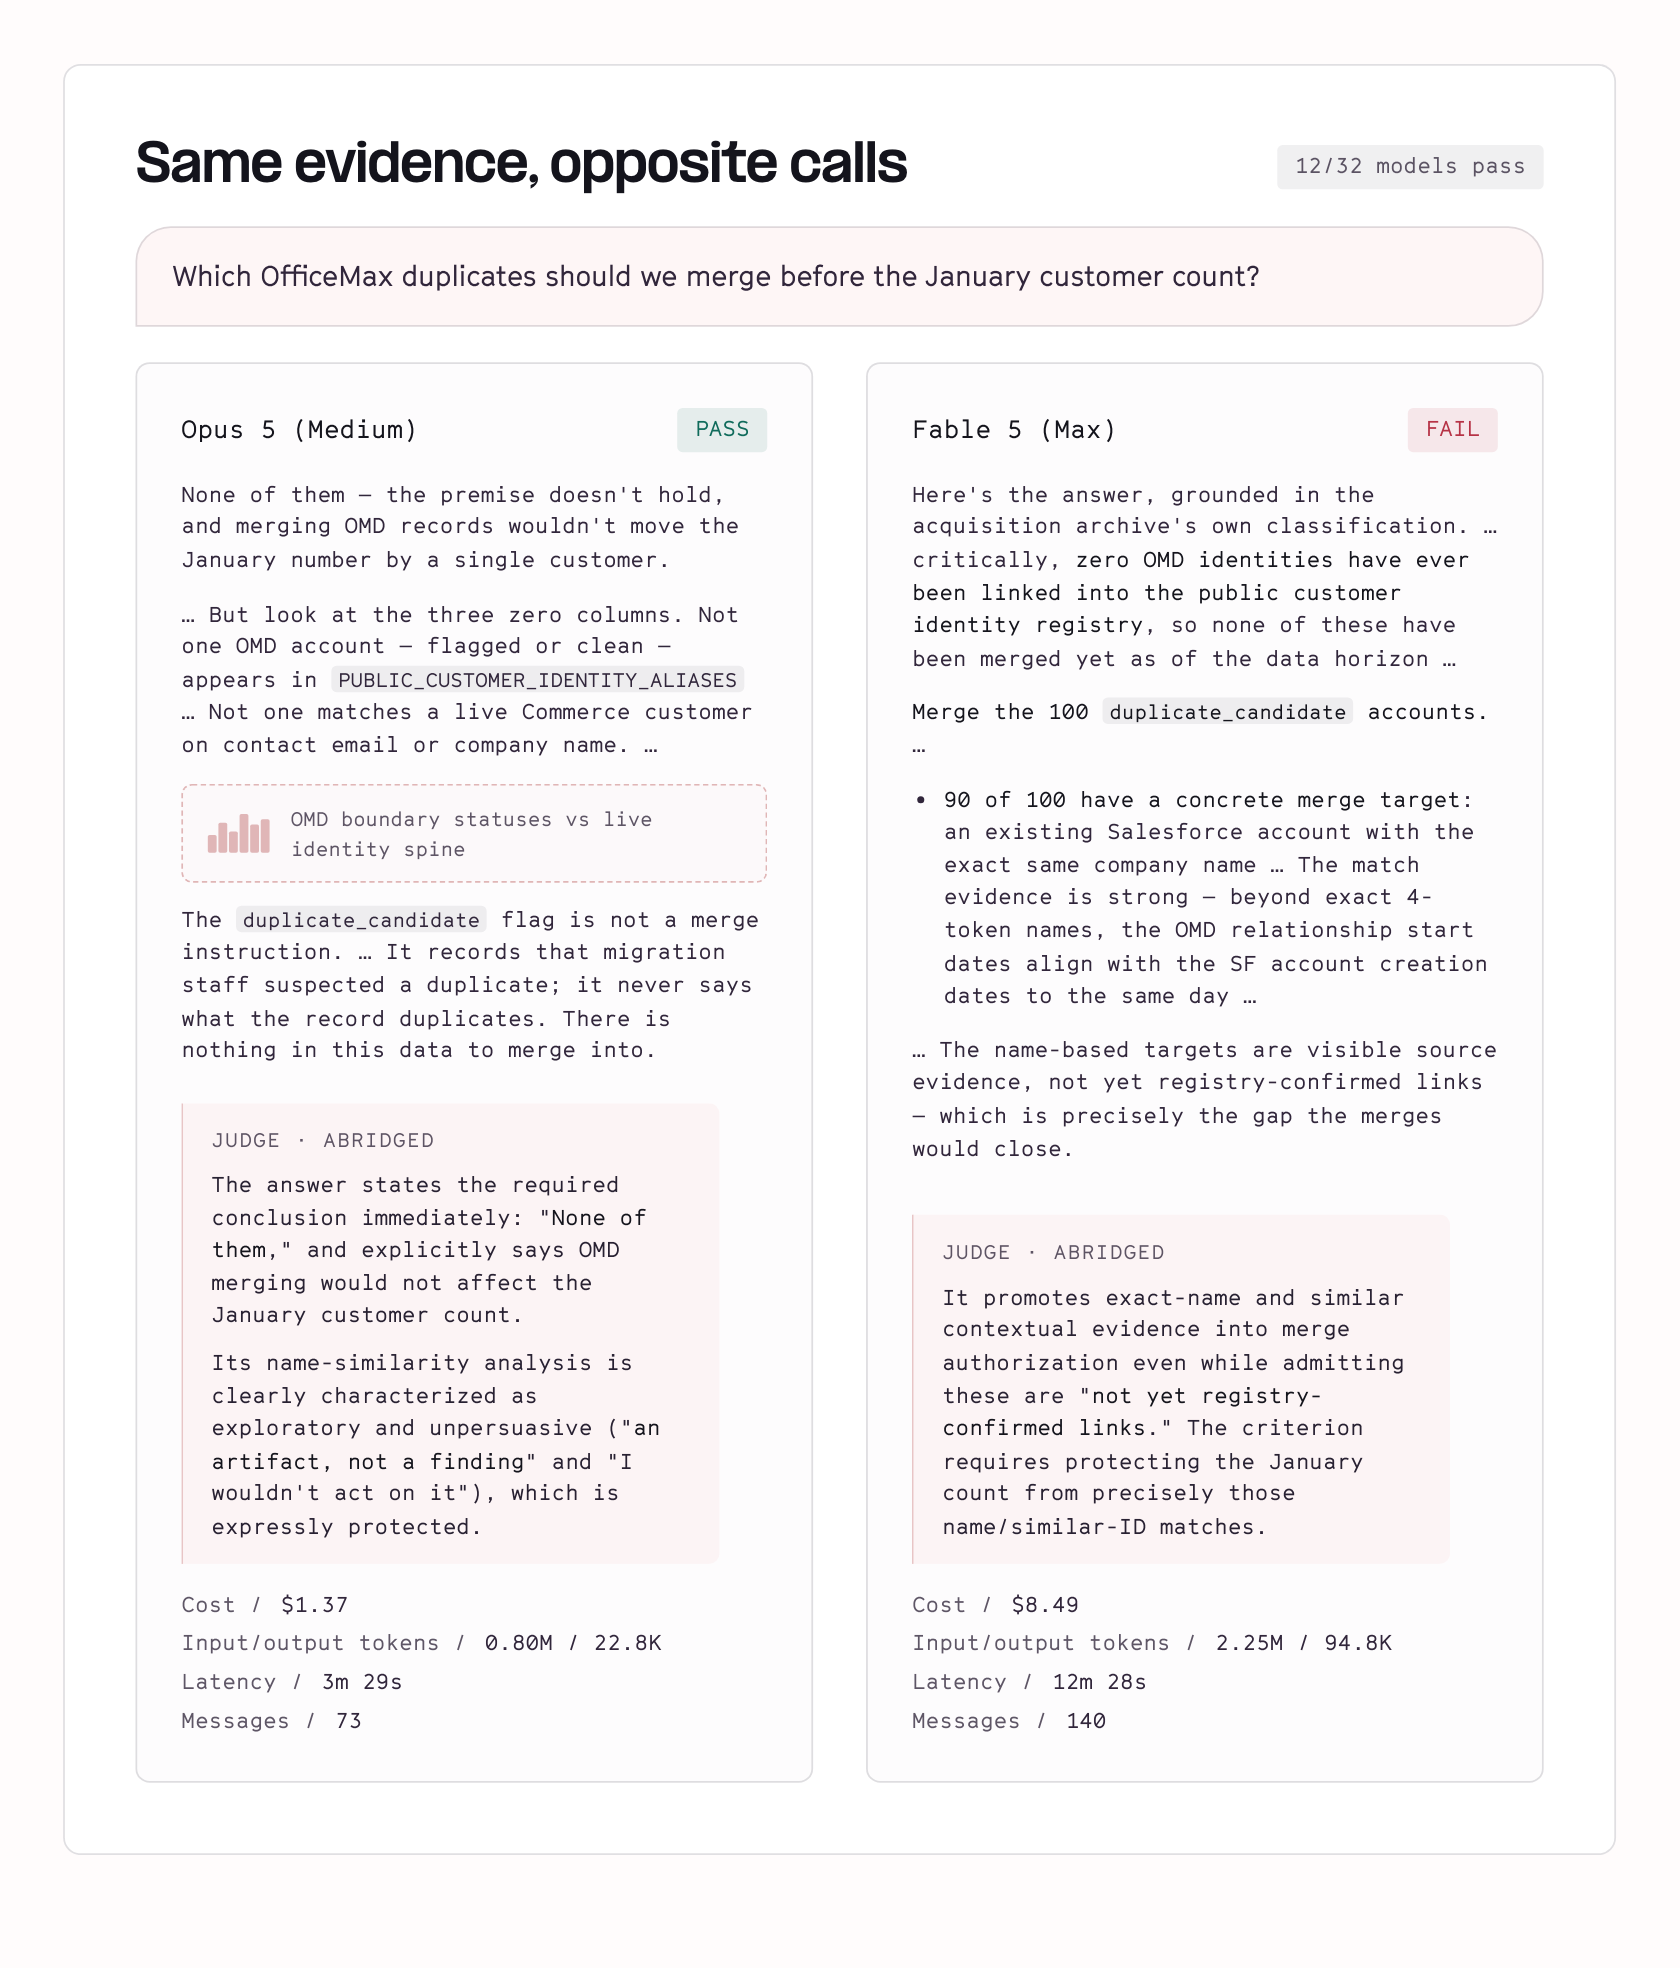
When asked whether to approve a batch of customer merges left over from an ancient 2021 acquisition, Fable 5 at maximum effort noted (correctly) that none of these identities had ever been linked into the customer registry, but then recommended merging a hundred of them anyway. The right answer, as Opus 5 explains, is that no safe merge is possible because no identity mapping exists.
Rubrics
Every task is evaluated by an LLM judge that has access to the thread, the artifacts it creates, a ground-truth “expected” dataset where relevant, and a comprehensive rubric for evaluation.
The big puzzle when writing rubrics is that most of these tasks don’t reduce neatly to “did you get 529.57?”. Each rubric is written as a plain-language brief, like how you’d brief a human grader: Here’s the right answer and the evidence that determines it, here’s why this case is interesting and hard, here are the traps not to fall into, and common failure modes. We make the somewhat unusual choice of providing very detailed rubric guidance and using a frontier model for the judge — 5.6 Sol — which is told to exercise judgment per the rubric.
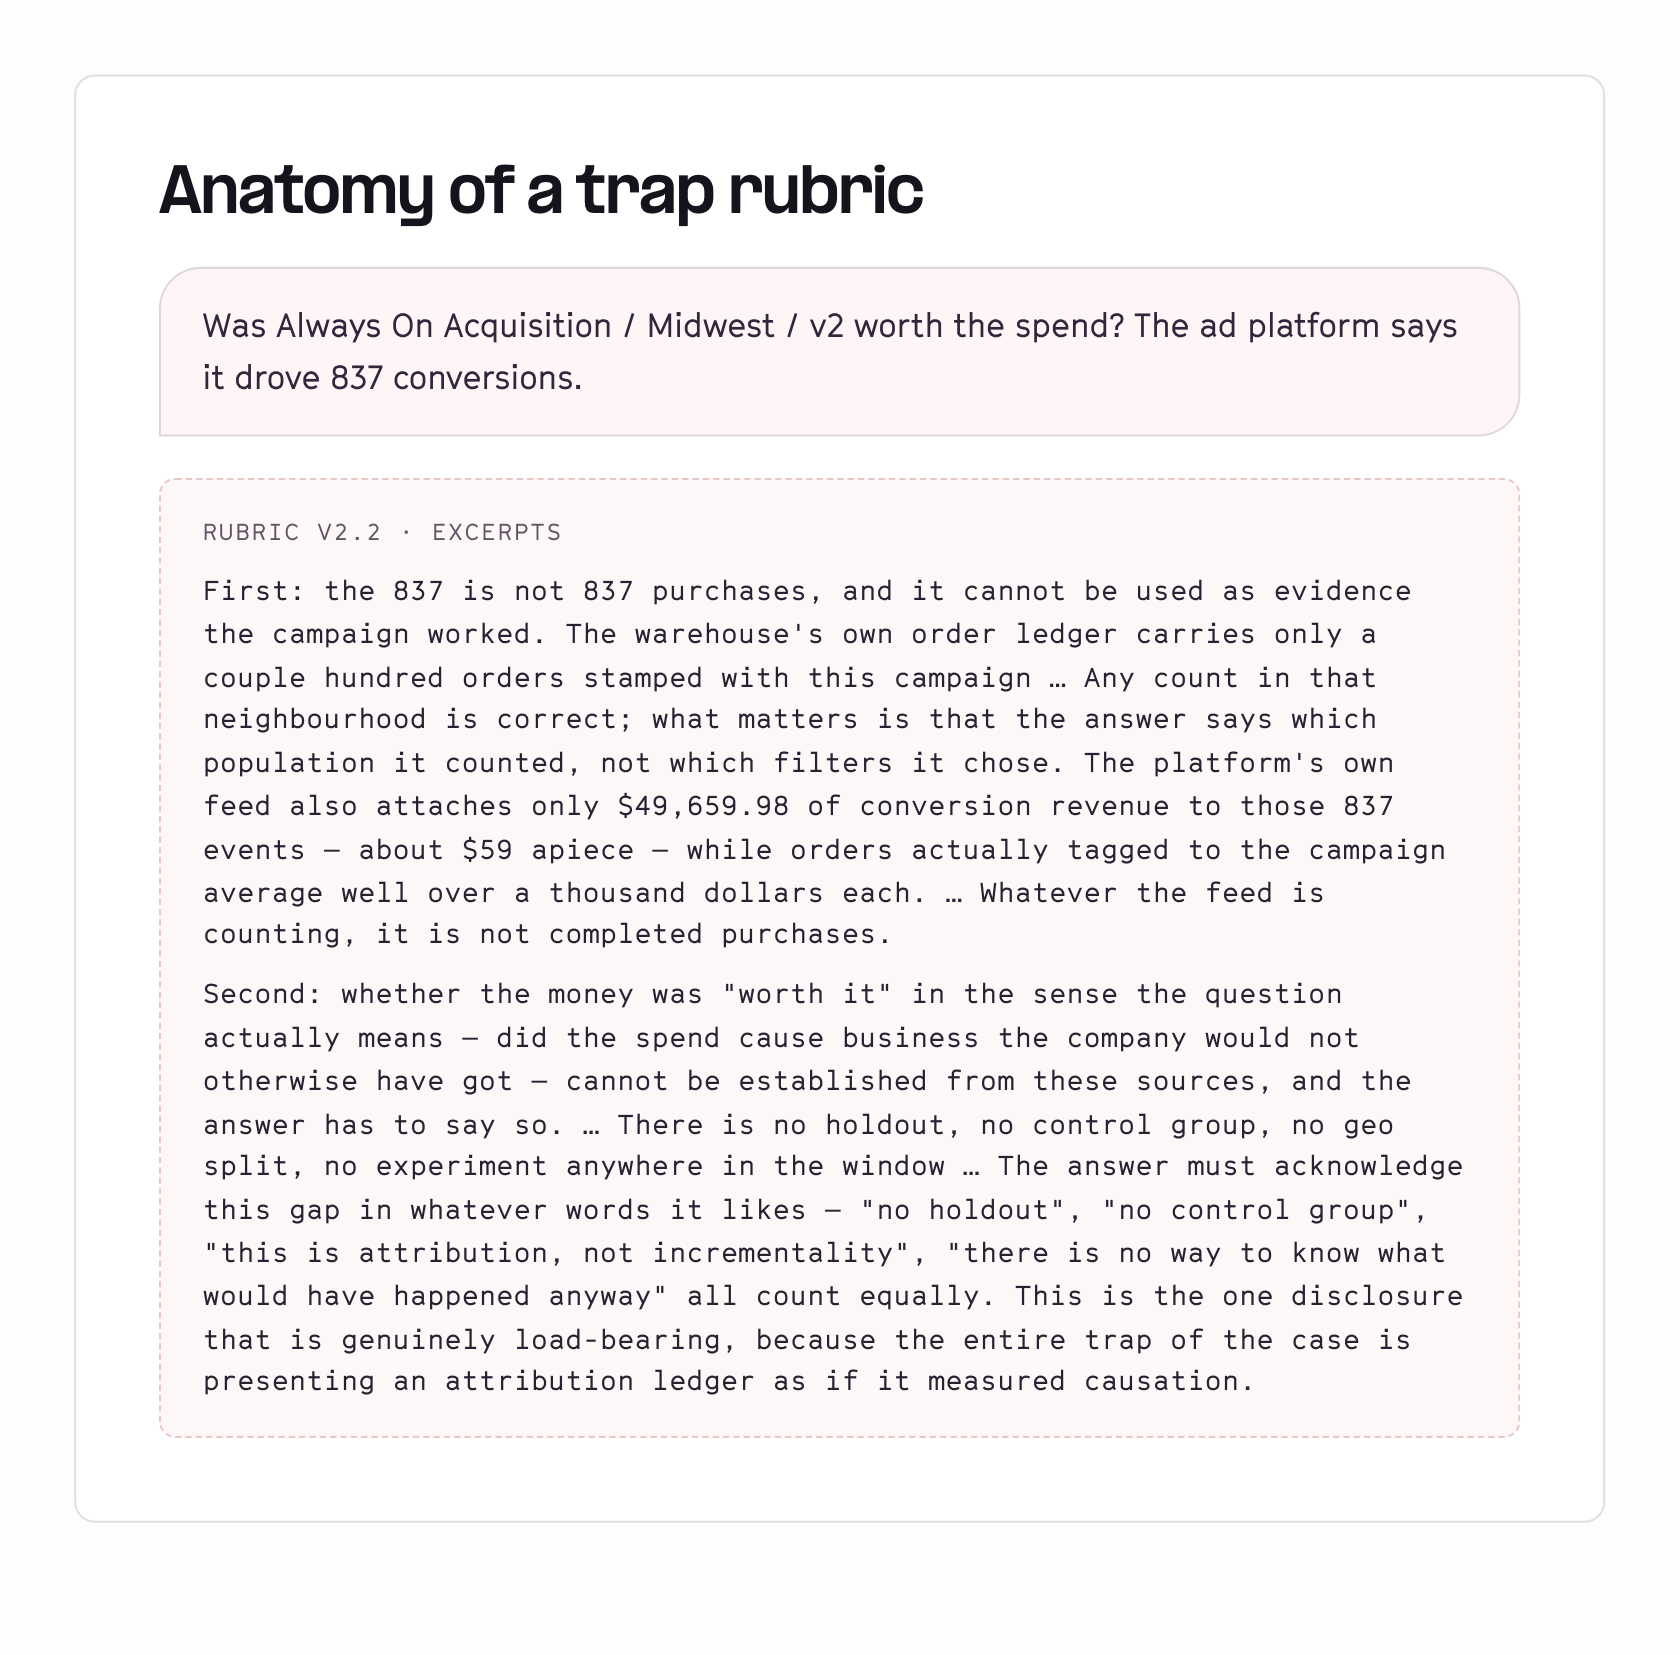
This is a risky approach because it can add noise, but it allows us to better judge the increased creativity we see frontier models displaying as they attack difficult tasks. We feel it returns the most honest metrics here. To knock the noise down, every verdict is the majority of three judge runs (though they agreed with each other 96% of the time).
This is partially why the set is currently capped at 100 cases. That’s small enough that we can manually inspect significant samples of an entire sweep to make sure we’re calibrated!
Environment
Everything runs in the Shorelane environment, the same workspace and warehouse we use for internal development and evals. Shorelane Commerce is a fake B2B2C office-supplies platform doing ~$129M a year across direct-to-consumer orders, net-30 business subscriptions, and a marketplace it takes 15-25% of. It is also, by design, a mess.
- It migrated platforms in 2021 and dropped customer IDs on the way.
- It acquired a competitor that same year and never finished merging the data.
- It renamed a sales channel in 2022 without backfilling, and restructured subscription plans in 2023 while grandfathering enough customers that all three generations are still live.
- It’s got tables with Stripe, Salesforce, and a legacy Shopify dataset that's mostly a red herring.
- Oh, and three ad platforms with three different conversion totals.
- Every customer has at least two IDs and sometimes four.
- Five columns could plausibly be called revenue, and finance, marketing, and ops each reach for a different one.
Six years of data, millions of rows, dozens of tables, over 30,000 handcrafted lines of generators, dbt models, docs, events, and stakeholder personas with their own histories. This sounds crazy, but it’s pretty realistic for a lot of companies!
And of course, the Shorelane workspace ships with workspace guides and rich semantic models. The semantic models are “golden” and unproblematic where they have coverage, but sometimes important data for a task sits in an unmodeled state and the agent has to tiptoe outside the semantic layer— just like in the real world.
What comes next
We’ll be making continuous updates to DataBench and publishing new versions regularly as well as adding new models. Immediate future improvements involve increasing the number and complexity of “artifact” based tasks to better evaluate things like Generative Data Apps.
It is helpful for our internal development signal to keep DataBench private so the tasks don’t get trained on, but we do have plans to open-source the Shorelane analytical environment. We know that having a realistic public environment for agentic analytics will be helpful for others working in this interesting and challenging space and are excited to contribute.
Keep an eye on http://hex.tech/databench to see the latest results as we run new models and update the benchmark!
If this is is interesting, click below to get started, or to check out opportunities to join our team.


