Blog
New in the Hex Claude Connector: Interactive charts, tables, and thinking steps
If you thought MCP was cool… Anthropic just dropped their first batch of Claude Connectors built on MCP Apps Extension, and Hex is one of them.


Today we’re expanding the capabilities of the Hex Claude Connector, so you can get interactive charts, tables and thinking steps directly in Claude.
When Anthropic introduced the Model Context Protocol (MCP) back in November 2024, it galvanized the AI ecosystem around a universal standard for agent integrations, elevating AI assistants from isolated chatbots to capable workflow orchestrators. We launched the Hex MCP Server amidst that wave. Our vision was simple: give users access to trusted insights, on-demand, from anywhere.
But there was one glaring gap. Initially, MCP servers were limited to exchanging text and structured data. In Hex’s case, this meant you could chat with Claude about your data questions, but all of your artfully-formatted custom-branded charts and data apps were still sequestered in your Hex workspace. Text summaries are nice, but people really love their charts.
That’s where the MCP Apps Extension comes in. What began as a glimmer of possibility with OpenAI Apps SDK at Devday 2025 has culminated beautifully in a new universal standard for interactive interfaces in MCP.
Today, we’re excited to join Anthropic in announcing the first batch of Claude Connectors built on MCP Apps Extension. Included, of course, is the Hex Claude Connector – now with interactive custom-styled charts, tables and thinking steps woven right into your Claude conversation.
The Hex Connector in Claude is available to Explorer+ seats on Team and Enterprise plans.
Follow along with the Hex agent every step of the way
Now when you fire off a data question from Claude, the Hex Connector will spin up an interactive interface displaying the Hex agent’s thinking steps.
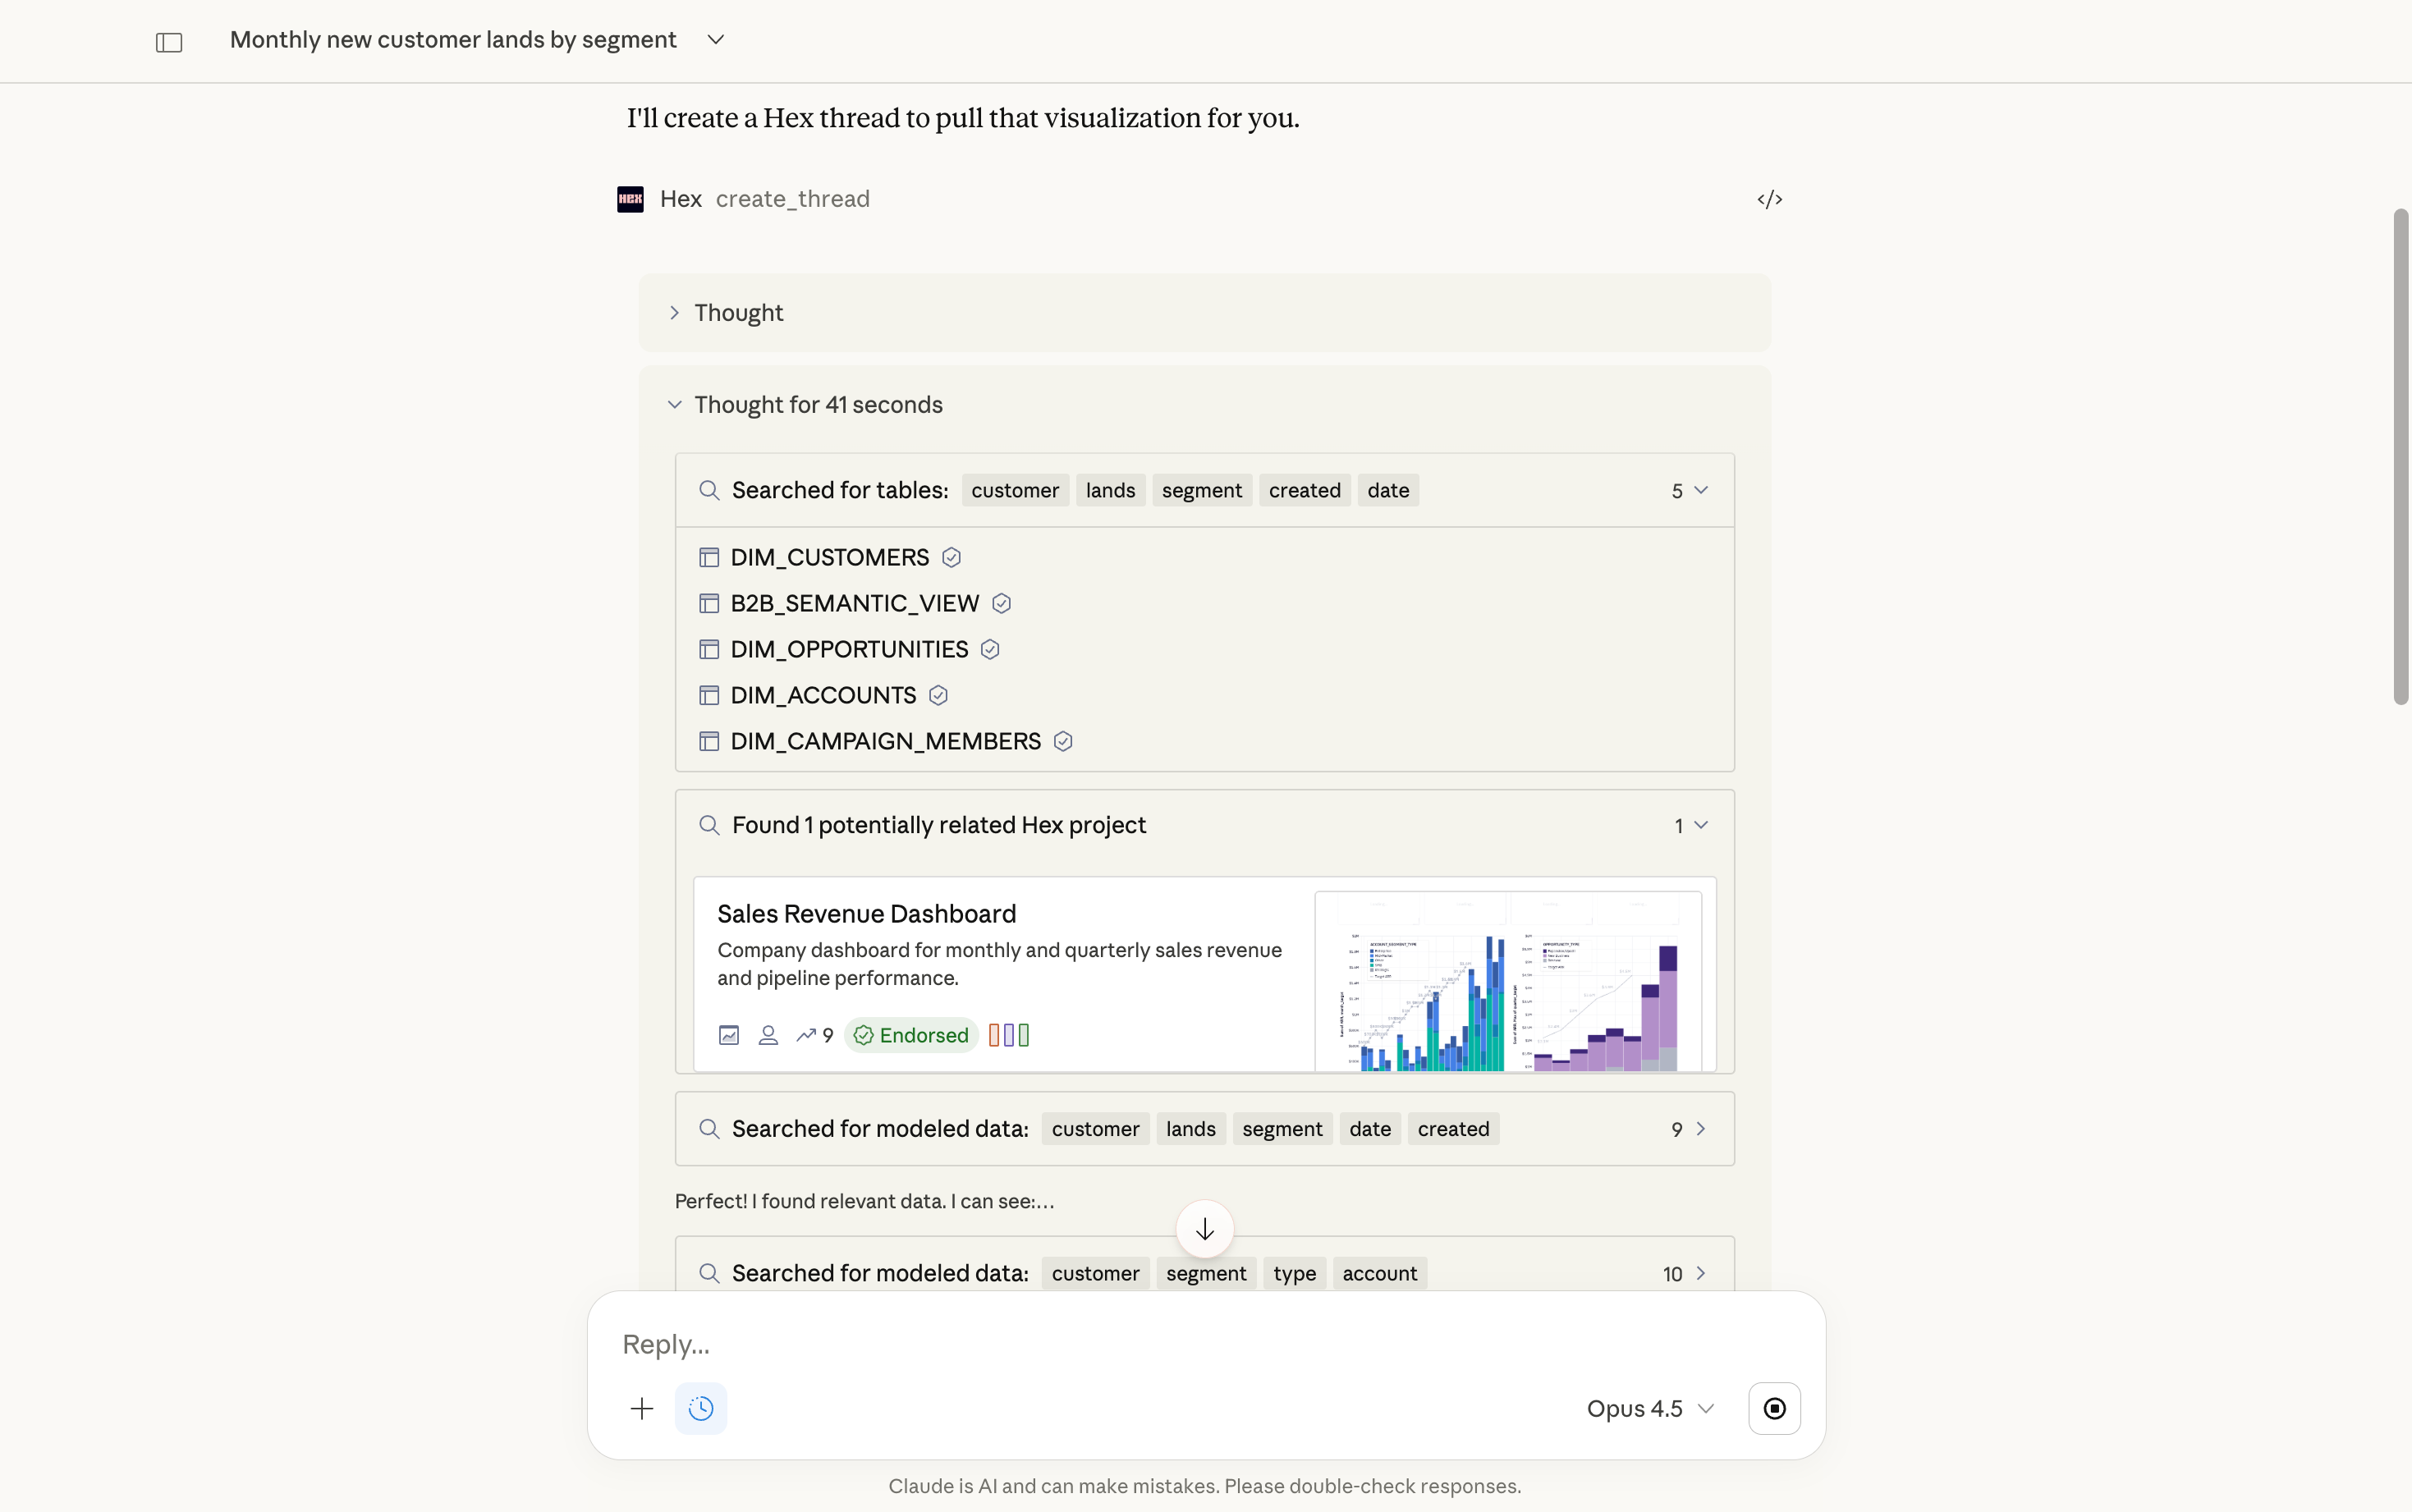
Click into the thinking steps to see which tables or semantic models the agent is referencing, and to spot-check the underlying SQL. This lets you follow the agent’s reasoning, deepen your own understanding, and point things in a new direction if needed.
Interact with charts and tables directly in Claude
When the Hex agent is finished thinking, Claude will now display any charts, tables, or other data visualizations from Hex directly in the conversation. You can hover over a chart to view specific data points, and copy data into your next slide deck or spreadsheet.
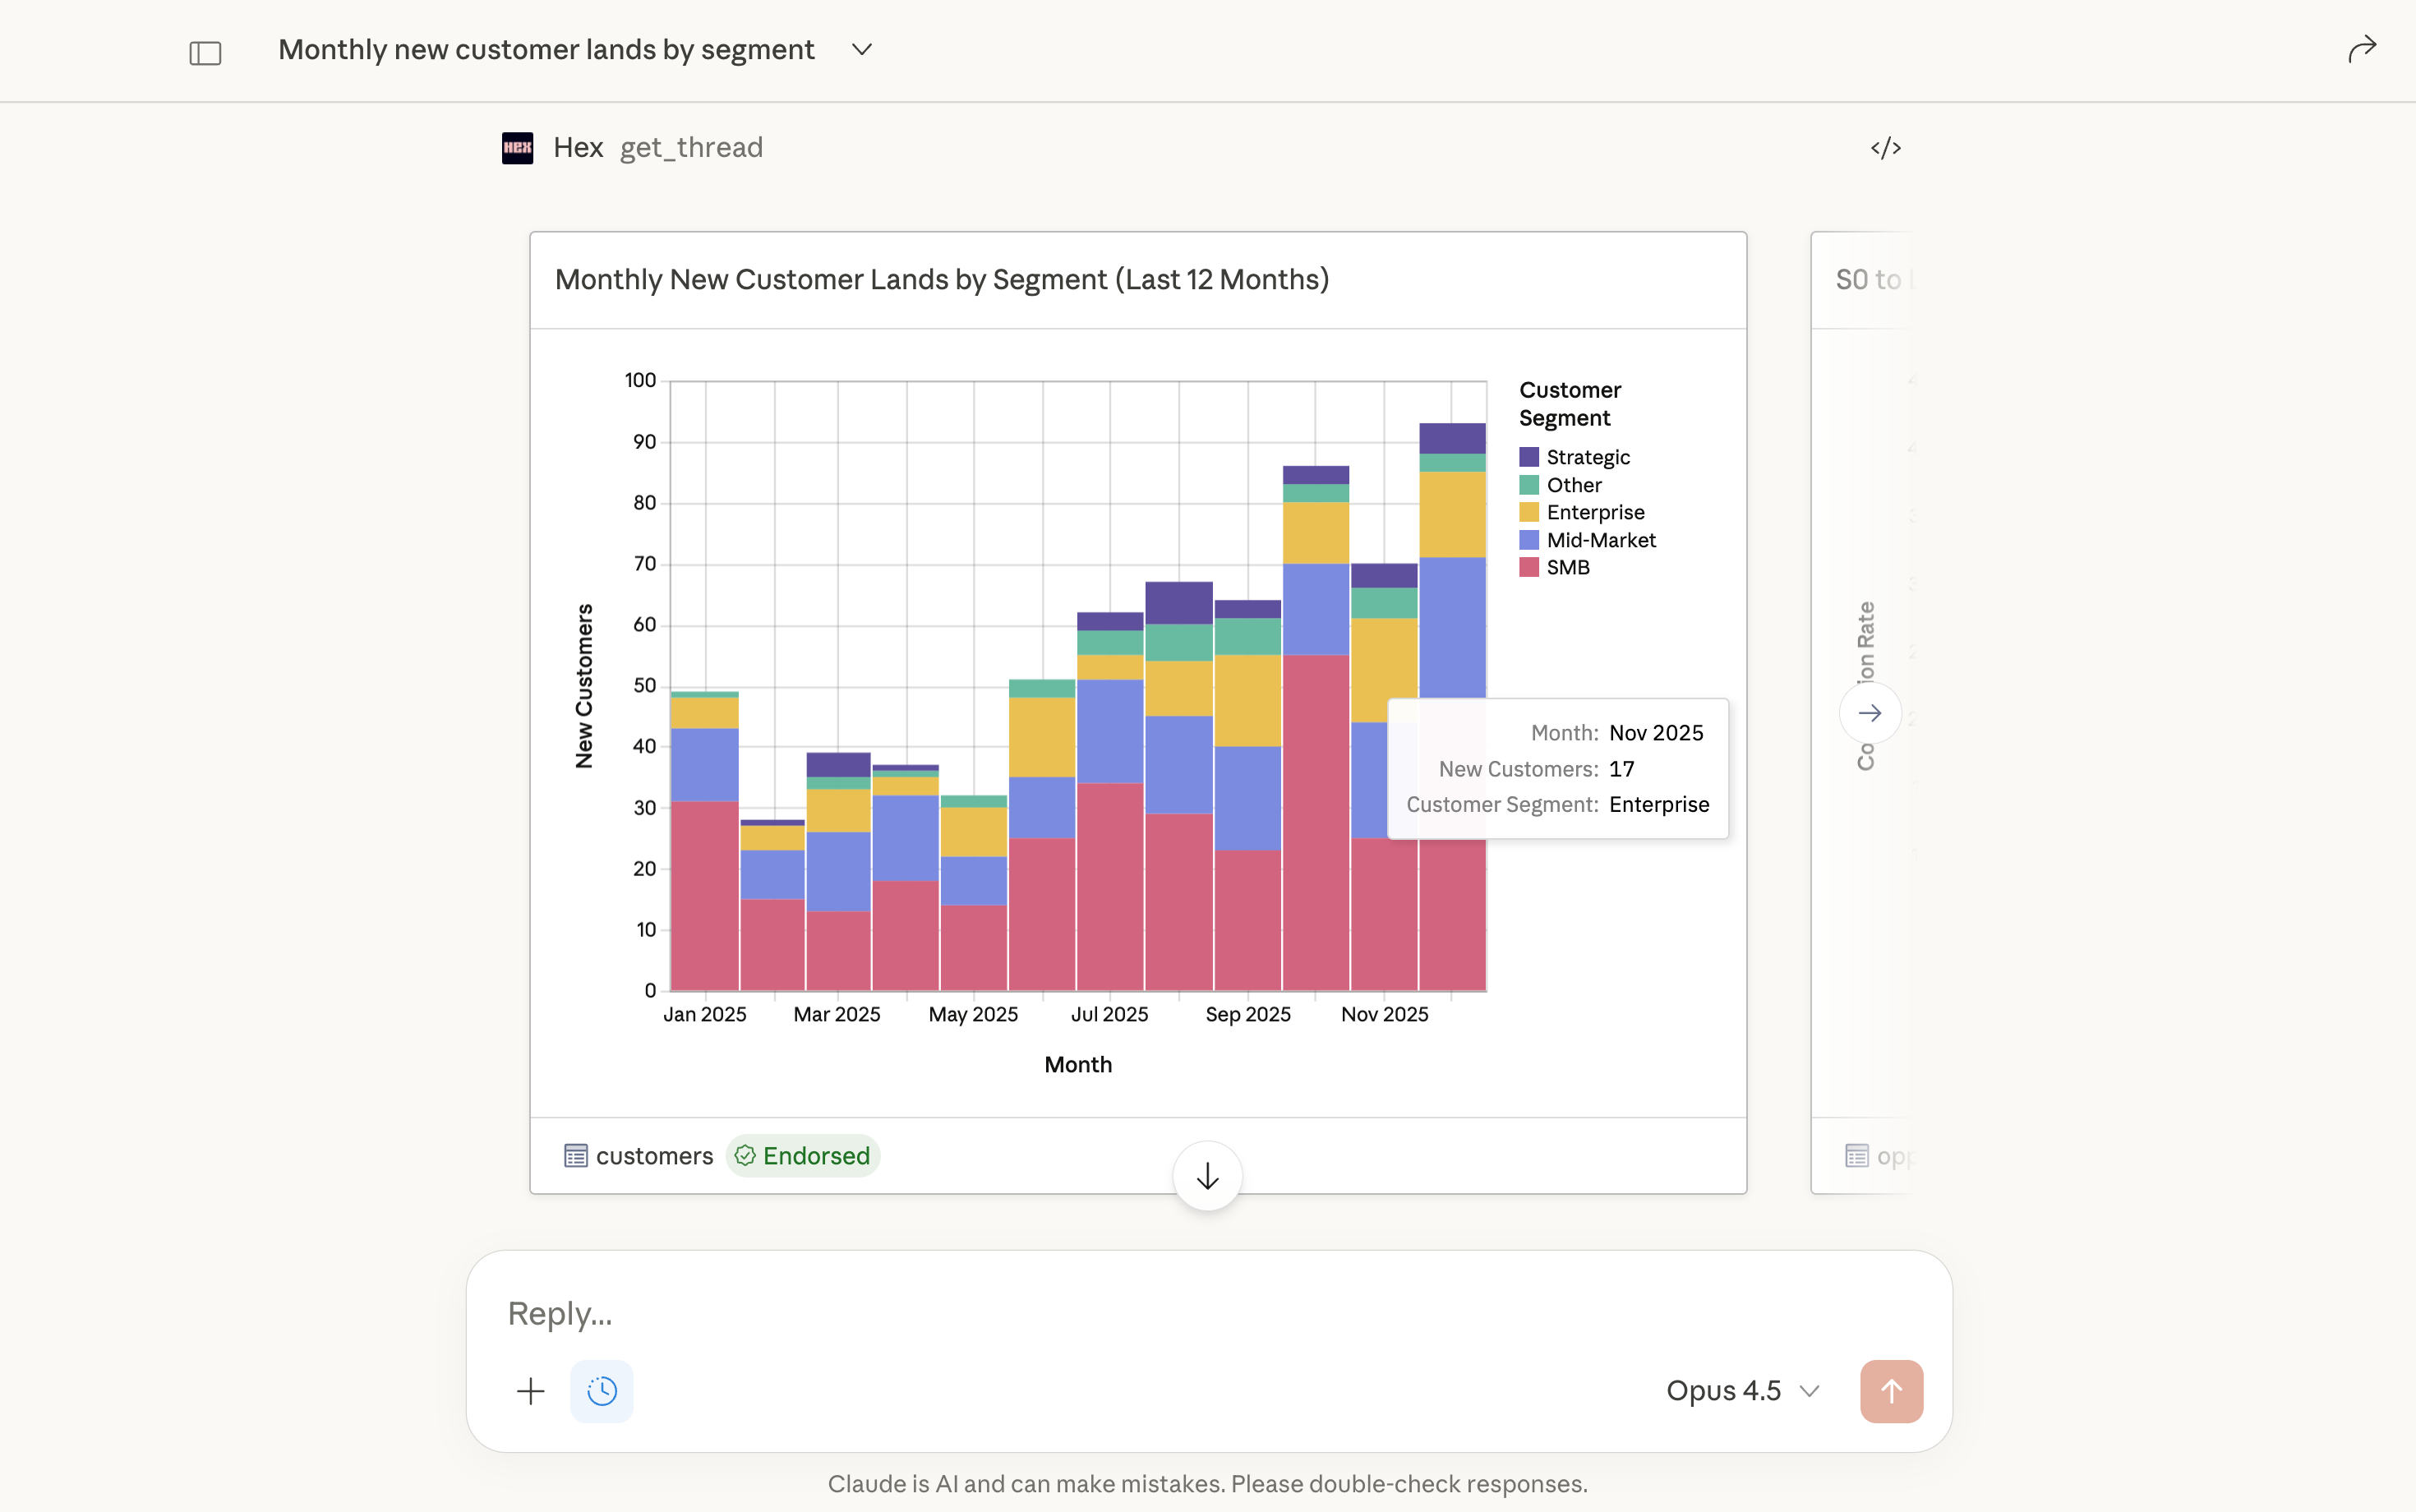
As always, responses inherit the context and access controls from your Hex workspace. Now, they’ll also inherit any custom styling you’ve configured in Hex, so you can generate charts, tables, and other data visualizations that are true to your brand.
Get started with Hex in Claude
To get started with Hex in Claude, the owner of your Claude workspace will need to add the Hex Claude Connector. Then you can toggle on Hex in a new chat from + > Connectors. The first time you connect, you’ll be asked to authenticate into your Hex workspace.
After that, it’s smooth sailing. Fire off whatever data questions you like, and Claude will triage them to Hex.
You can ask things like:
- How are my KPIs trending this quarter?
- Pull me a table of unconverted trials from last month with emails.
- What does support ticket volume look like by topic over time?
- How do our case study pages convert vs. industry benchmarks?
- Help me find that activation regression analysis we did last year.
Ready to dive in? Check out the Hex Connector in Claude’s directory and our documentation.
Onwards to a more integrated future
This is just a first taste of what’s possible with the MCP Apps Extension. We see a future where your data works for you, and everyone can effortlessly access and trust the insights they need to move confidently towards their goals.
We’re excited to keep innovating on this front with Anthropic and other partners. In the meantime, let us know what capabilities you’d like to see next in our Claude Connector and MCP Server!