Blog
Hex in the Wild: January 2026 spotlights
Real data, real people, real impact — all built with Hex.


People are pushing beyond traditional analytics in Hex, experimenting with models, workflows, and data apps as AI lowers the barrier for work that once required deep expertise or dedicated data teams.
In this edition of Hex in the Wild, we’re spotlighting teams using Hex to test delivery pricing, stand up semantic models for self-serve analytics, and track critical finance metrics for fundraising and growth.
Have you built something cool in Hex and want to brag about it? Let us know →
Optimizing delivery zones and driver pay with fleet data 🚛

Name: Tobias Kafin, Farm to People
Role: Data Architect
Favorite Hex feature: Scheduled runs
Go-to chart: Maps
Years of using Hex: 1+
What I built
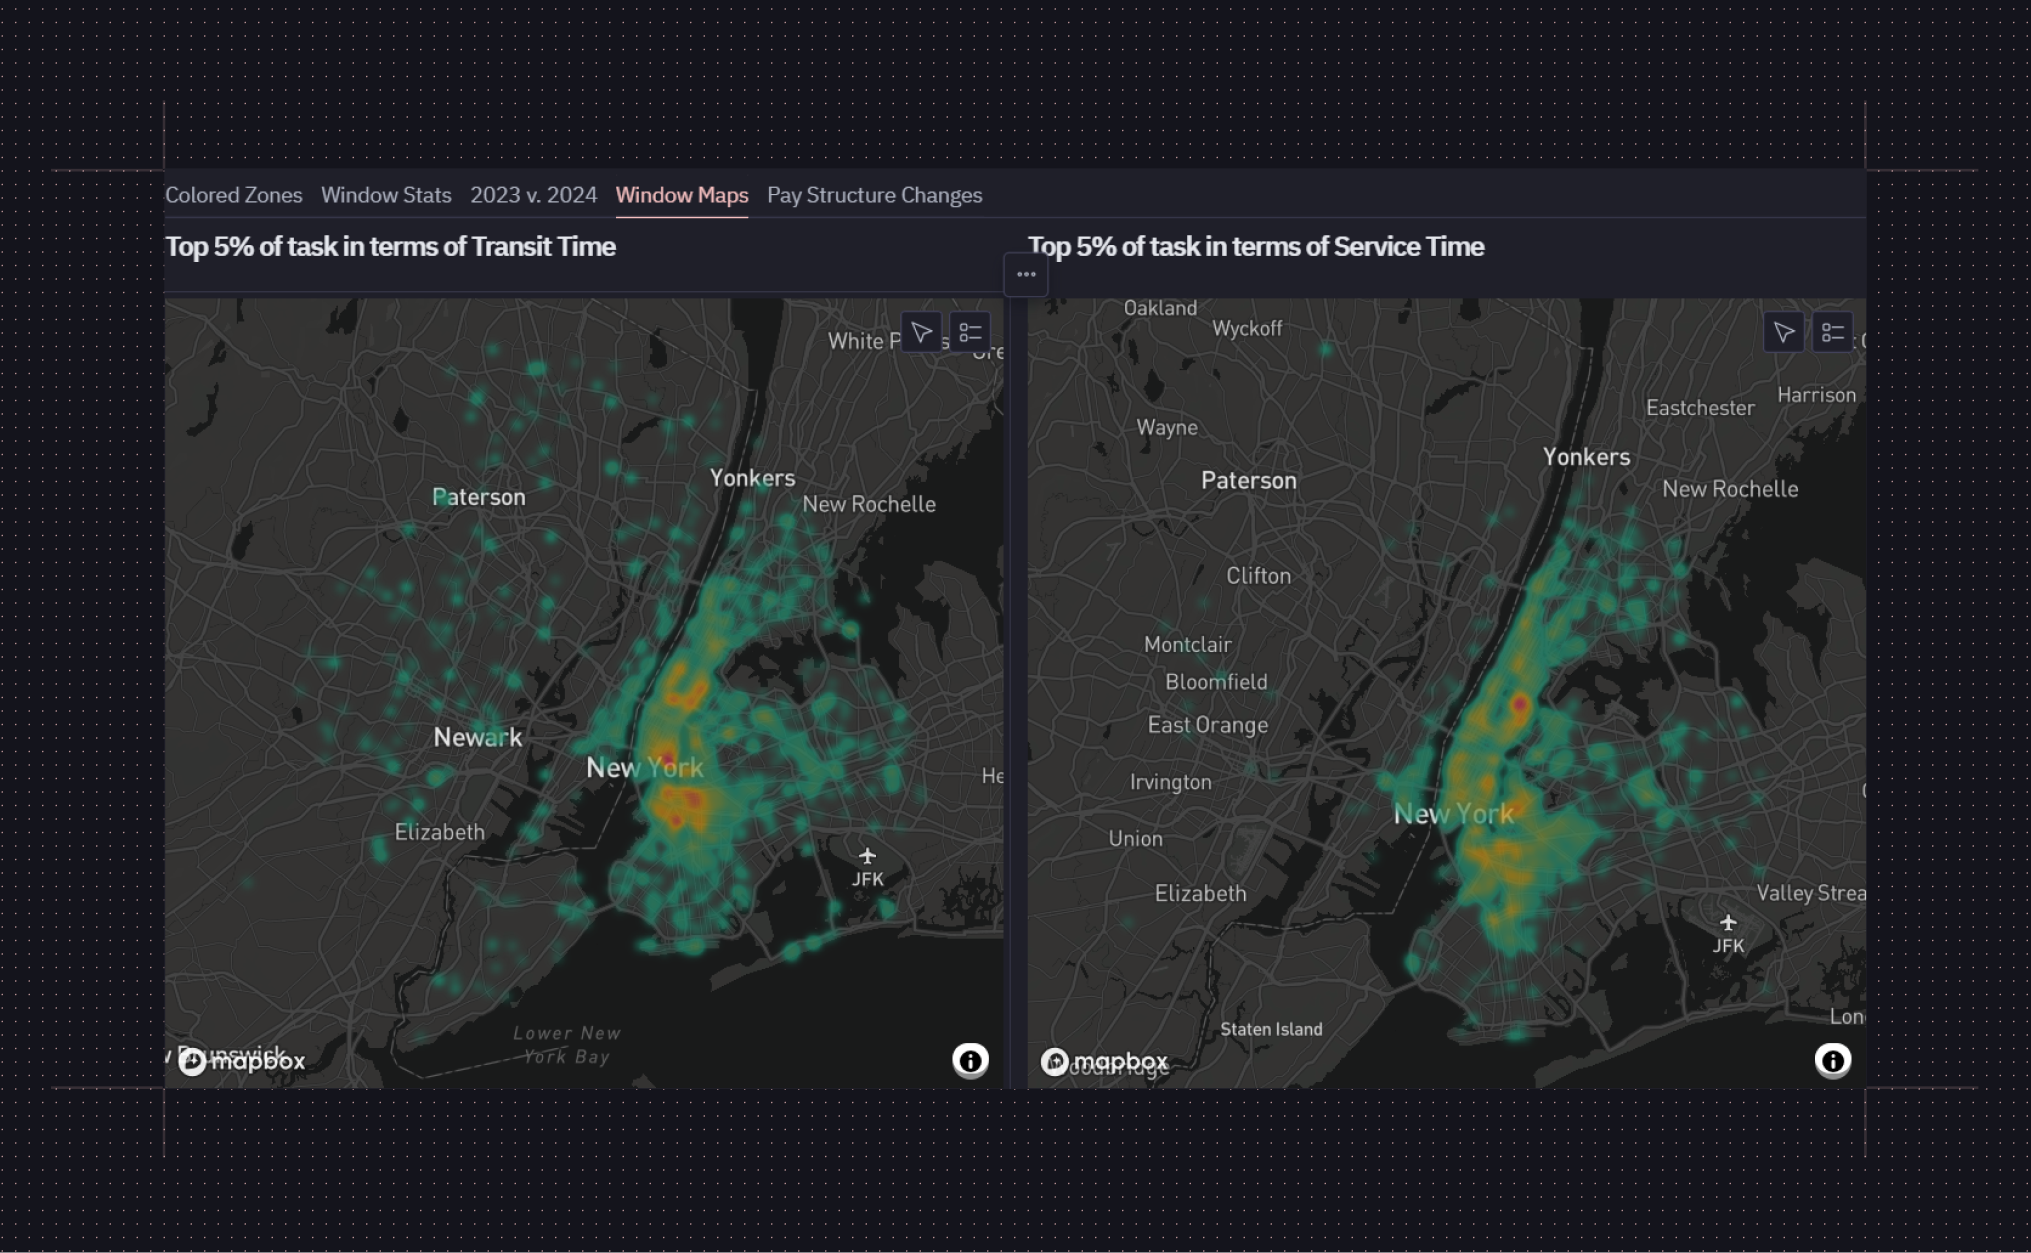
Farm to People is a sustainable food marketplace that delivers locally sourced, high-quality products from Northeast regional farms and food makers directly to New York City customers.
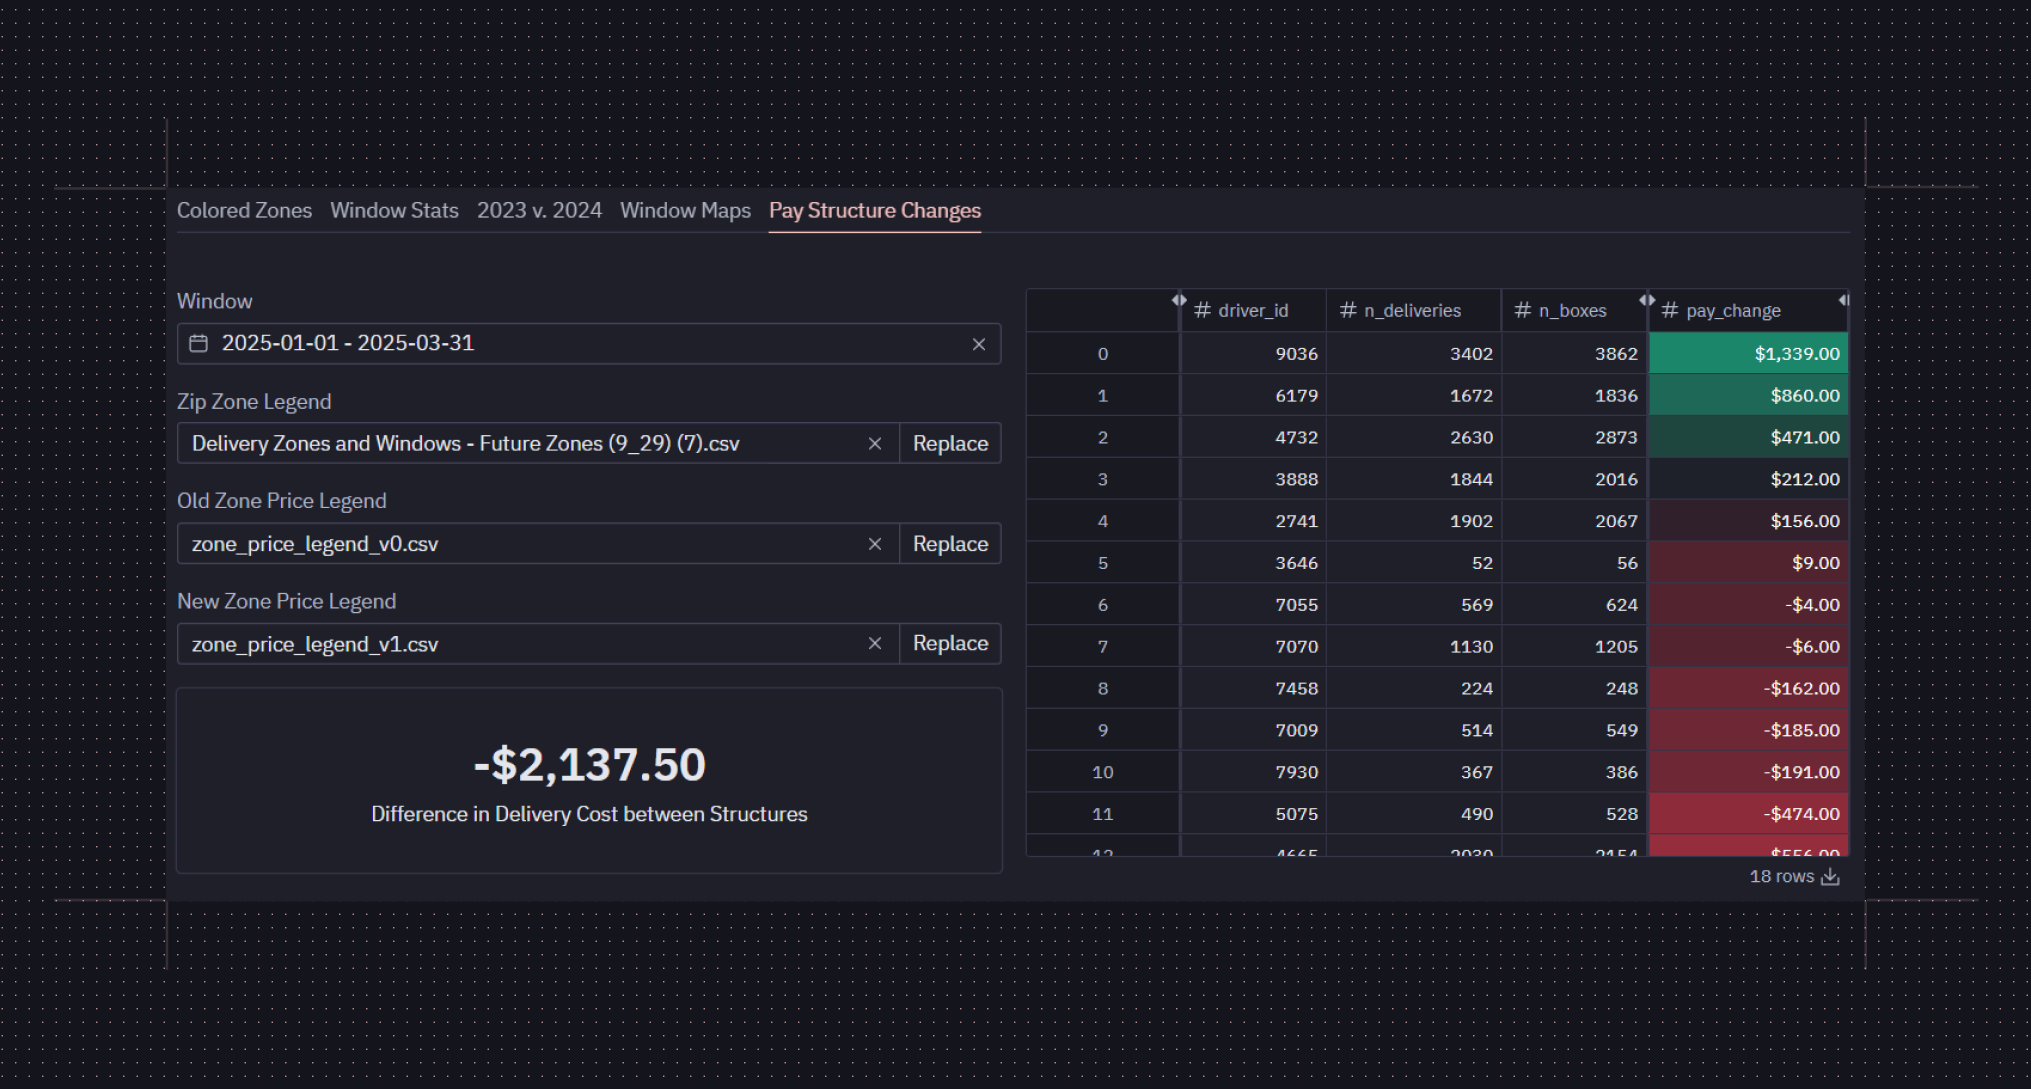
As Farm to People looked to expand their delivery to new areas across New York City, Northern New Jersey, Southern Connecticut, and Westchester County, the fleet team needed to understand delivery density patterns to set delivery fees and design fair driver pay structures. I built a fleet analytics dashboard in Hex that maps delivery patterns and models different pay structures. Using Hex’s map modules I was able to surface delivery clusters, failure hotspots, and routes with consistently longer delivery times, helping the team optimize routes and focus on the highest-impact problem areas. Based on distance, pay rate, and delivery density, we can test pricing scenarios for new delivery areas to understand the impact on driver pay and margins before expanding service areas.
Building semantic models for sales analytics 🤖

Name: Drew Barlage, GlossGenius
Role: Data Analyst II
Favorite Hex feature: Notebooks, Modeling Agent
Go-to chart: Line Chart
Years of using Hex: 2+!
What I built
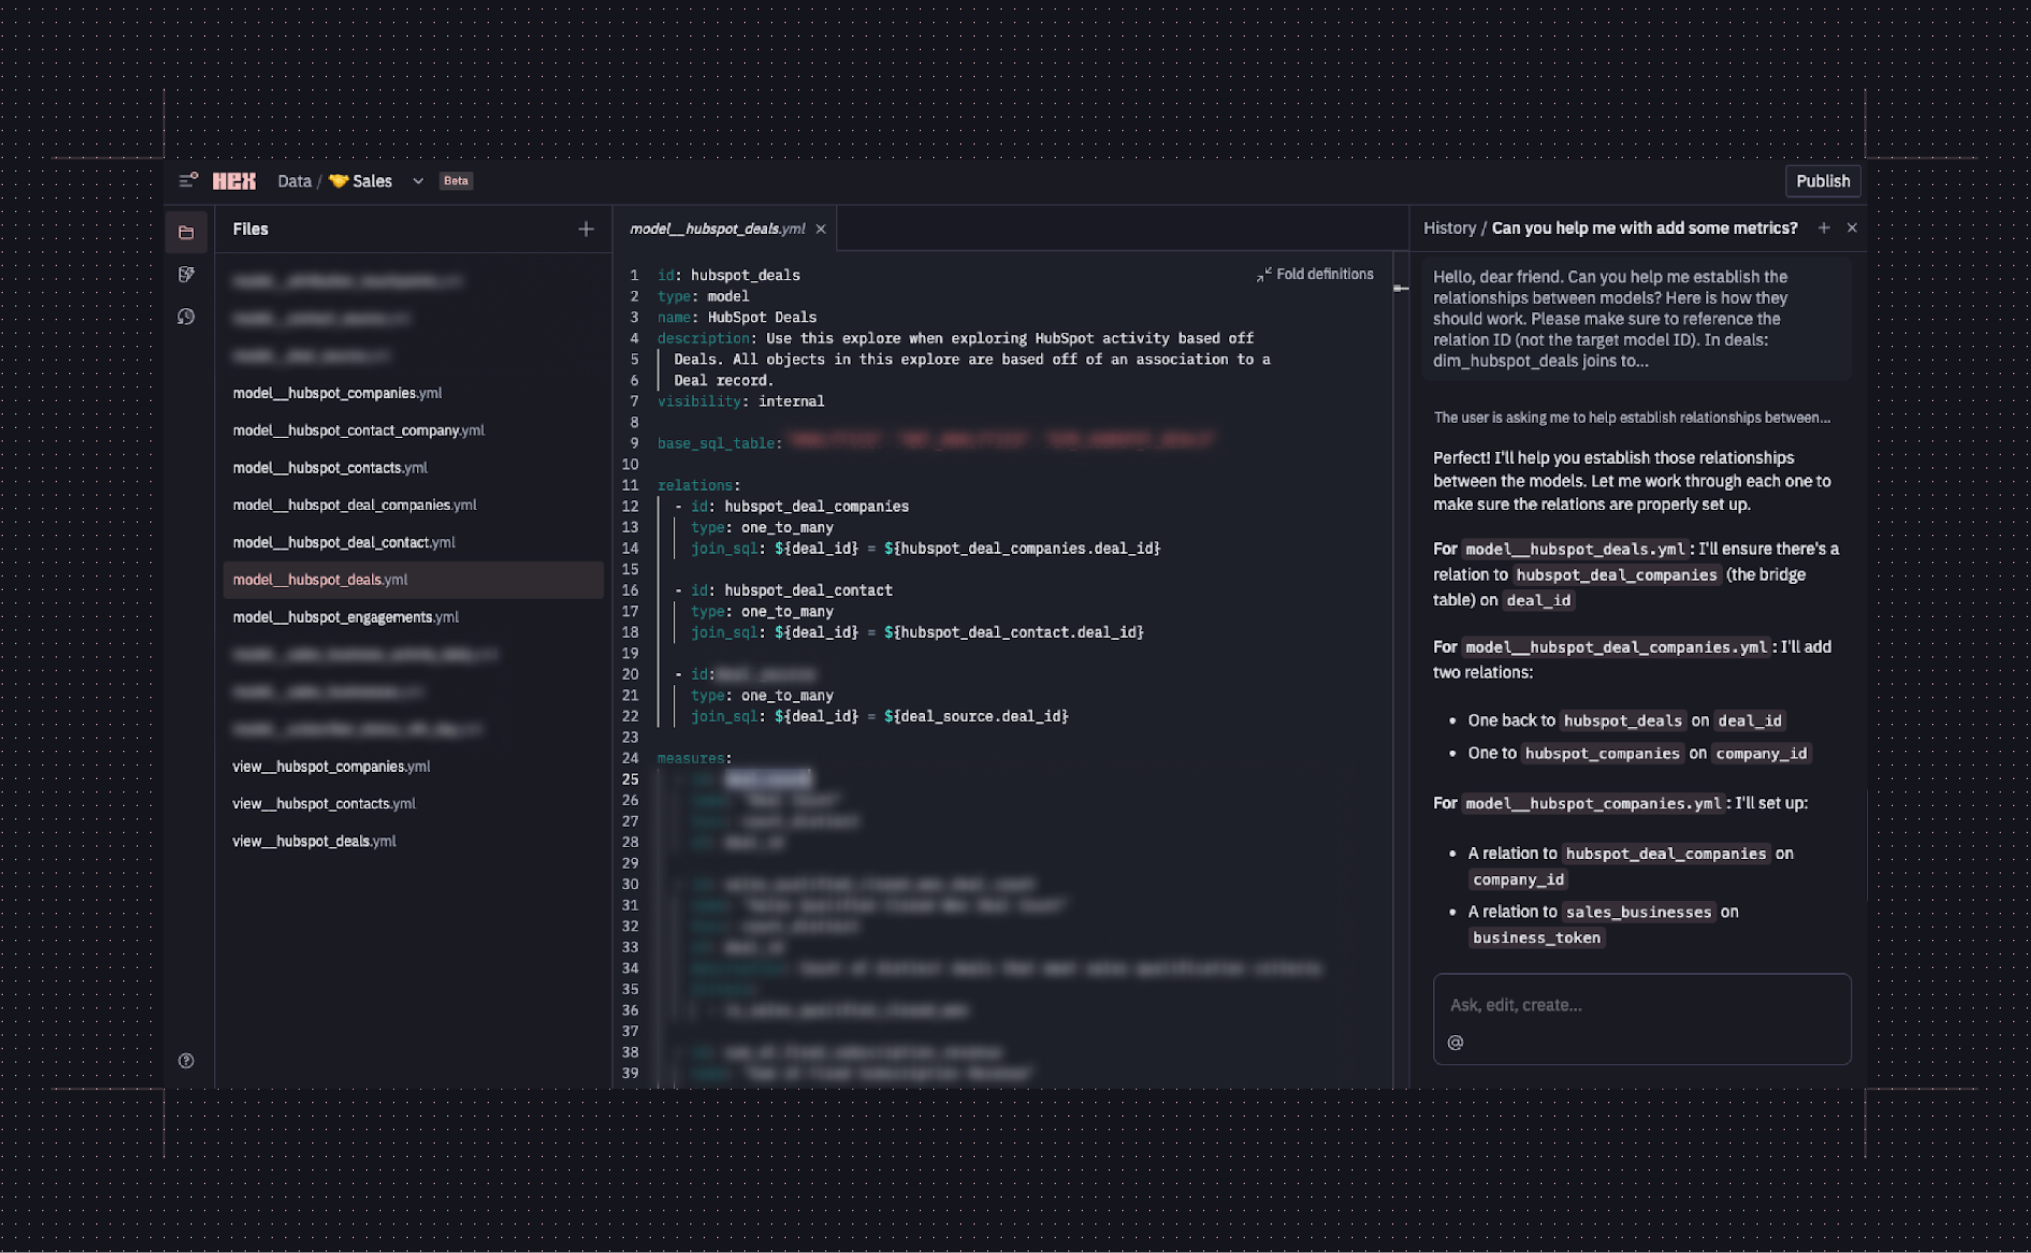
At GlossGenius, we help small beauty and wellness businesses grow faster with tools for payments, booking, and marketing. To support that mission, our teams need fast, accurate insights, so I’ve been helping lead our shift to Hex’s semantic projects for self-serve analytics.
Hex’s AI Modeling Agent has been central to this work. It automatically infers joins, defines metrics, and debugs validation issues, freeing me to focus on structure instead of syntax. When circular dependencies appear, it helps restructure them into modular, reusable views, cutting weeks of work down to hours. With three revenue views and thirteen underlying models, our business teams can now self-serve answers from data in minutes instead of days.
Hex has completely changed how our team approaches semantic modeling. It’s enabled us to build and migrate models faster, giving us a foundation to confidently scale self-serve analytics.
Tracking climate fintech metrics for fundraising rounds 📈

Name: Shimmy Cohen, Coral
Role: Strategic Finance and Business Operations Lead
Favorite Hex Feature: Pivot table to customizable chart visualization + the Notebook Agent has been super useful lately too!
Go-to chart: Bell curve showing repayment trends (using Python)
Years using Hex: 1+
What I built
Coral is a climate fintech startup helping contractors sell heat pumps and energy efficient building upgrades.
With only three engineers all focused on building the product, we needed someone to track our rapidly growing business metrics. Hex helped me step in as the owner of financial and sales analytics, translating raw operational data into clear, decision-ready insights for leadership.
I built a comprehensive finance dashboard that tracks capital deployment, revenue, contractor activity, and repayment metrics, which refreshes automatically every morning. Using SQL and Python in Hex, I created everything from month-over-month visualizations to bell curve repayment distributions. The dashboard combines high-level executive metrics with granular contractor-level drill-downs, letting our team track performance across products, programs, and customers. This has become essential for fundraising conversations, enabling us to instantly pull answers from our data when investors ask questions about our historical performance and sales trends.
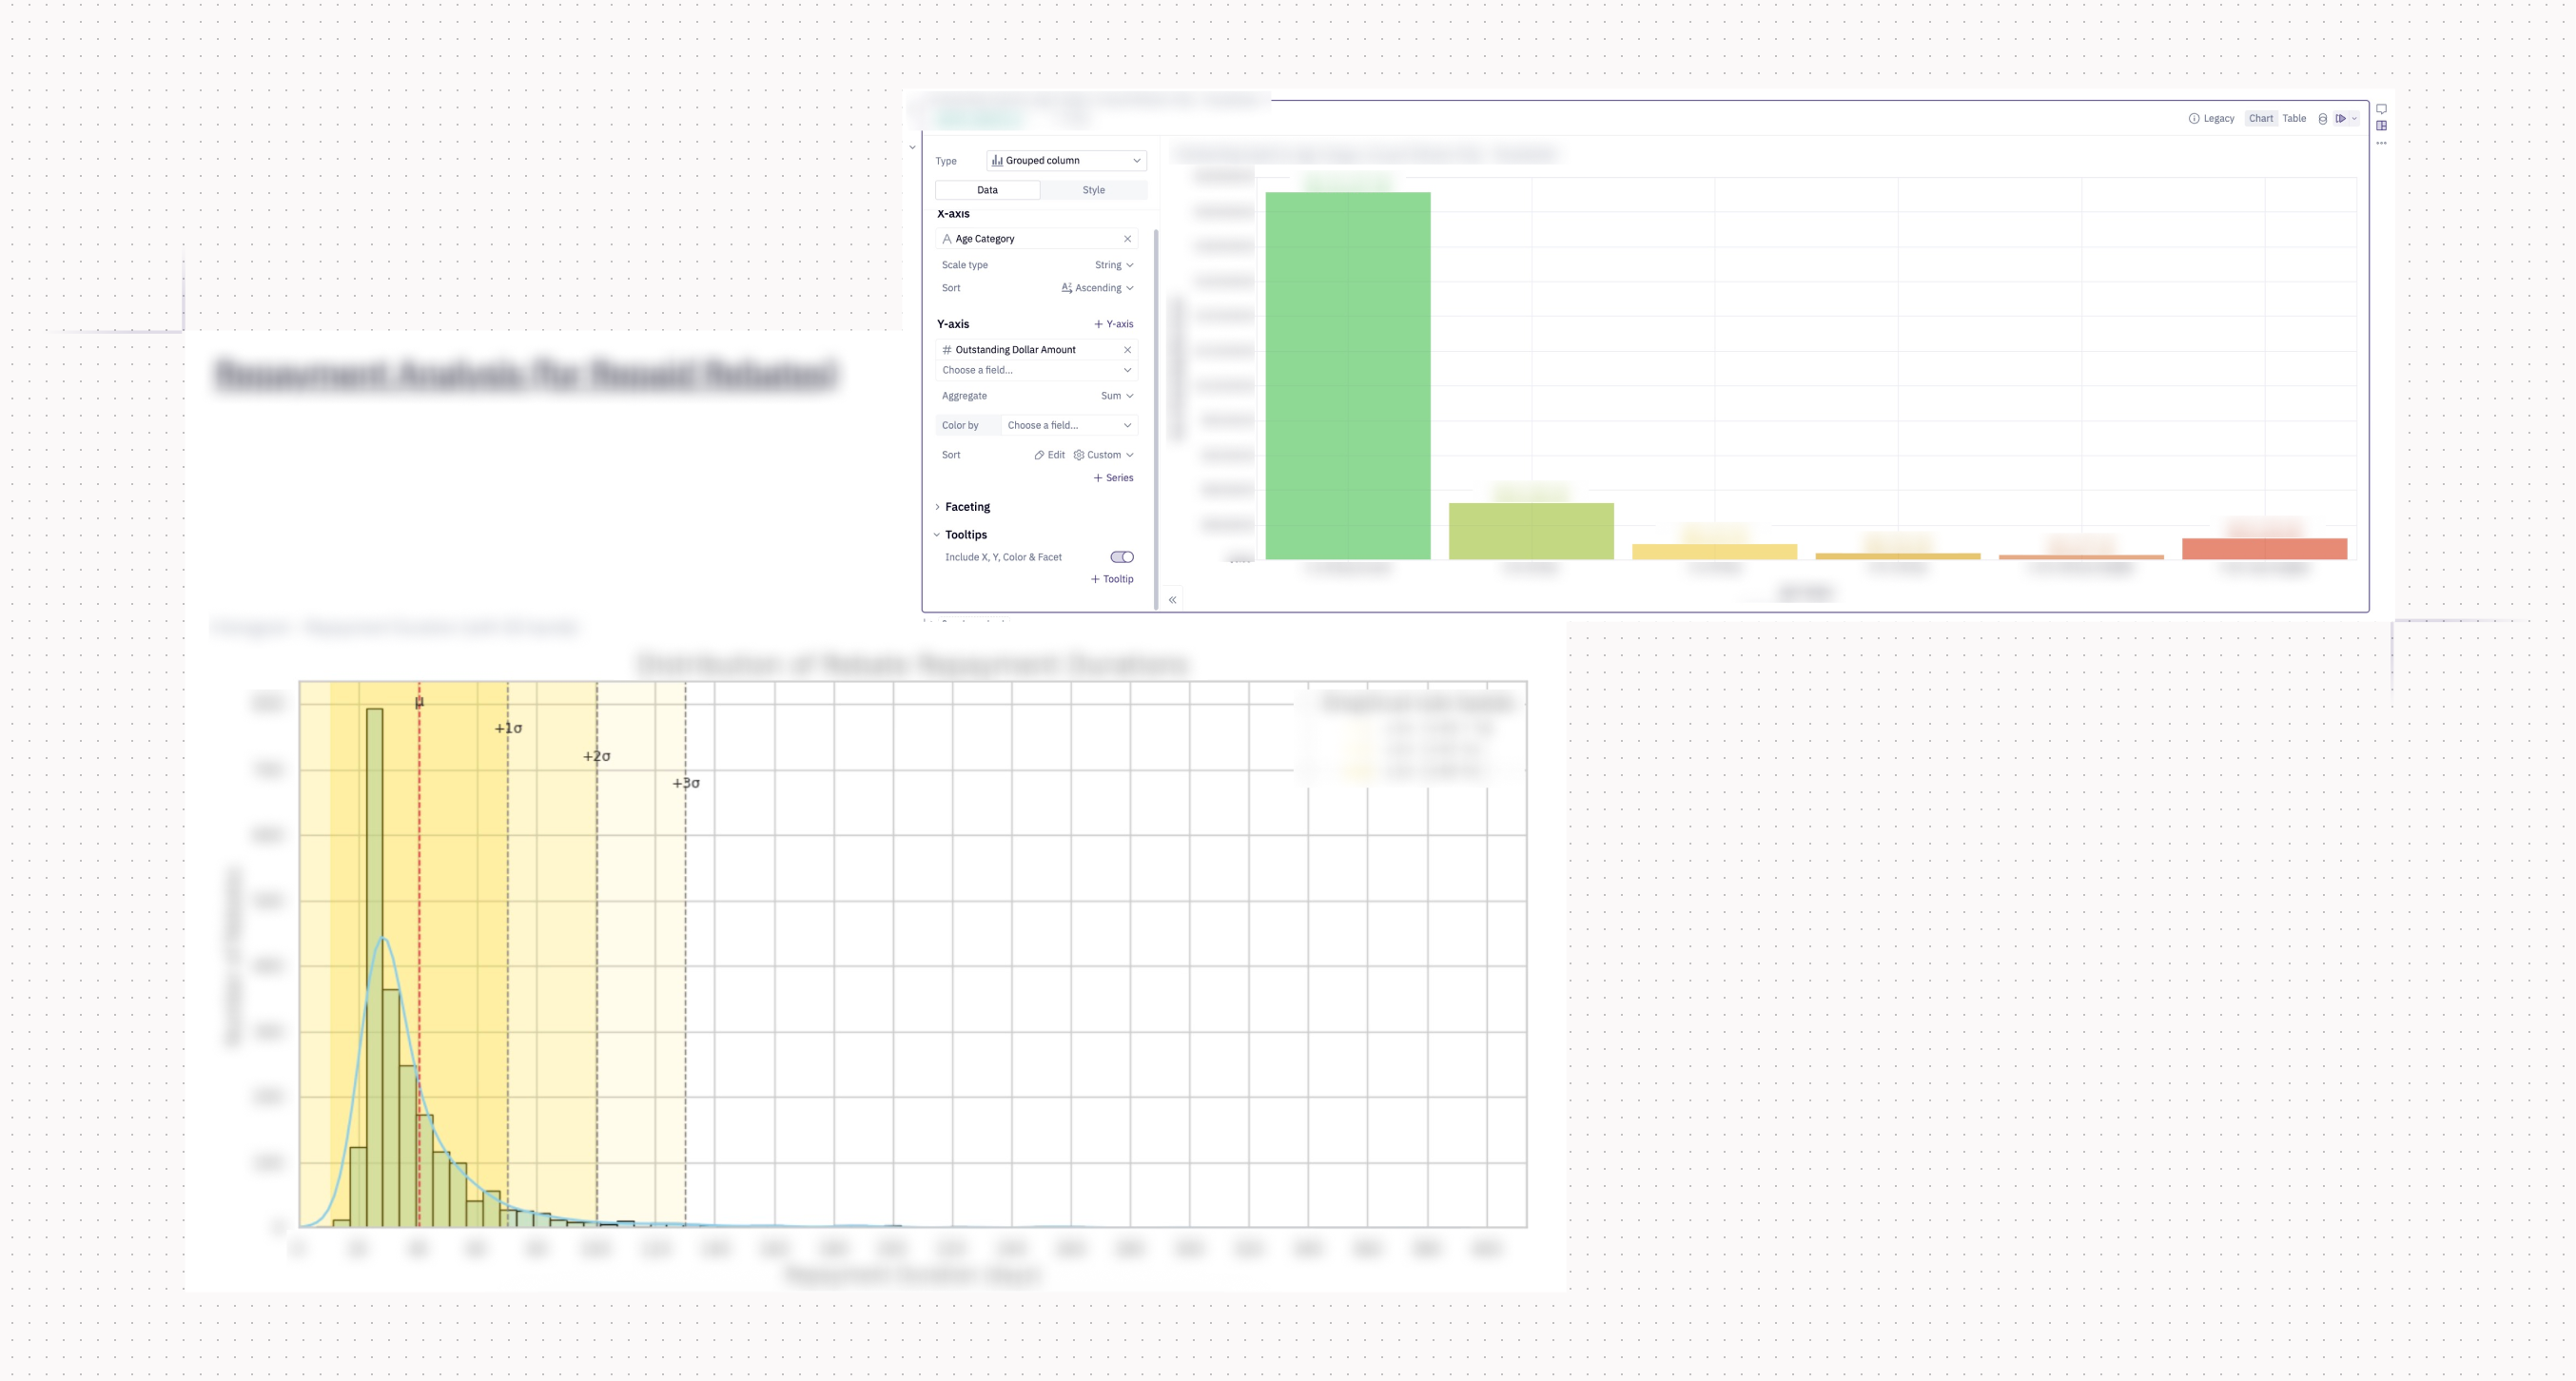
*Data has been randomized for example purposes only
More on Data teams