Blog
Hex in the Wild: November 2025 spotlights
Real data, real people, real impact — all built with Hex.


With the launch of our Notebook and Threads agents, more teams than ever are getting answers from data using AI.
In this edition of Hex in the wild, we’re spotlighting how builders across data and product use Hex to predict churn, measure product success, and keep business performance aligned.
Have you built something cool in Hex and want to brag about it? Let us know →
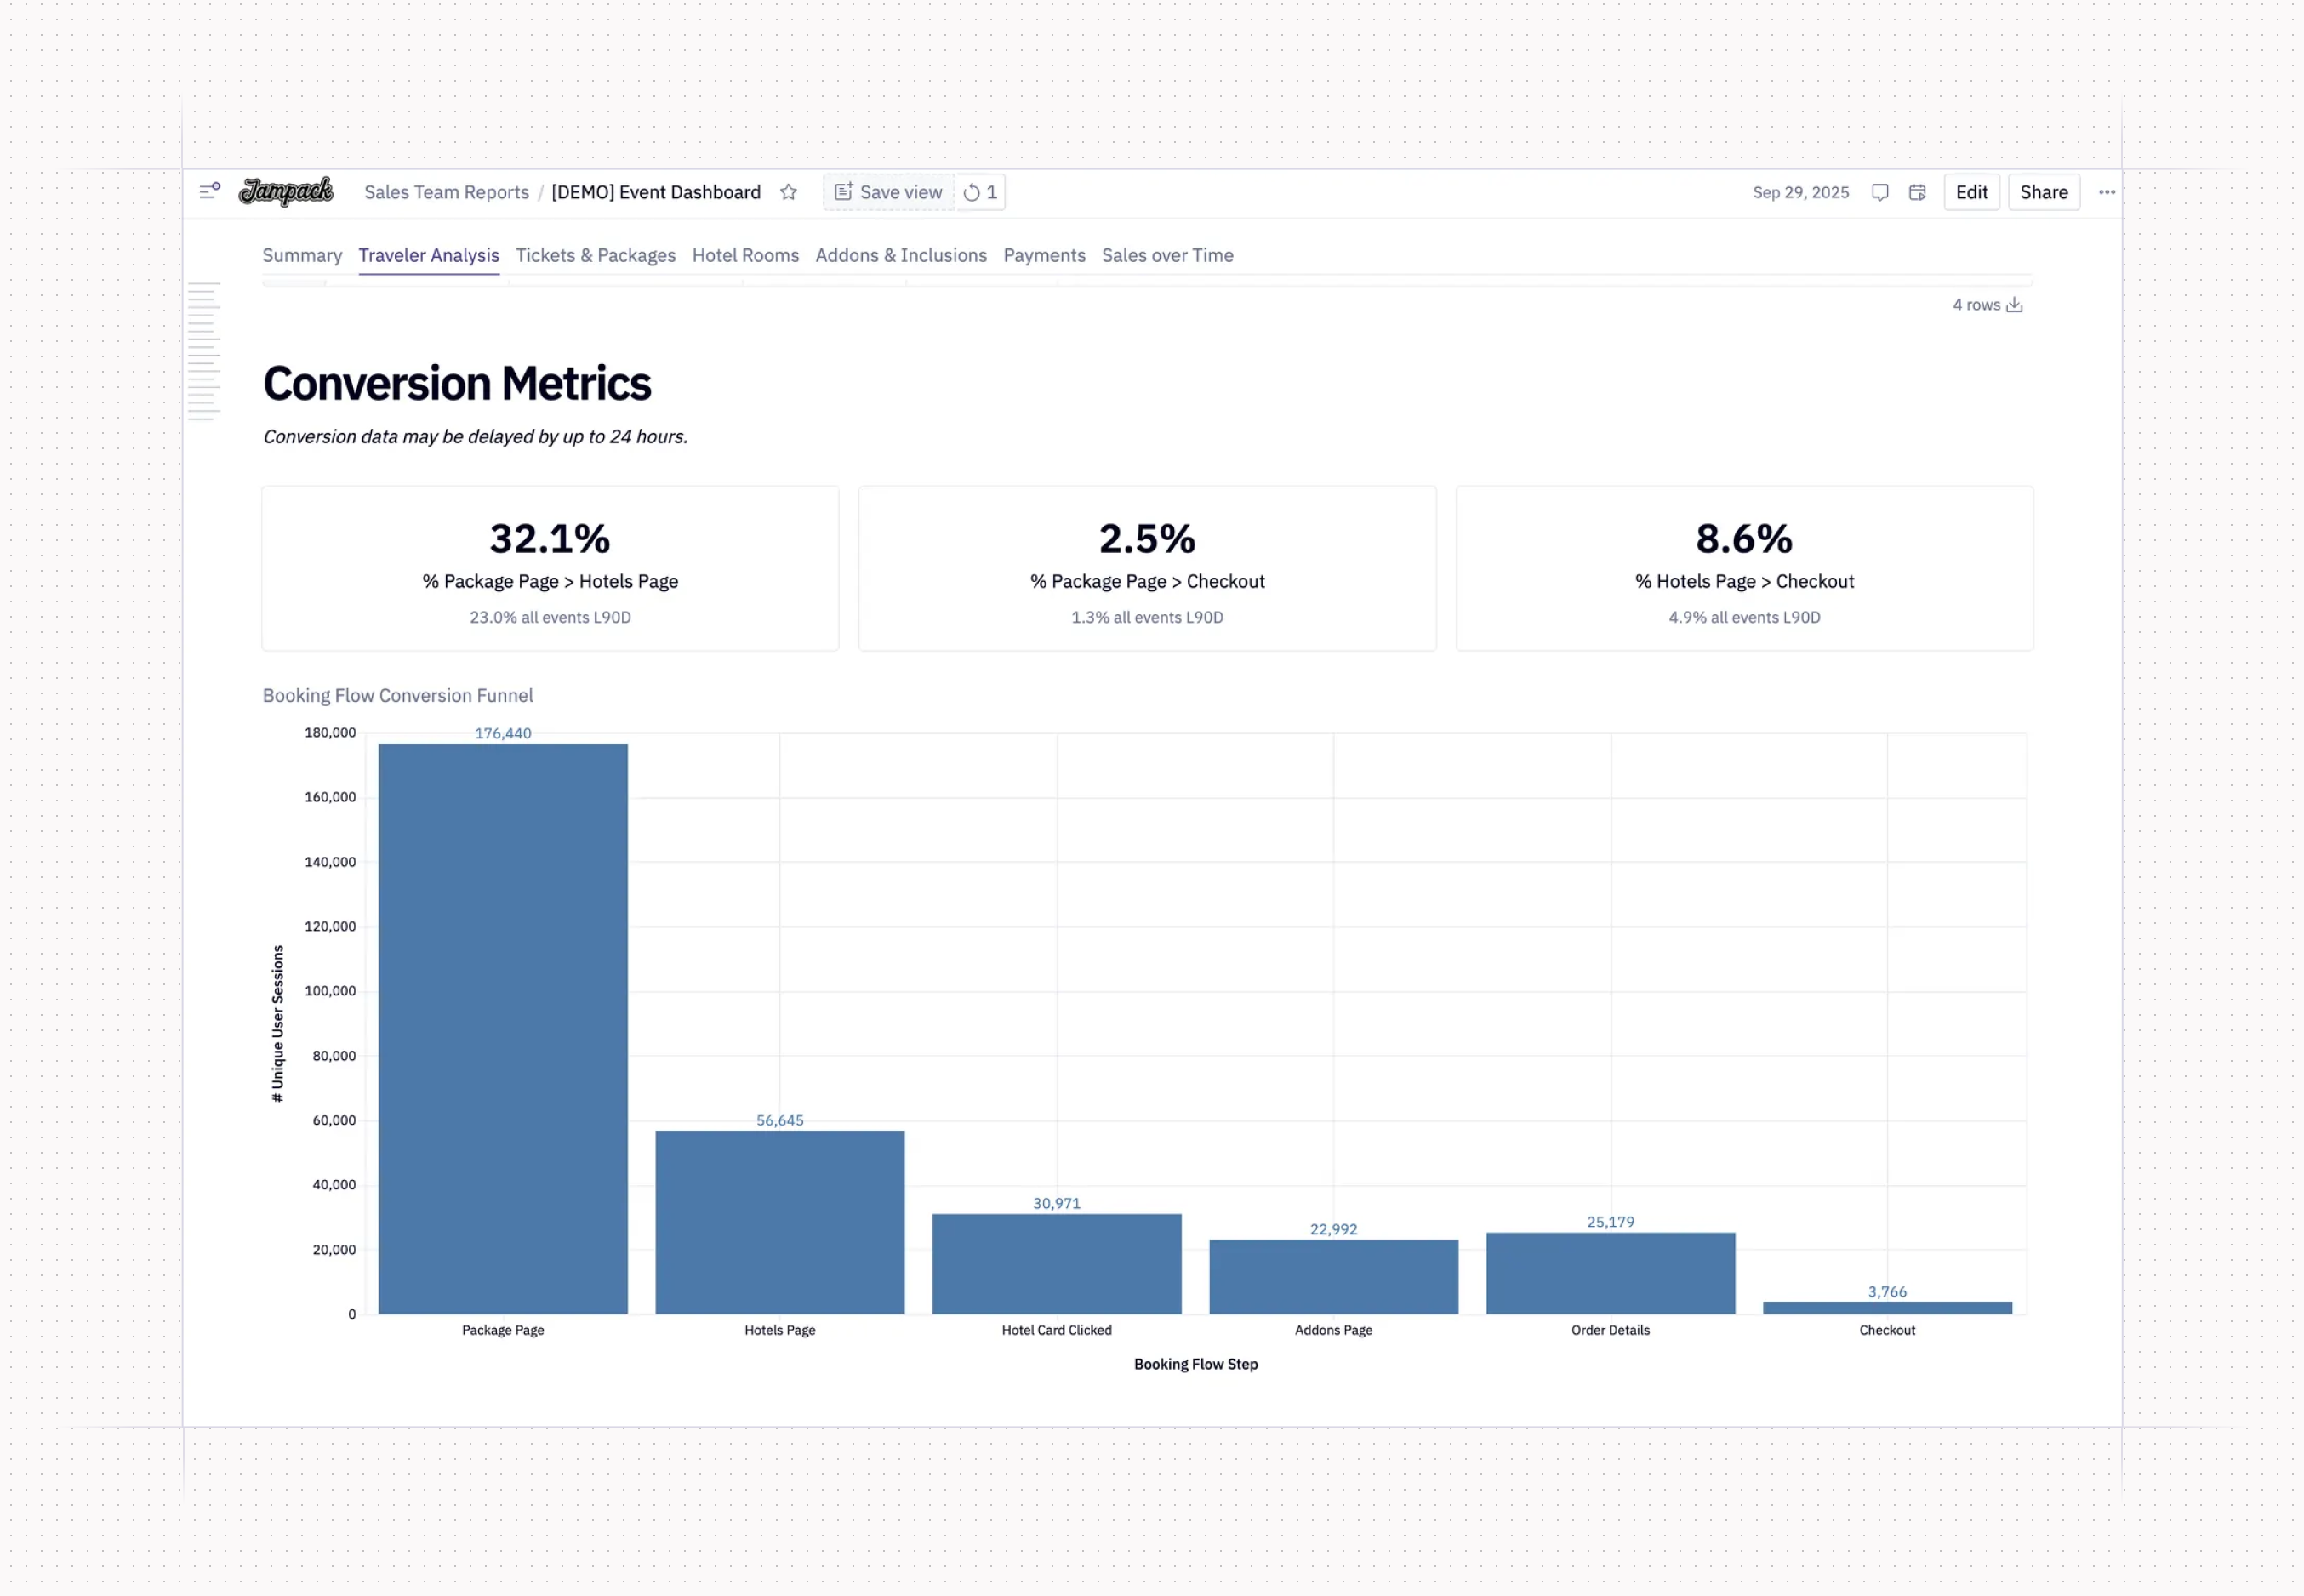
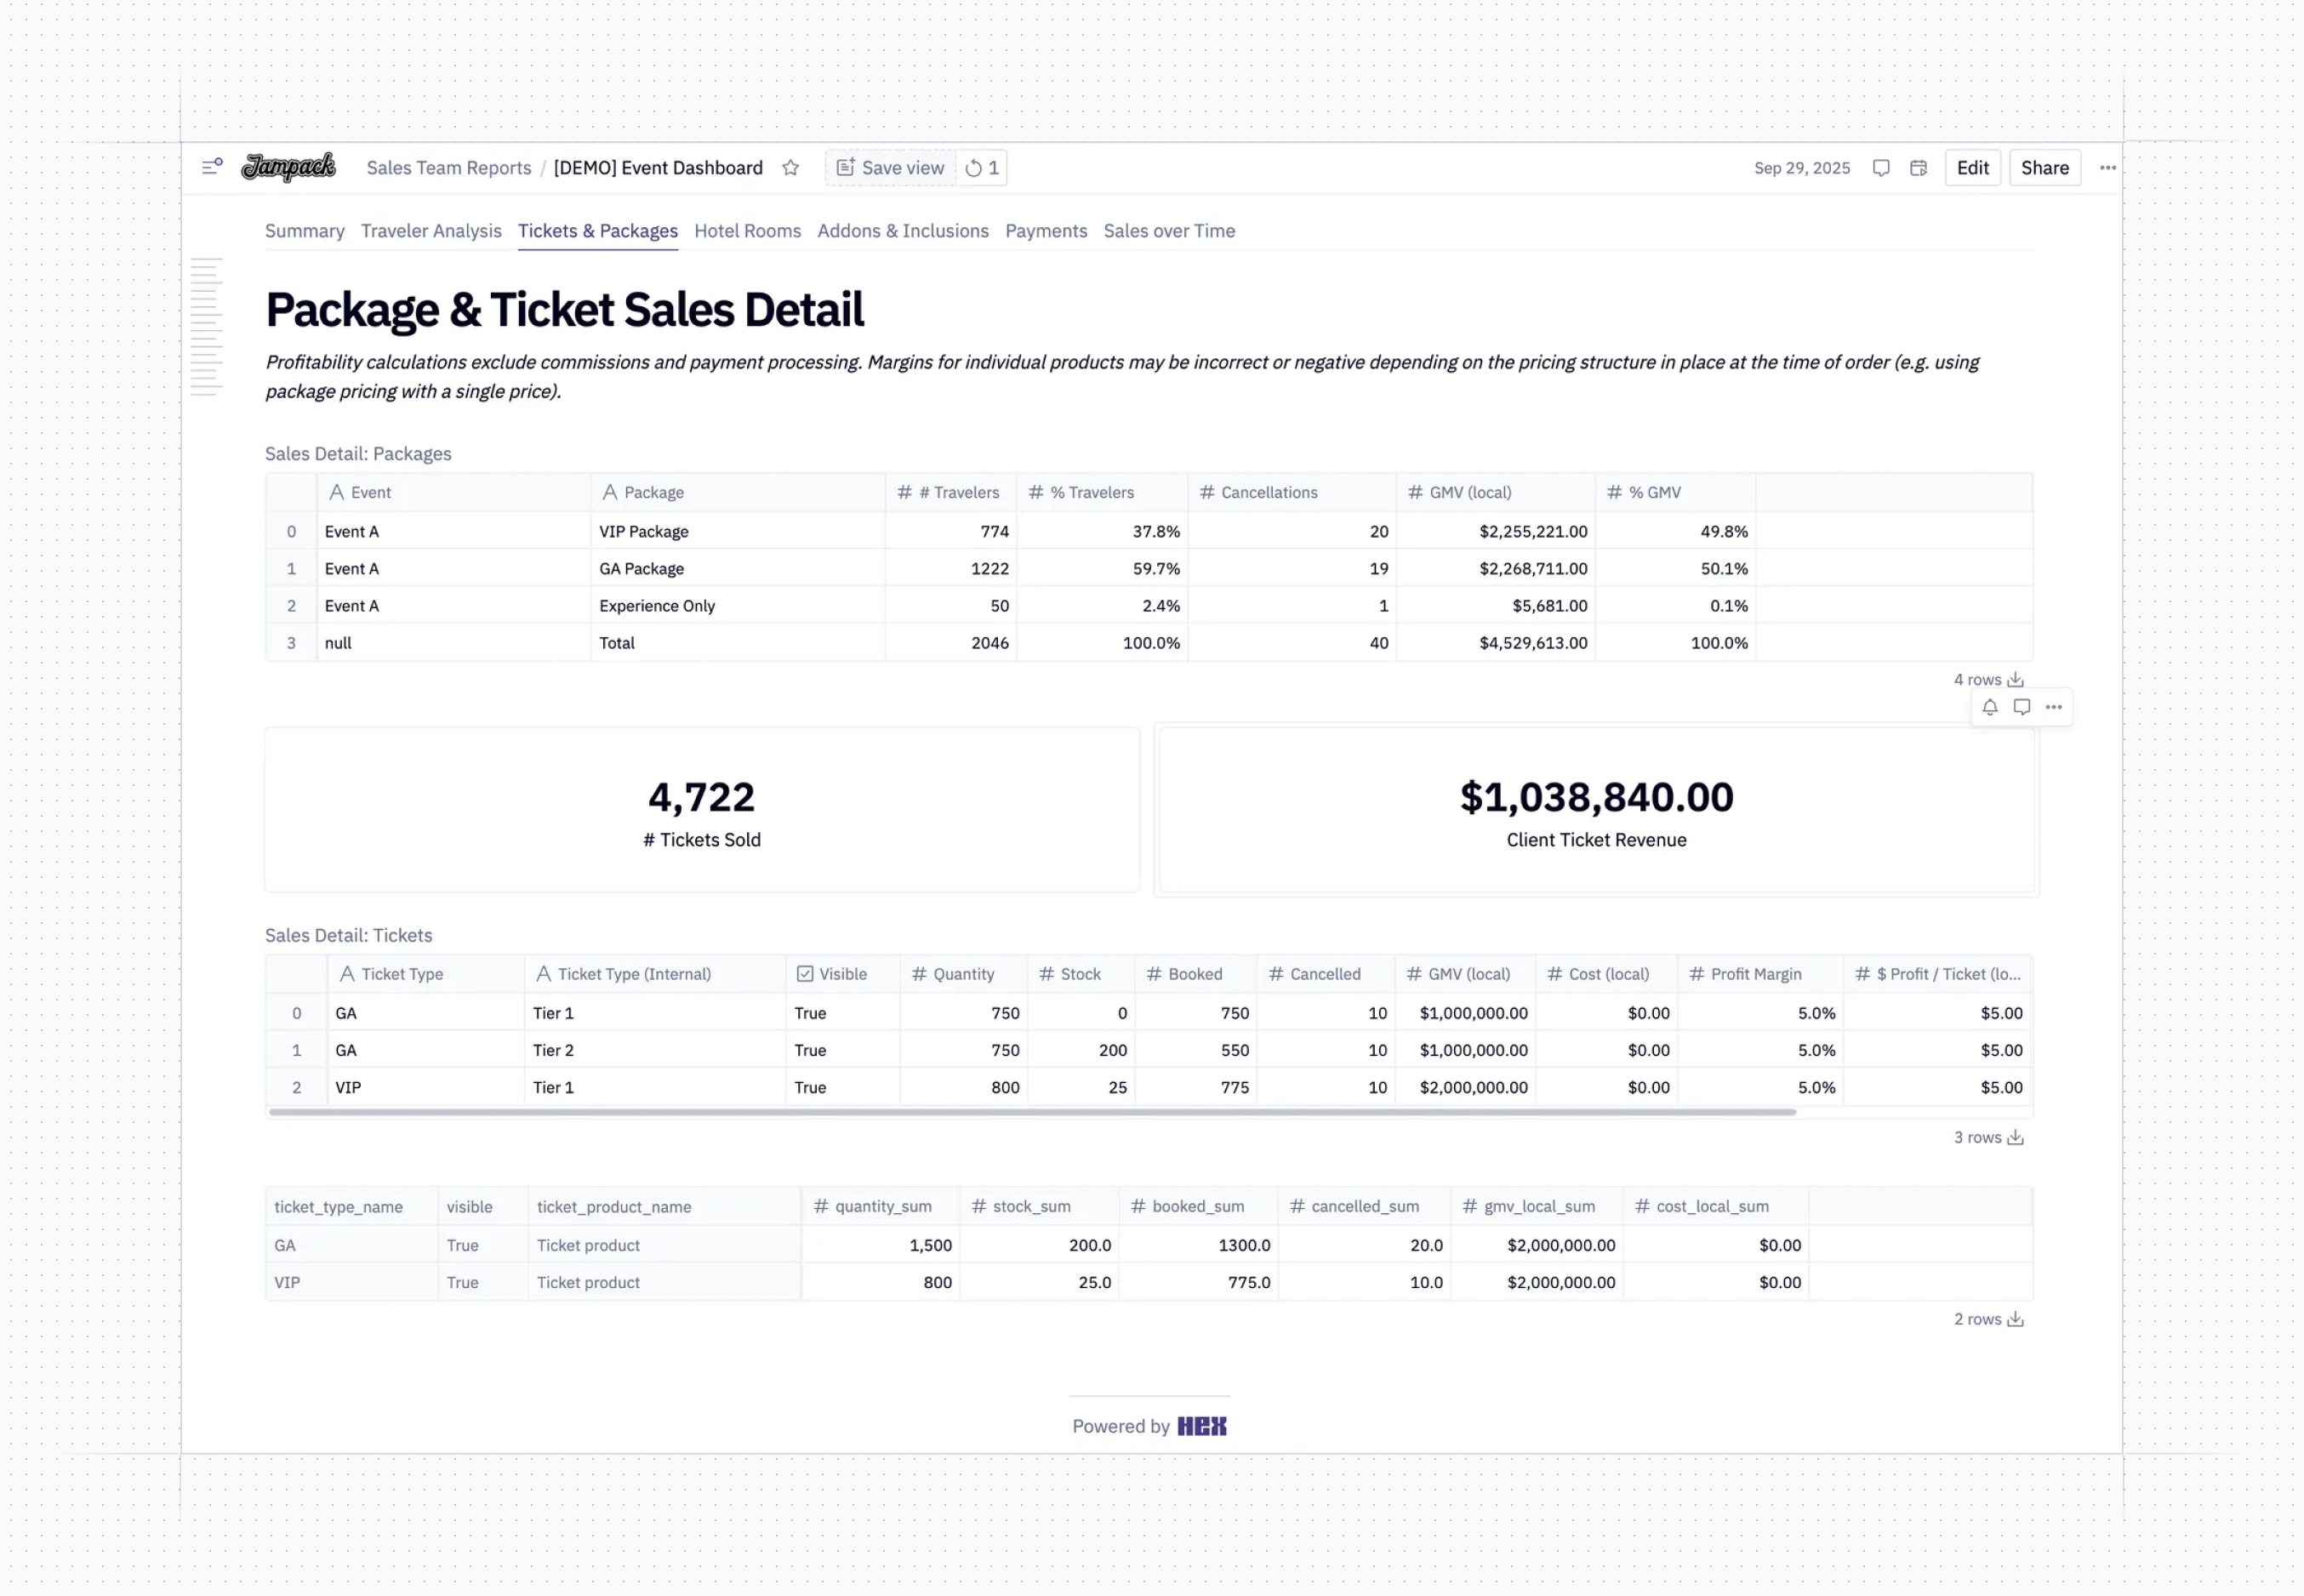
Bringing travelers, tickets, and data together ✈️

Name: David DyTang
Role: Principal Product Manager, Jampack
Favorite Hex feature: Scheduled runs
Go-to chart: Stacked area chart
Years using Hex: 1+
What I built
At Jampack, we make it easy for fans to travel to the events they love by bundling tickets, hotels, and experiences into one seamless package. We started using Hex to align on company performance through simple sales and inventory reports, which have since evolved into data apps that track revenue, event pacing, and traveler behavior—helping teams measure growth, refine pricing, and plan supply with confidence.
Because Hex combines SQL, Python, and visualizations in one place, it’s enabled us to explore advanced use cases like traveler analysis—showing where customers come from, how often they book, and which packages convert best. Parameters and built-in variables let us explore event performance and deliver customized app views for clients, powering smarter decisions across marketing, sourcing, and client success.
Predicting customer churn in real time 🔮

Name: Mark Boongaling
Role: Data & Analytics Lead, aXcelerate
Favorite Hex feature: SQL + Python
Go-to chart: Scatterplot
Years using Hex: 1+
What I built
At aXcelerate, we power training, compliance, and learning management for vocational education providers across Australia. To stay ahead in retention and growth, I built a customer risk-scorecard app in Hex that predicts churn by combining signals from our product analytics, support platform, CRM, NPS surveys, and billing data.
The scorecard rolls everything up into a clear risk level for each account, which is visible company-wide. When customers cross a threshold, the app automatically creates tickets so teams can act immediately. What used to be a one-off, weeks-long reporting exercise is now a live, automated system. Hex makes this possible by letting us pull data from multiple systems into one place and connect it directly to the workflows our teams already use.
Tracking product adoption across every release 🚀

Name: Jack Christensen
Role: Product Manager, aXcelerate
Favorite Hex feature: Notebook Agent
Go-to chart: Line Graph
Years using Hex: 1+
What I built
I use Hex to build data apps that track adoption and success metrics for new features. Each app blends product usage data, event analytics, support tickets, and revenue from our CRM into a single view. This lets our product teams measure outcomes like reduced onboarding time or increased revenue without relying on gut feel. Before Hex, getting these insights required engineering support or slow, custom BI reports.
Now with the Notebook Agent, I’m able to build and share apps with other PMs and cross-functional teams in minutes. It’s made data-driven feature releases the norm at aXcelerate.
Looking for more inspiration on what you can build inside of Hex? Check out our template library.
More on Data teams