Blog
Hex in the Wild: October 2025 spotlights
Real data, real people, real impact — all built with Hex.


Every day, tens of thousands of Hex users are cooking up data magic and bending the laws of analytics. From mapping global product usage to automating school reports and tracking podcast ad spend, this work goes far beyond a static dashboard.
With Hex in the wild, we’re spotlighting a few maverick users to show how they’re pushing the boundaries of data with Hex. Each profile highlights an ambitious data person, a favorite app they’ve built, and the impact on their business.
Have you built something cool in Hex and want to brag about it? Let us know →
Visualizing global product usage with Mapbox 🌎

Name: Jonathan Paquette
Role: Senior Analytics Engineer, OpenSpace
Favorite Hex feature: Email Domain Whitelisting for Viewers & SQL Cells
Go-to chart: Line chart
Years using Hex: 2+
What I built
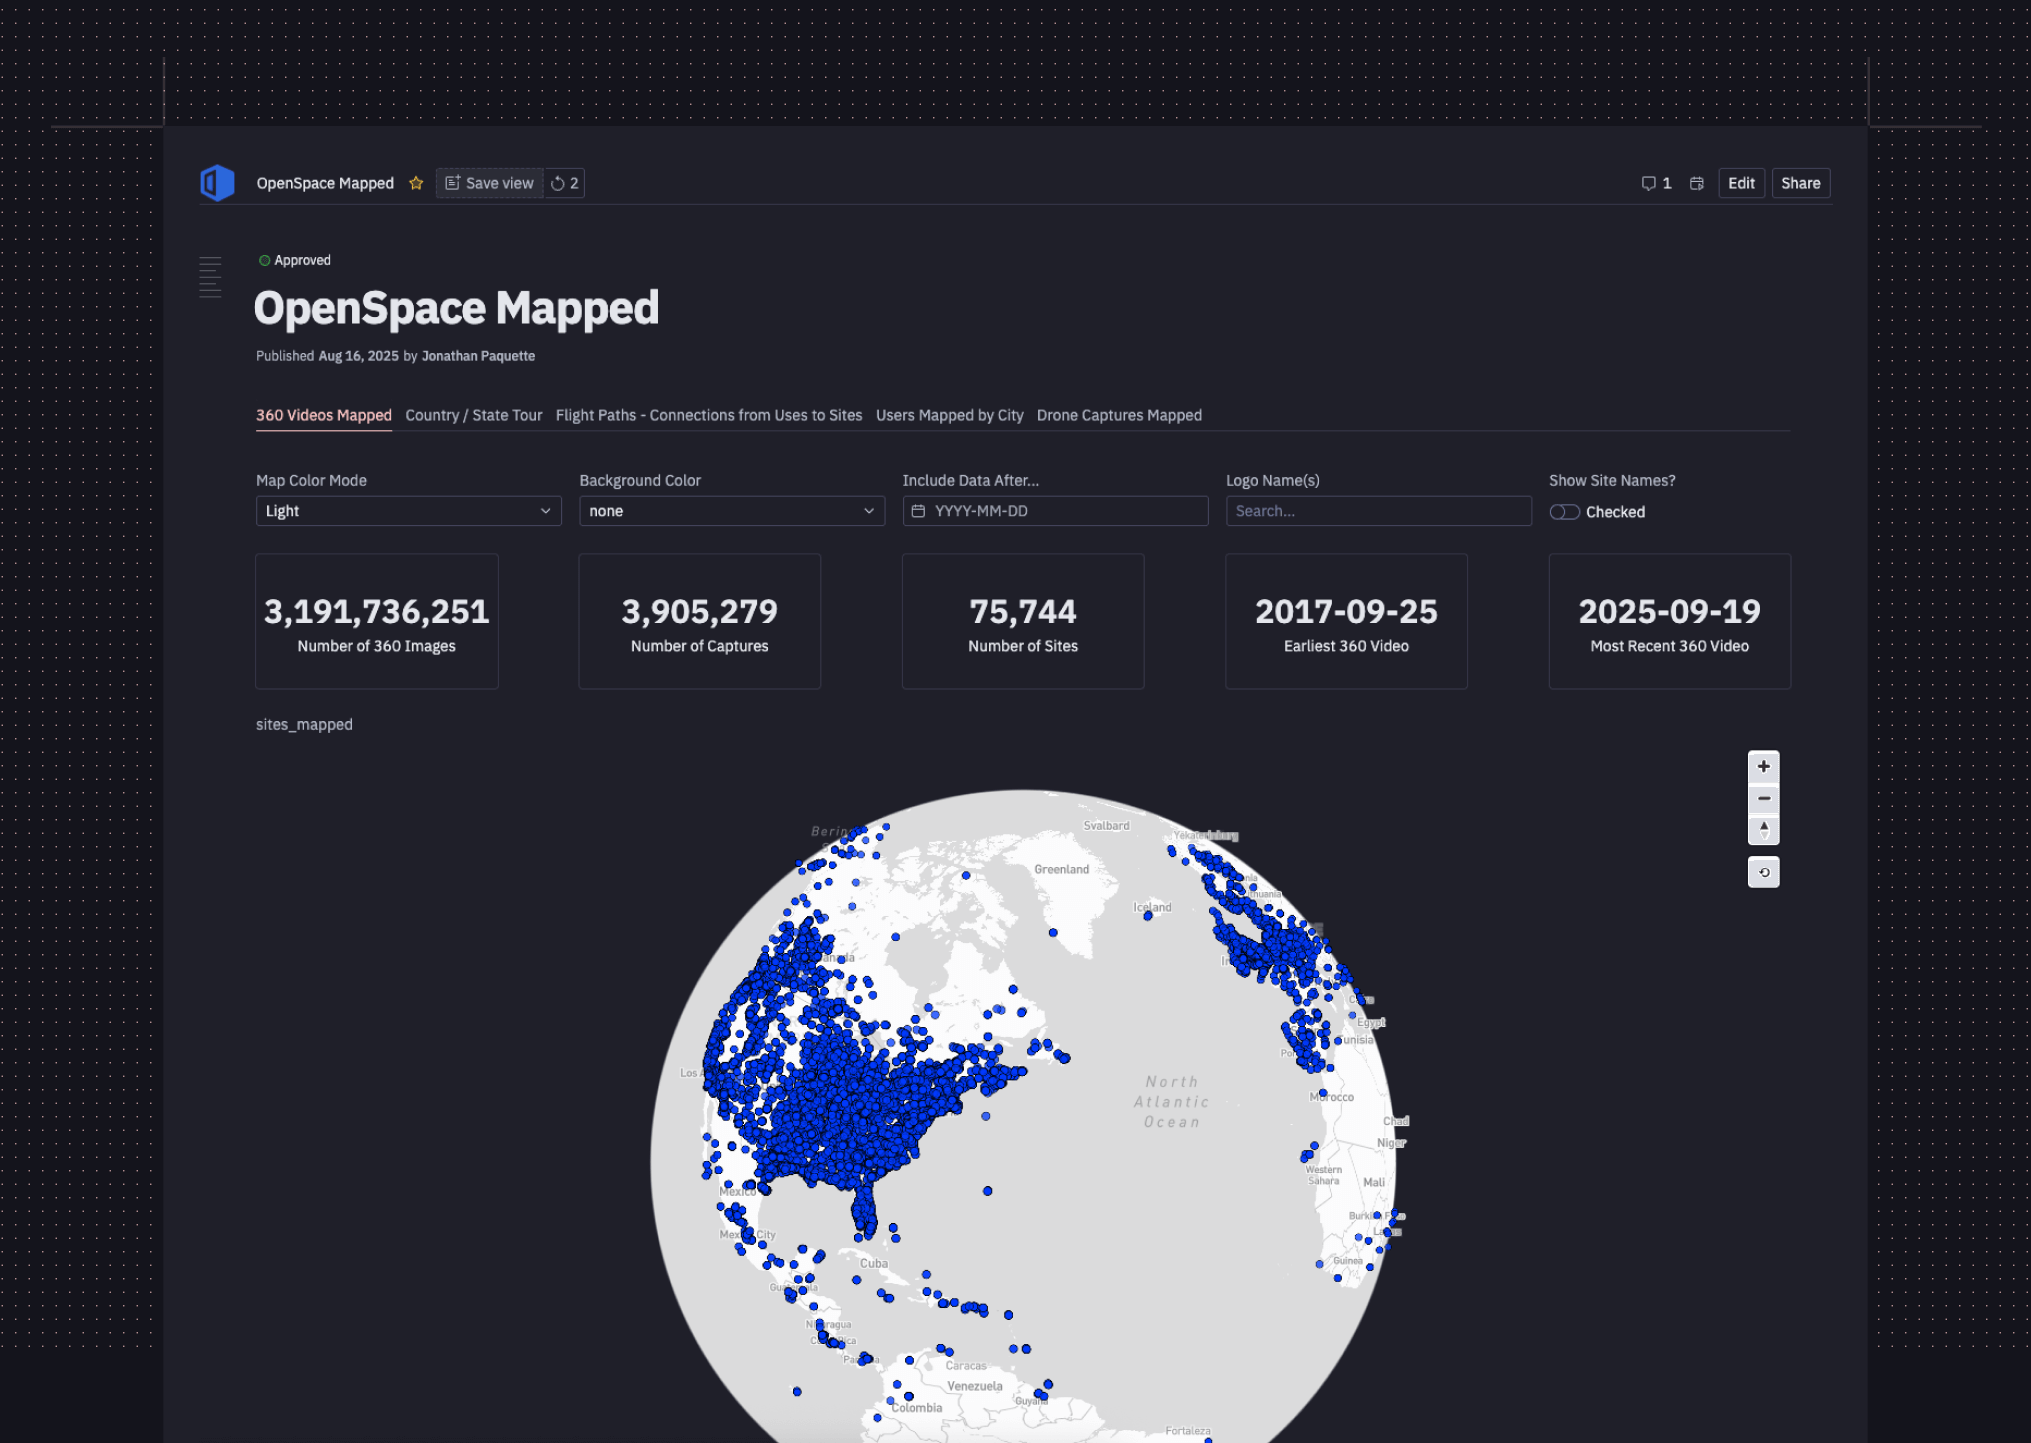
OpenSpace provides AI-powered 360° jobsite capture and progress tracking for construction.
Being a global company, I created a map in Hex that interactively visualizes where OpenSpace’s technology is being used. It pulls project location data from Snowflake, runs lightweight Python transformations, and renders a fully interactive Mapbox view with over 100,000 pins. This has become a core tool across sales, product, and leadership — helping teams visualize adoption worldwide and explore new opportunities. We’ve layered in drone capture locations and legal/regulatory overlays, making it a go-to resource for everything from customer expansion to compliance checks.
I’ve experimented with countless mapping tools: Google My Maps, Tableau, Metabase, Omni, and multiple Python libraries. For OpenSpace’s dataset scale and complexity, the only viable option is Mapbox, and Hex is hands-down the best way to host and share that visualization seamlessly across teams.
Automating school-level PDF reports 📚

Name: Jenn Schilling
Role: Business Intelligence Manager, Albert.io
Favorite Hex feature: Comparison value on single value cells, user groups, SQL+Python
Go-to chart: Bar graph
Years using Hex: <1
What I built
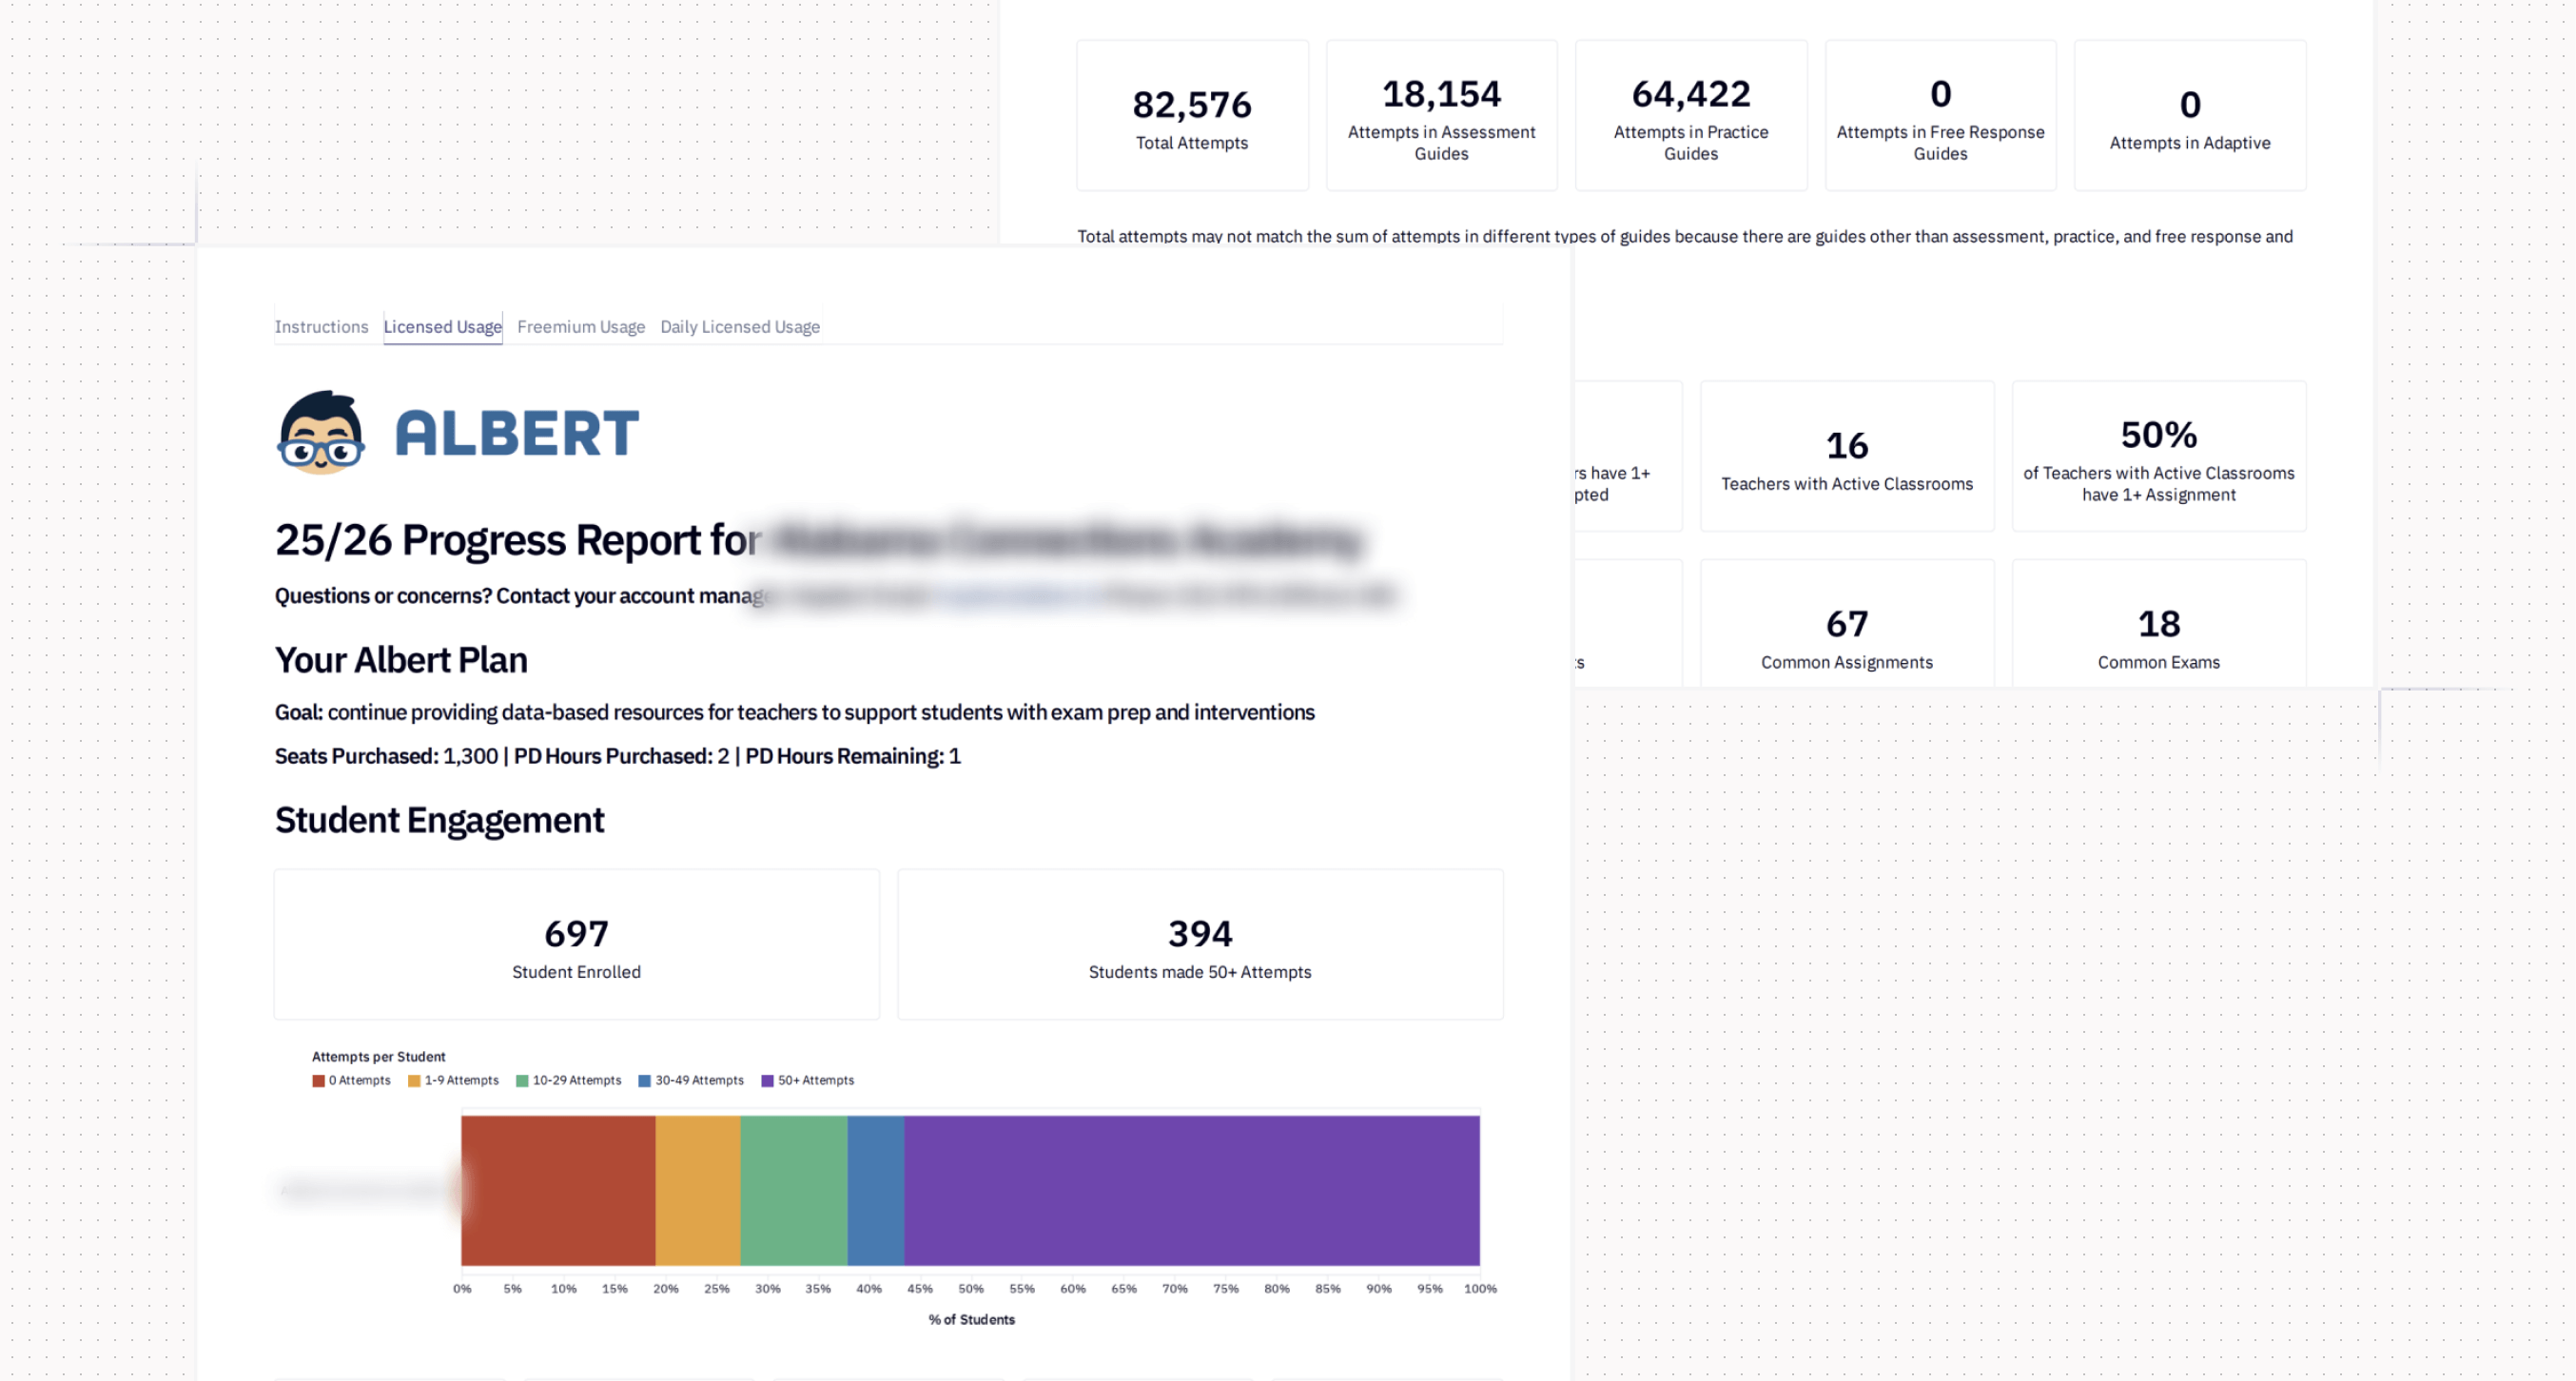
Albert.io supports schools and districts with curriculum-aligned practice and assessments. As a team of one, I rely on Hex to power all of Albert’s internal and external reporting.
One of my biggest wins has been automating school-level PDF reports that used to take hours of manual effort each year. Now I can generate and add them to our CRM directly through Hex apps, saving significant time and ensuring accuracy. I’ve also built logic that personalizes apps for different users automatically — showing account managers only their assigned districts, providing managers with roll-ups across teams, and populating external reports with the correct contact details for the account owner. Combined with integrations to tools like Airtable, this has made Hex our all-in-one hub for reporting, automation, and action.
Podcast partner power rankings 🎧

Name: Rachel Whaley
Role: Director of Data Science & Operations, RedCircle
Favorite Hex feature: Love the integration with dbt for documentation & testing info
Go-to chart: Single-value with the built-in percent change comparison
Years using Hex: almost 4!
What I built
At RedCircle, we help brands scale host-read podcast ads across hundreds of shows, giving brands reach and creators real revenue. As our team grows, keeping tabs on our top partners is critical.
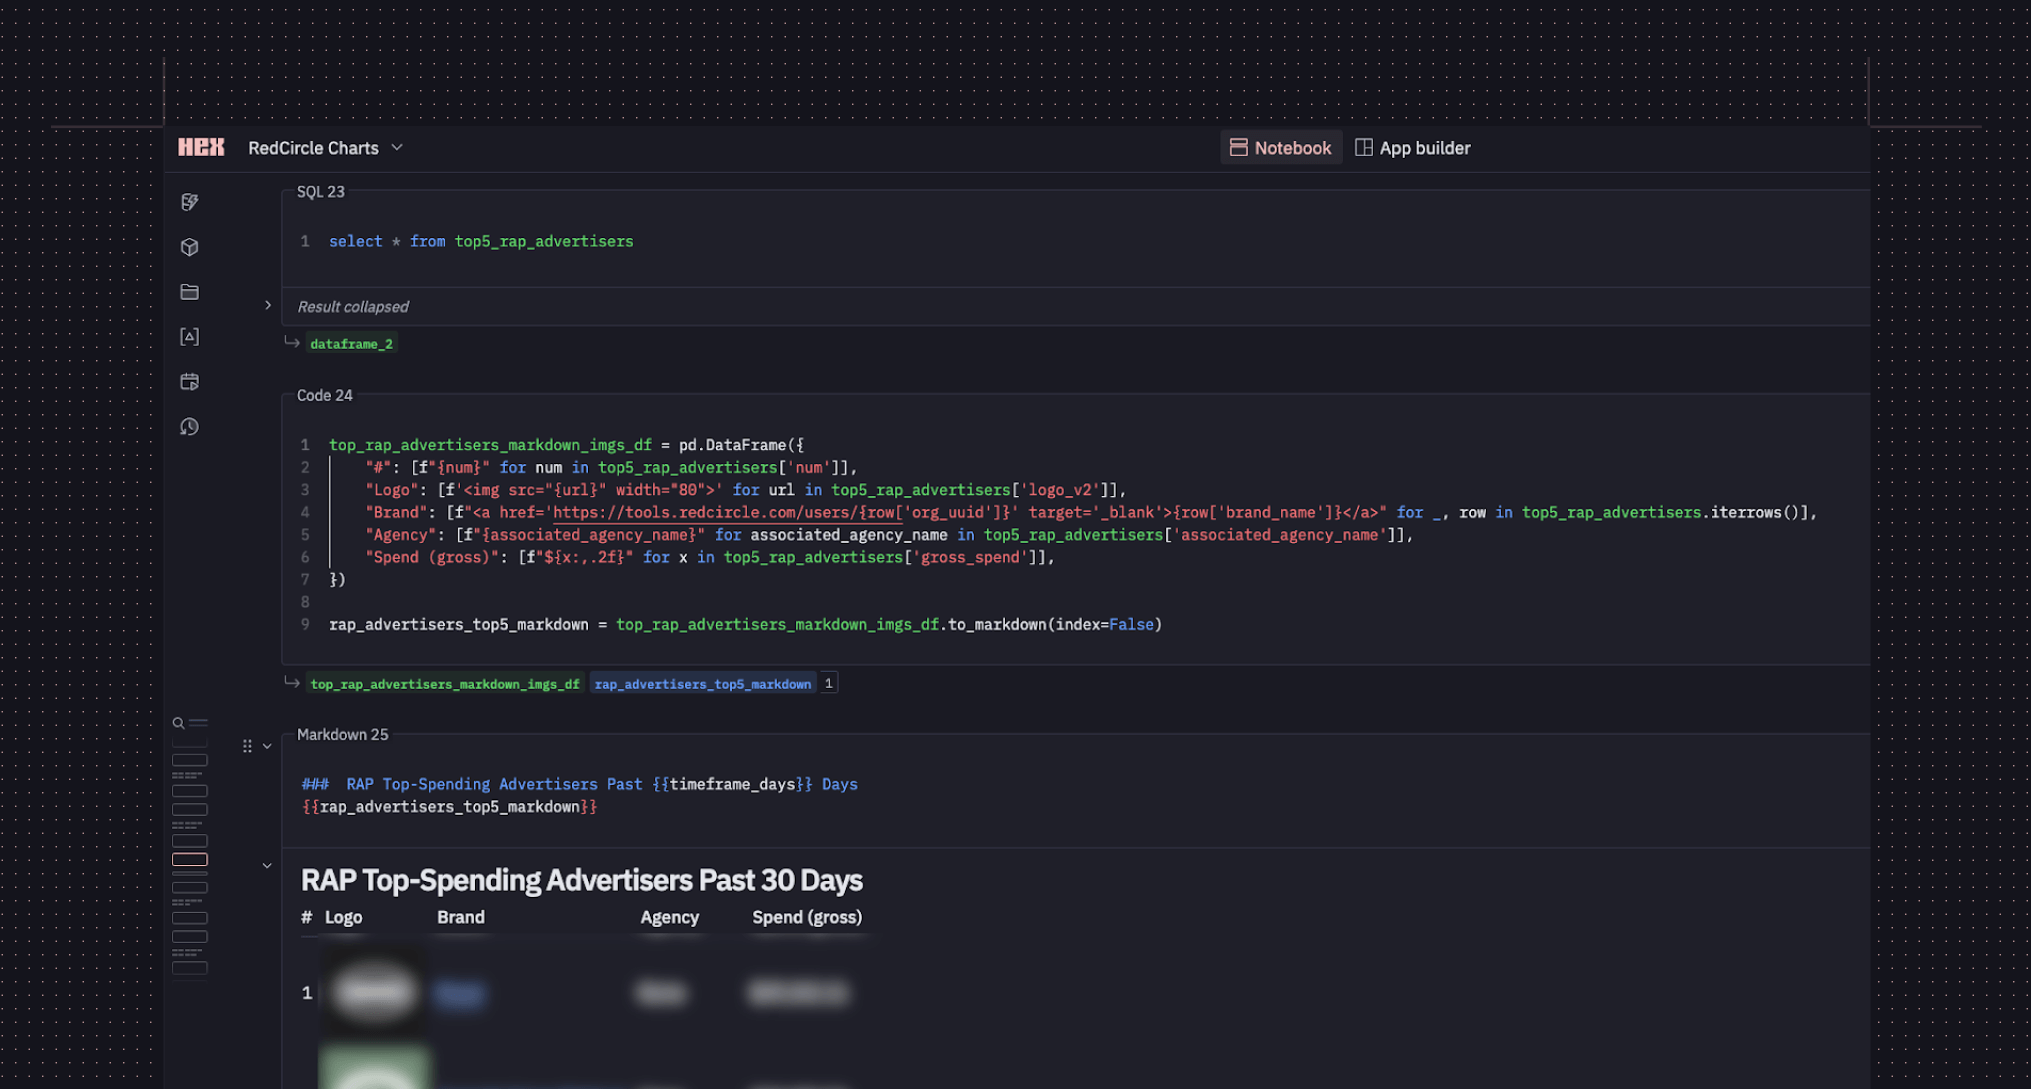
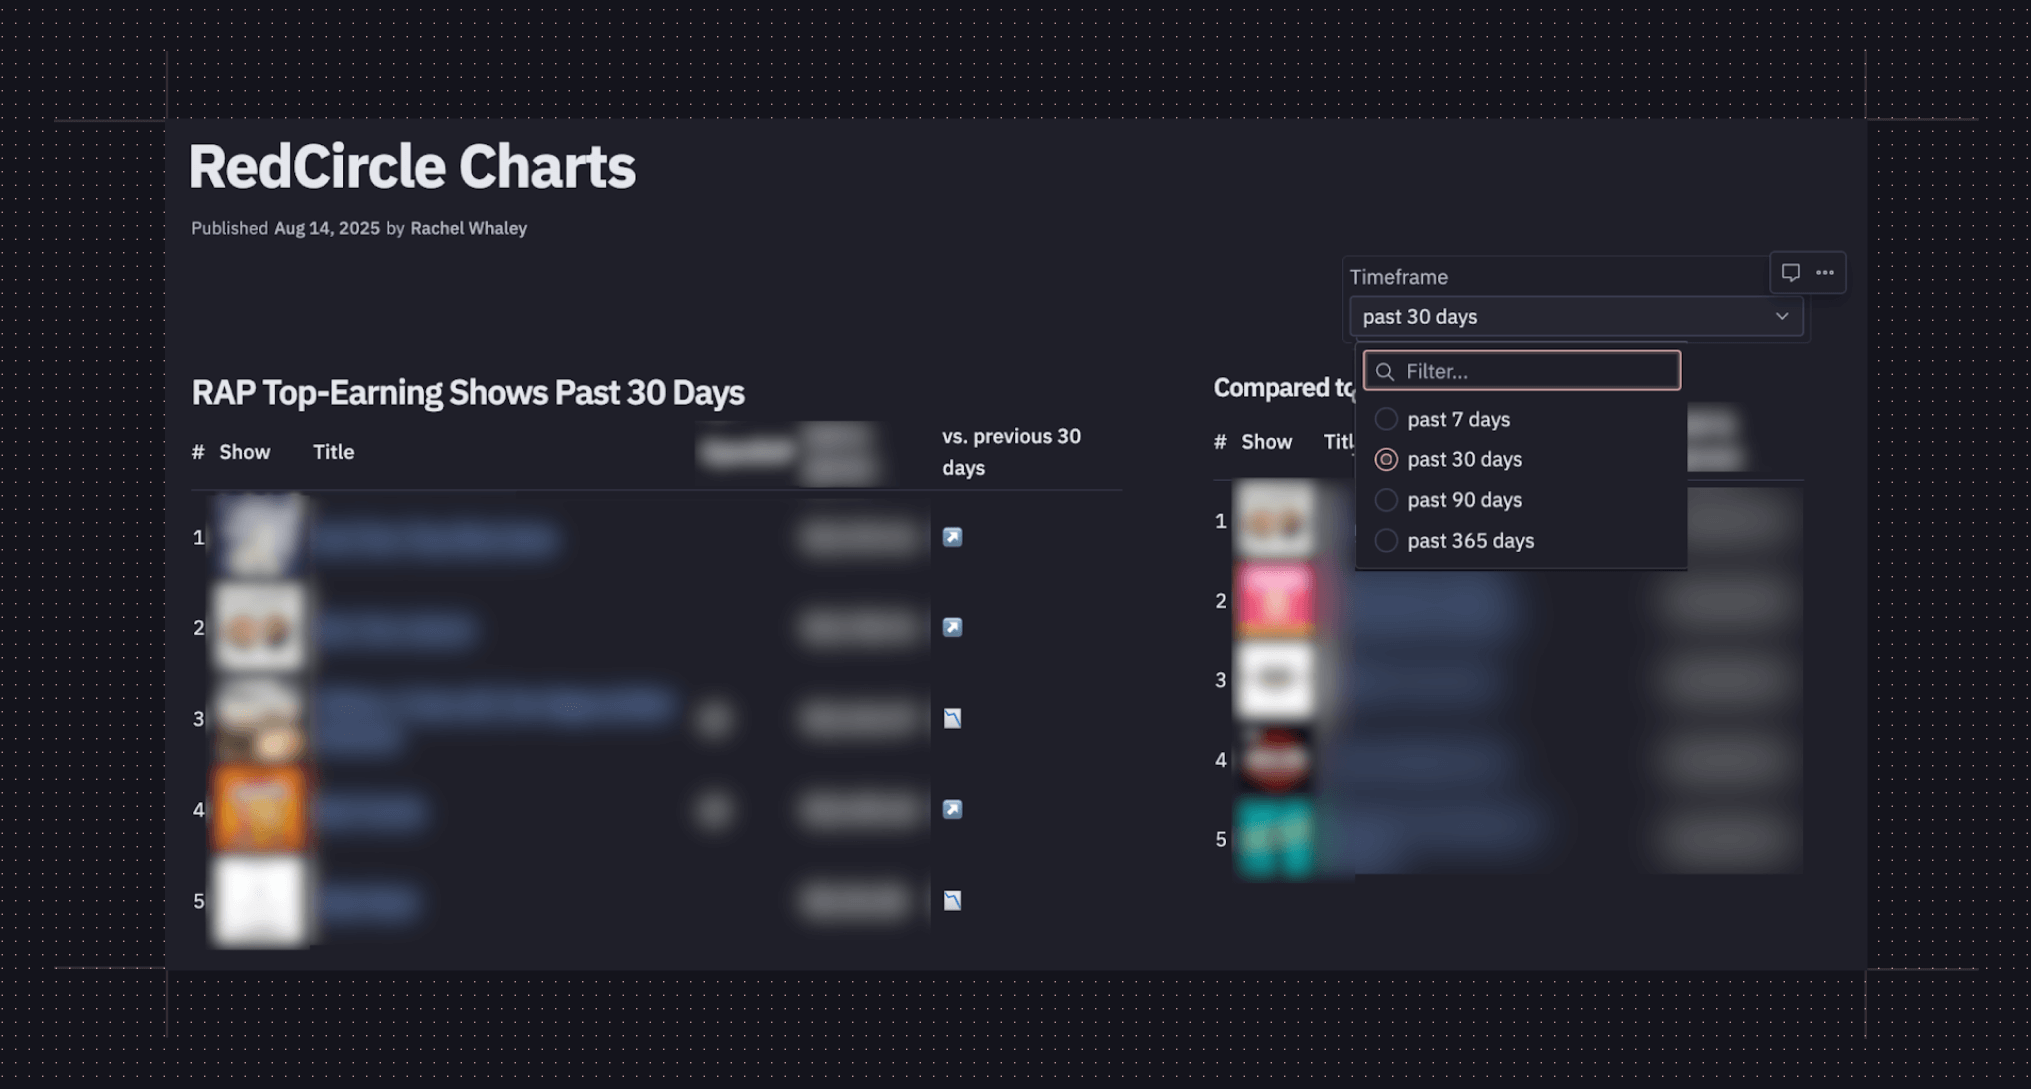
To help break through dashboard fatigue, I built a “Top Charts” style data app in Hex that highlights our leading shows and advertisers. Instead of quantitative graphs, the app displays podcast artwork, advertiser logos, and emojis alongside the data to make trends clear and straightforward. It dynamically updates, links directly to our internal tools, and has become a go-to resource for sales and new hires.
Without Hex, building something this visual and interactive would have required precious engineering time, but I was able to spin it up myself by combining SQL, Python, and Markdown cells.
Looking for more inspiration on what you can build inside of Hex? Check out our template library.