Feature Success Interactive Dashboard

hex-avatar

Jo Engreitz

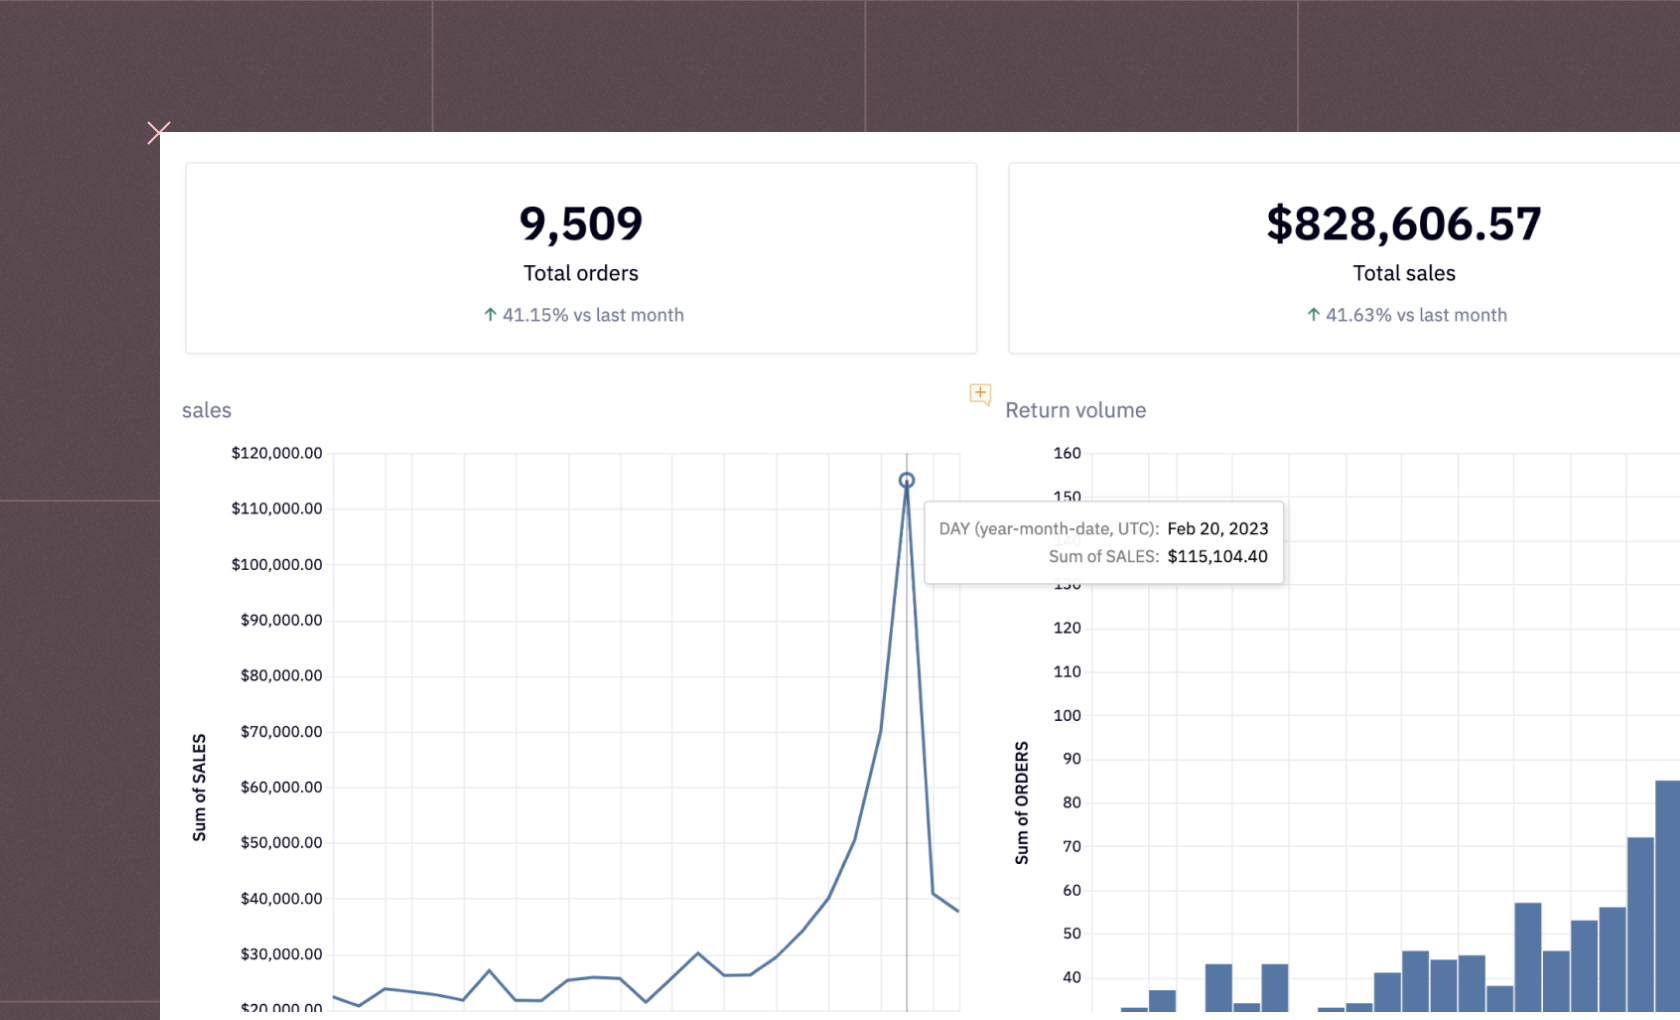
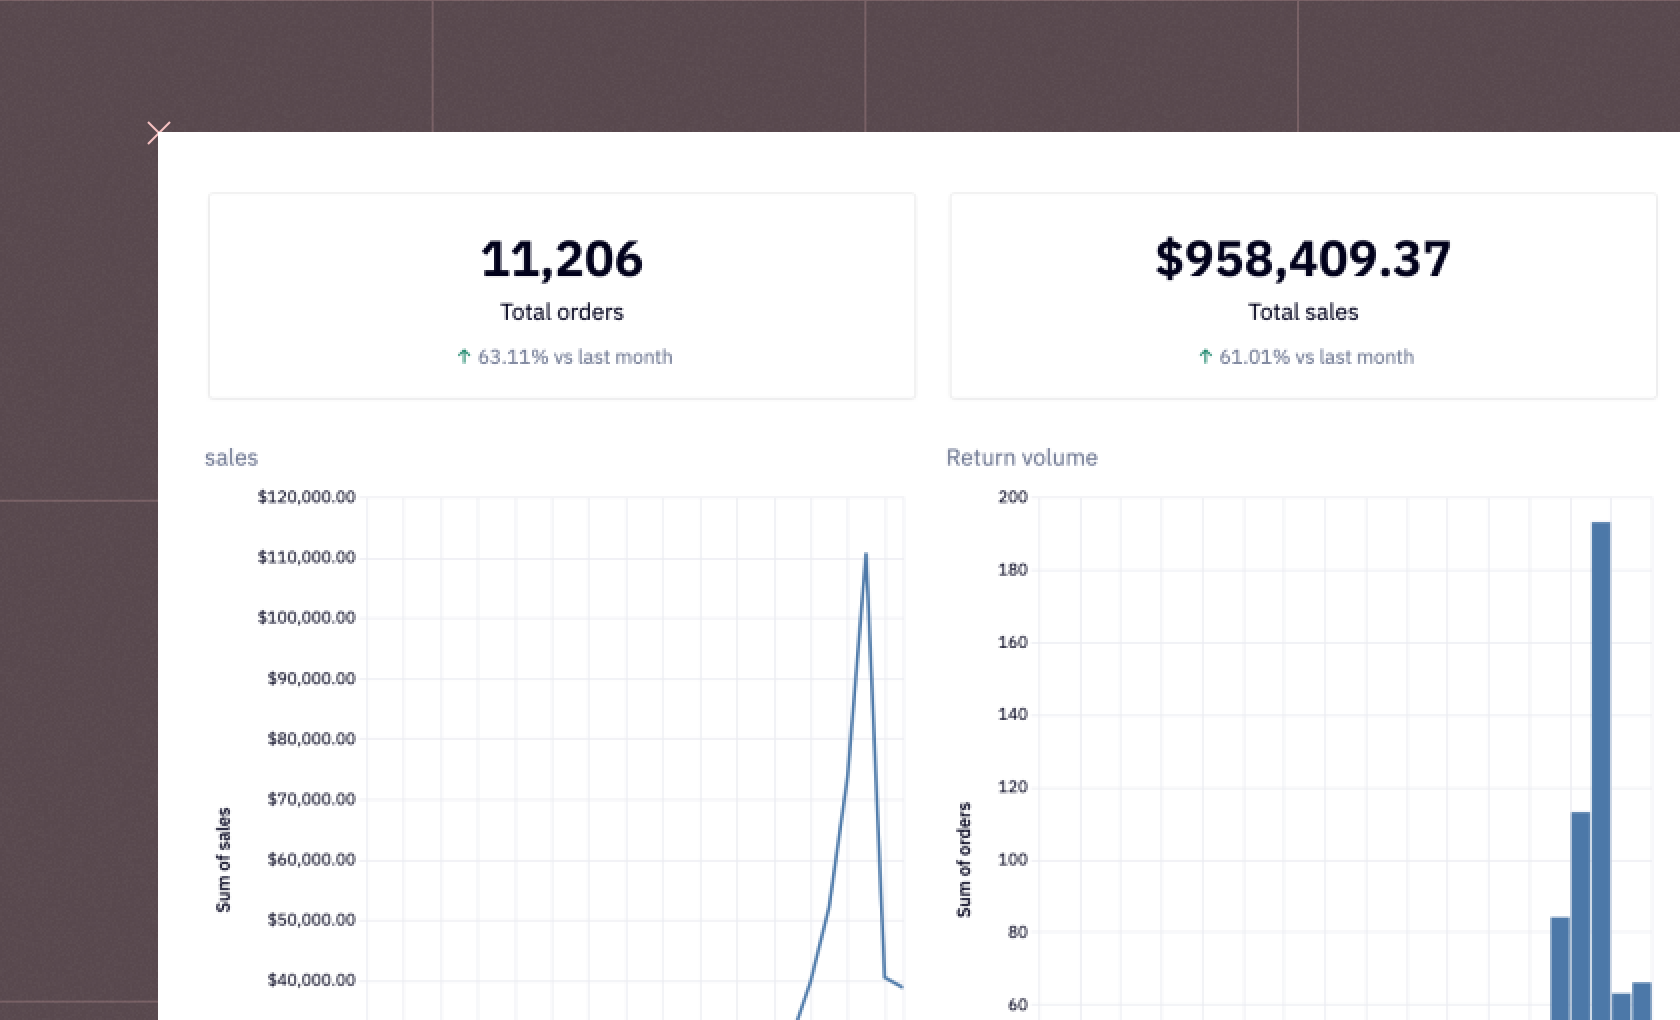
Build an interactive dashboard to measure feature success using Hex, in minutes. Track key metrics to measure your new features using parameterized SQLโ€” and then create a...

Read more chevron-down
playWatch demo(15 min)

Explore a live demo

What you can build (app)
How it's built (logic)
Full screen

See what else Hex can do

Discover how other data scientists and analysts use Hex for everything from dashboards to deep dives.

BLOG
feature-success-hero

The case for warehouse-based product analytics

Jo Engreitz ยท August 24, 2023

Learn how doing product analytics on top of the warehouse allows for deeper insight into activation, retention, and churn.

TEMPLATE
metrics dash cover

Company Metrics Dashboard

Izzy Miller

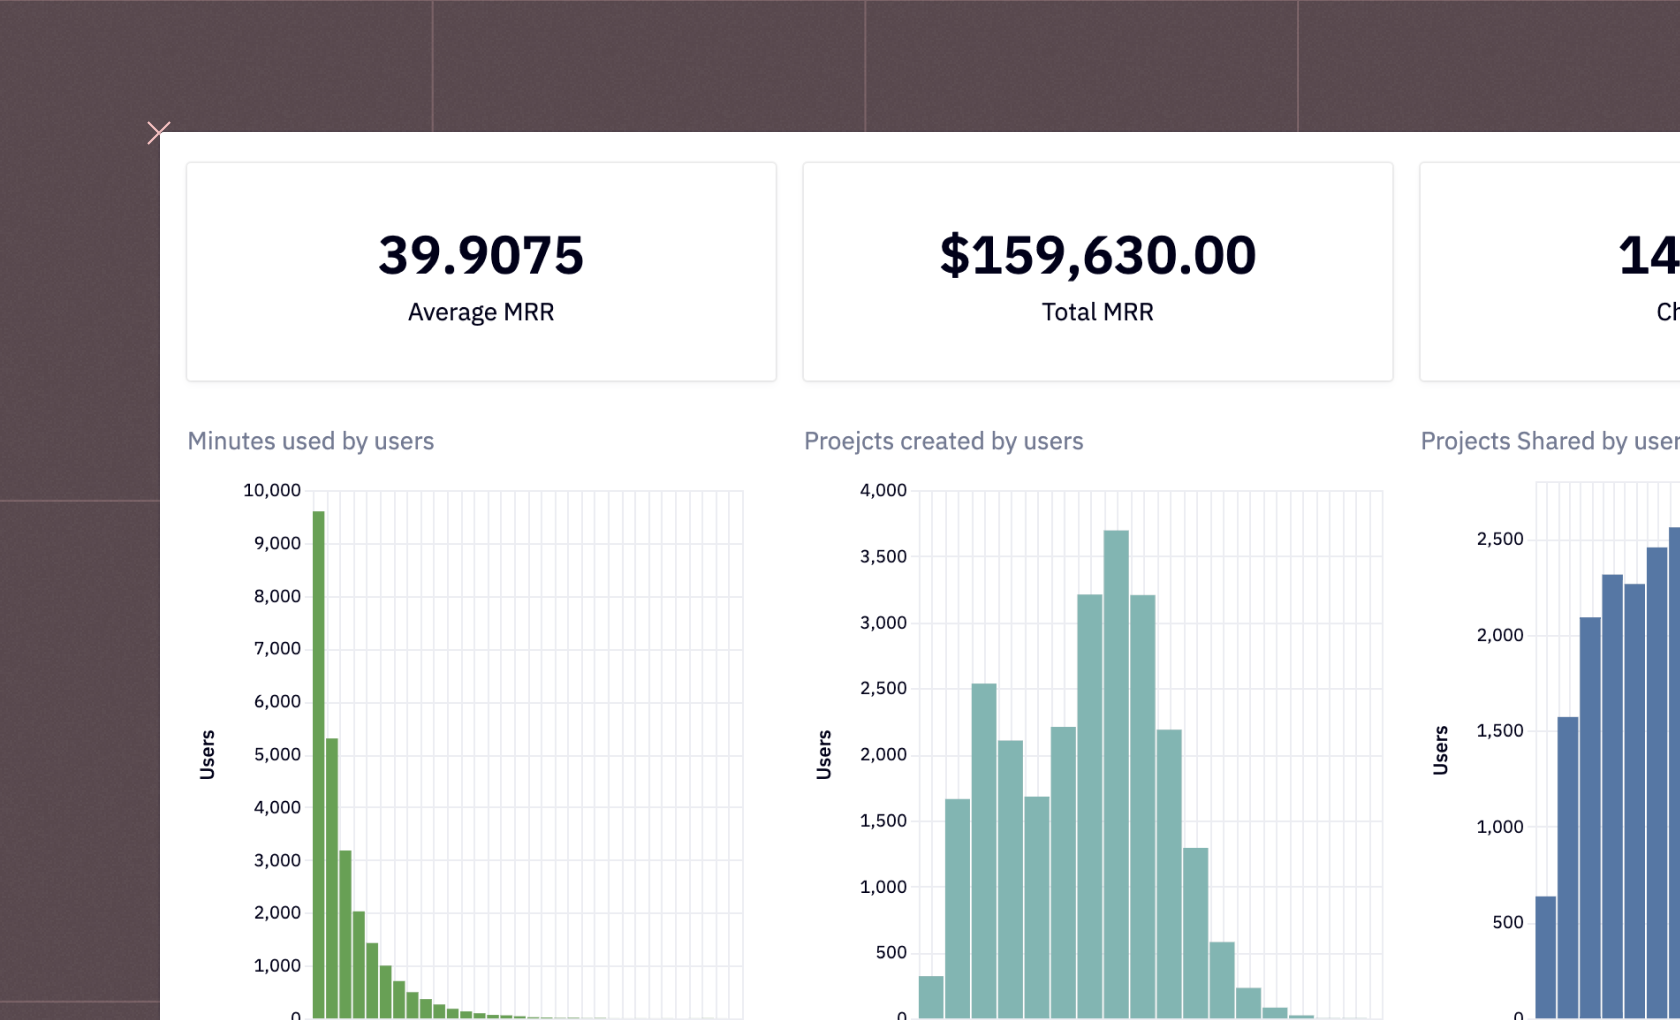
Don't limit yourself to traditional, old-fashioned BI. Hex lets you turn even the most flexible and complex analyses into beautiful dashboards.

TEMPLATE
Churn

Customer Churn Dashboard

Izzy Miller

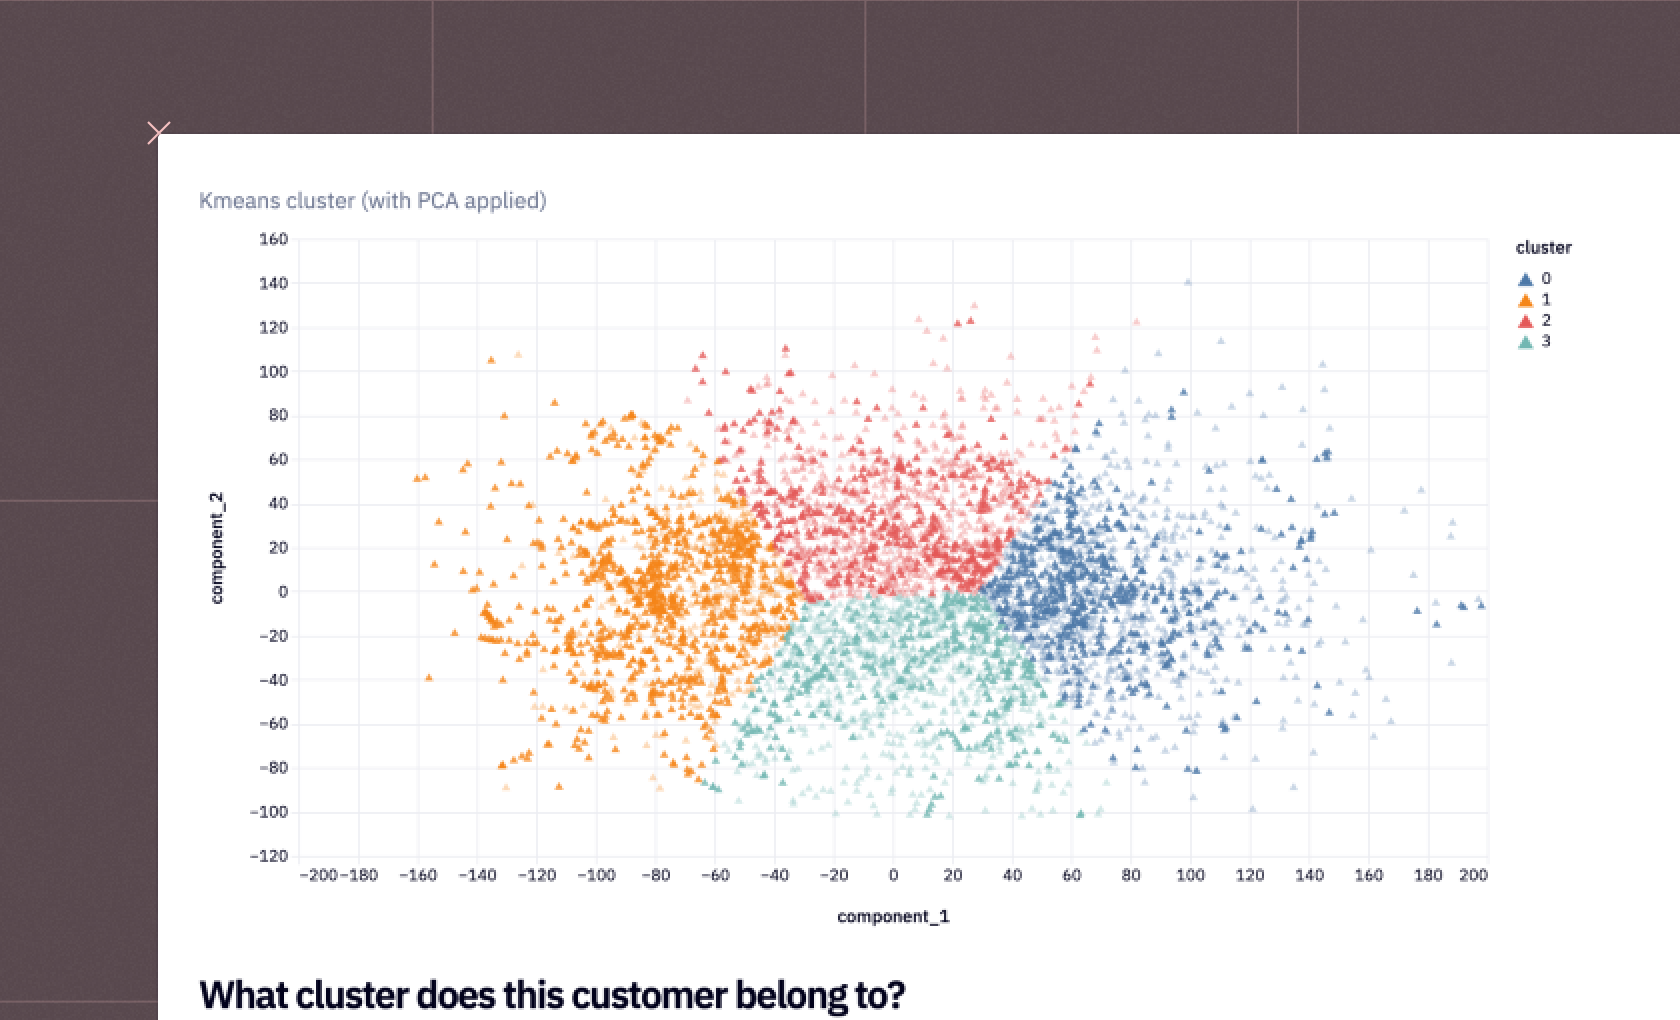
Reduce customer churn with predictive insights

TEMPLATE
customer health grid

Customer Health Dashboard

Empower stakeholders with a customer health dashboard

TEMPLATE
Customer LTV grid image

Customer lifetime value Dashboard

Izzy Miller

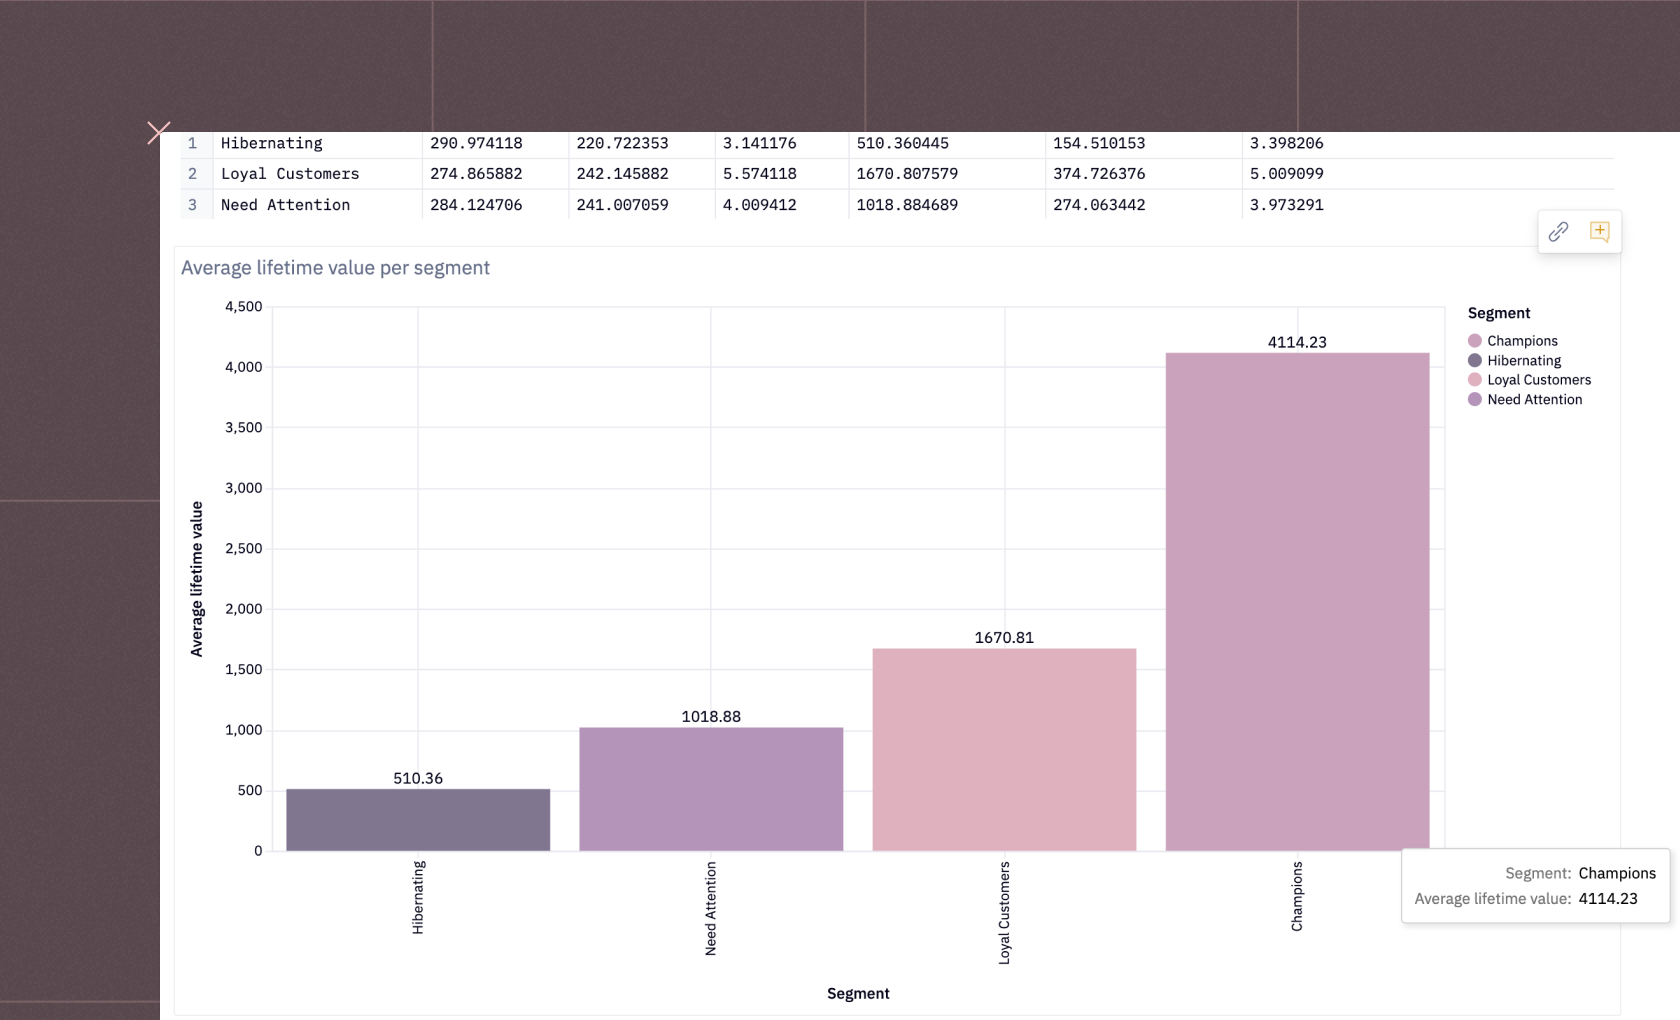
Improve customer retention and profitability with detailed LTV analysis.

TEMPLATE
SQL dashboards grid image

SQL Powered Dashboards

Build flexible BI dashboards out of SQL queries

Ready to get started?

You can use Hex in two ways: our centrally-hosted Hex Cloud stack, or a private single-tenant VPC.

Community

Free to explore data and showcase your work.

Get started

Professional

For practitioners or small teams accelerating data workflows.

Get started

Team

For teams scaling data collaboration and governance.

Try 14 days free

Enterprise

Advanced security, support and control for organizations.

Contact us