


At Hex, we have a unique purview and privilege, getting to work with thousands of data leaders, practitioners, and teams. We hear a lot about what's working – and what's not – in their data stacks. And among the litany of complaints, one stands alone as not only universal, but getting worse: the fragmentation of data workflows.
As data people, this has become such a part of our lives that we've grown used to it. Who among us hasn't spent hours shuffling CSVs around, or copy-pasting code between tabs? One jumps between separate tools for doing quick queries, operational reporting, data apps, forecasting, model development, workflow automation, and self-serve analysis, or whether you're using SQL, Python, no-code, and AI. Work winds up scattered around, and discovering or re-running an analysis requires deep forensics. Where's that big analysis from last year? No one knows (and it's probably spread across a query, spreadsheet, notebook, and screenshot).
This creates an analytics Tower of Babel — everyone is speaking different languages, in different tools, making it difficult to communicate and work together.
But maybe we're not that different after all?
But no matter what language is being used, the rectangles of data we work with and the things we do to them are fundamentally pretty similar:
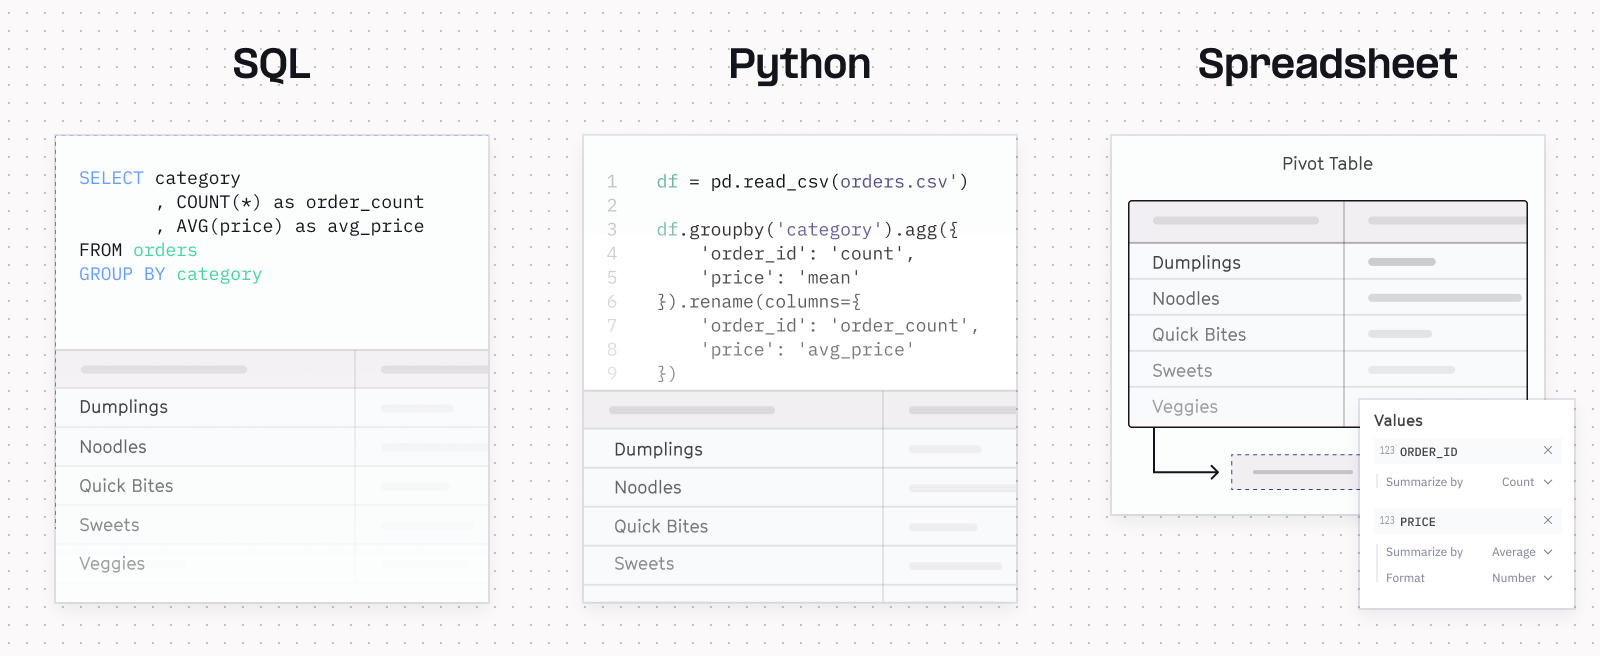
The distinctions between languages can actually be pretty flimsy! The reality is that analytics languages (SQL, Python, R, etc.) and interfaces (spreadsheets, AI, chart builders) are just different modalities of working with data. Sometimes one particular modality is the obvious choice for a task. Often though, they’re equivalent and valid ways to accomplish similar tasks, chosen mostly by preference, knowledge, or tools at hand.
But today’s analytics tools are almost all mono-modal: they primarily support just one of those ways to work with data. Today, SQL runners let you write SQL. Notebooks are for Python. BI tools and spreadsheets support visual exploration. There are even dedicated AI analytics apps that let users upload a csv and ask for insights with natural language!
The frustration this causes isn’t due to a language barrier ("ugh, I have to query data, I hate SQL”) it’s due to lack of support for multi-modal workflows (“ugh, I have to query data, I hate having to switch tools, log in, remember how to use this, download a csv, and then import it into this notebook” – and so on). Current tooling forces the Python people to live in a whole different tool from the SQL people and the Spreadsheet people.
Toward a multi-modal future for data work
We believe (and have built our software around the idea!) that analytics should be multi-modal. It shouldn’t matter what language you prefer to work in: they should all work equally well – and all work together – in one place.
A growth marketing expert who’s wicked at spreadsheets should still be able to pull their own data from the warehouse and explore it visually. But when they discover something interesting, it should feel natural to pull a data scientist into that project to dive deeper using code. Users should be able to work across these modalities, in one system, and all the resulting artifacts and outputs should be able to live together.
Now, you might recognize the term "multi-modal", because it's become a bit of a buzzword in AI, connoting models that can work across text, images, video, or audio, combining these modalities in one workflow. For example, a model might take in a photo of a cake, generate a textual recipe of how to make it, and then create a new image based on a suggested variant.
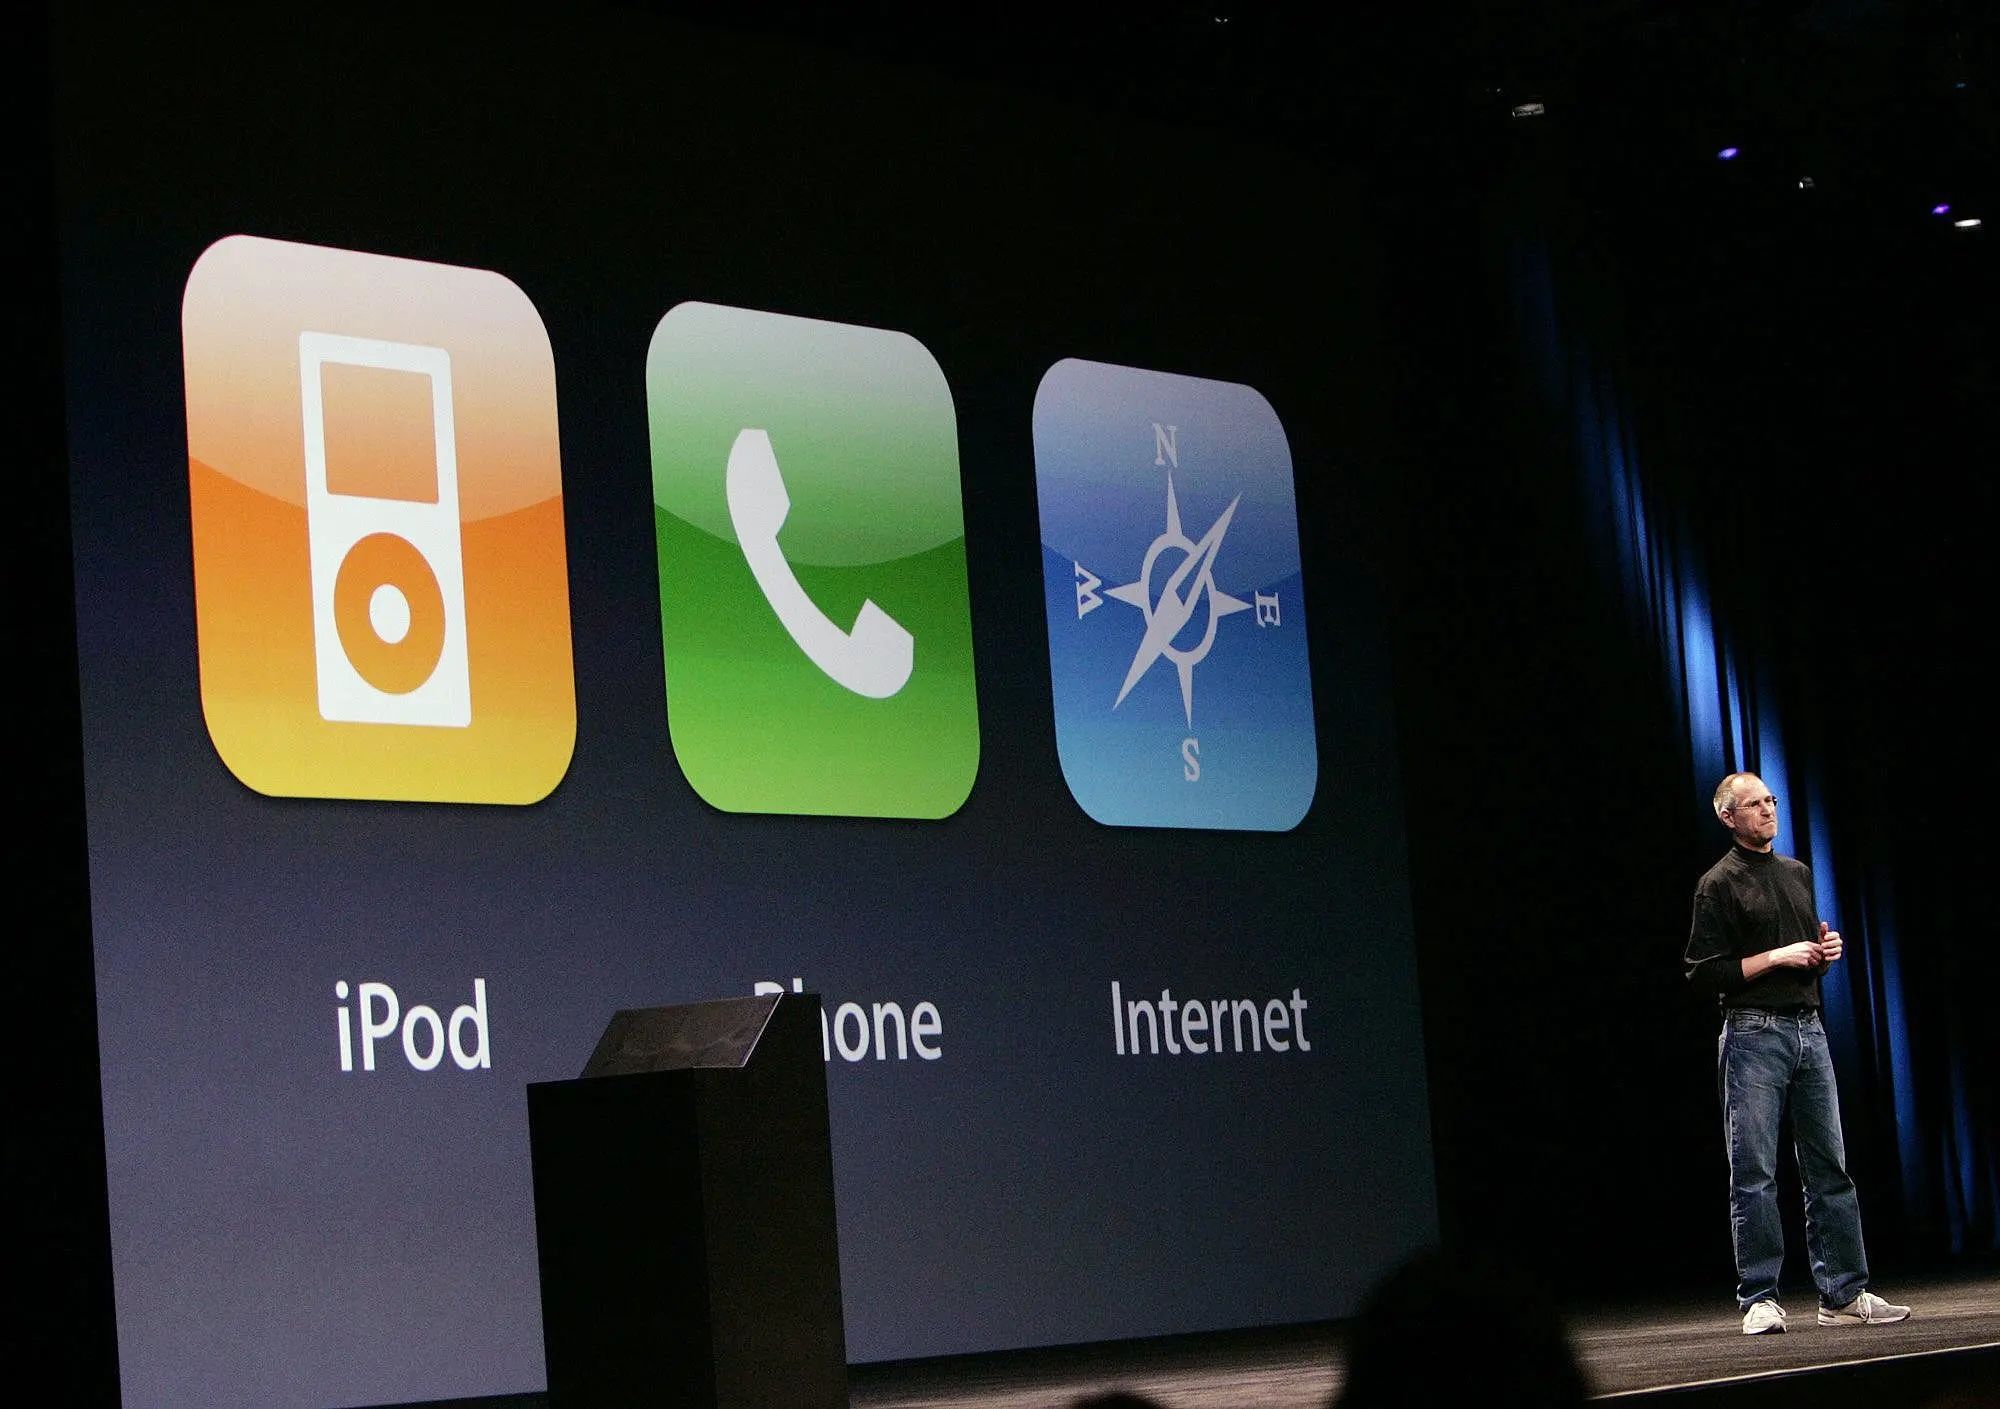
But this property of multi-modality isn't exclusive to AI exotica – we already take multi-modality for granted elsewhere in our lives. We can add images and text to slide decks. We can post gifs in Slack. And the most ubiquitous technology in our lives – smartphones – are the ultimate multi-modal tool; the iPhone was famously introduced as “an iPod, a phone, an internet communicator… these are NOT three separate devices, this is one device!”
The next generation of data tools will look more like this: multi-modal platforms that roll all these ways of working into one delightful experience that works for entire teams.
Multi-modality in Hex
And – of course – Hex is an articulation of this vision, allowing users to combine the modalities of code, no-code, and AI in one integrated workflow.
This is accomplished via our "cells" system: notebooks and apps are built of a common set of building blocks, that can accept and return data, and execute in a reactive graph. These cells can be anything – we already have charts, maps, SQL, filters, pivots, Python, write-back cells, and more – and all operate on top of a unified layer of data, governance, and billing.
Users can take these cells and compose them to build, well, whatever they want! Combine a SQL query and some charts to build a basic report. Or use Python to tap an API, and a writeback cell to push the results into a database. Or, you can ask our AI tools, like the Notebook Agent or Threads to help, and let them construct a notebook using these modalities. The possibilities are endless.
In fact, the best part of our jobs is seeing all the awesome things people build in Hex, and we're excited to share this with many more to come – no matter which modality they choose.
See how you can answer one question with a multi-modal workflow in Hex.