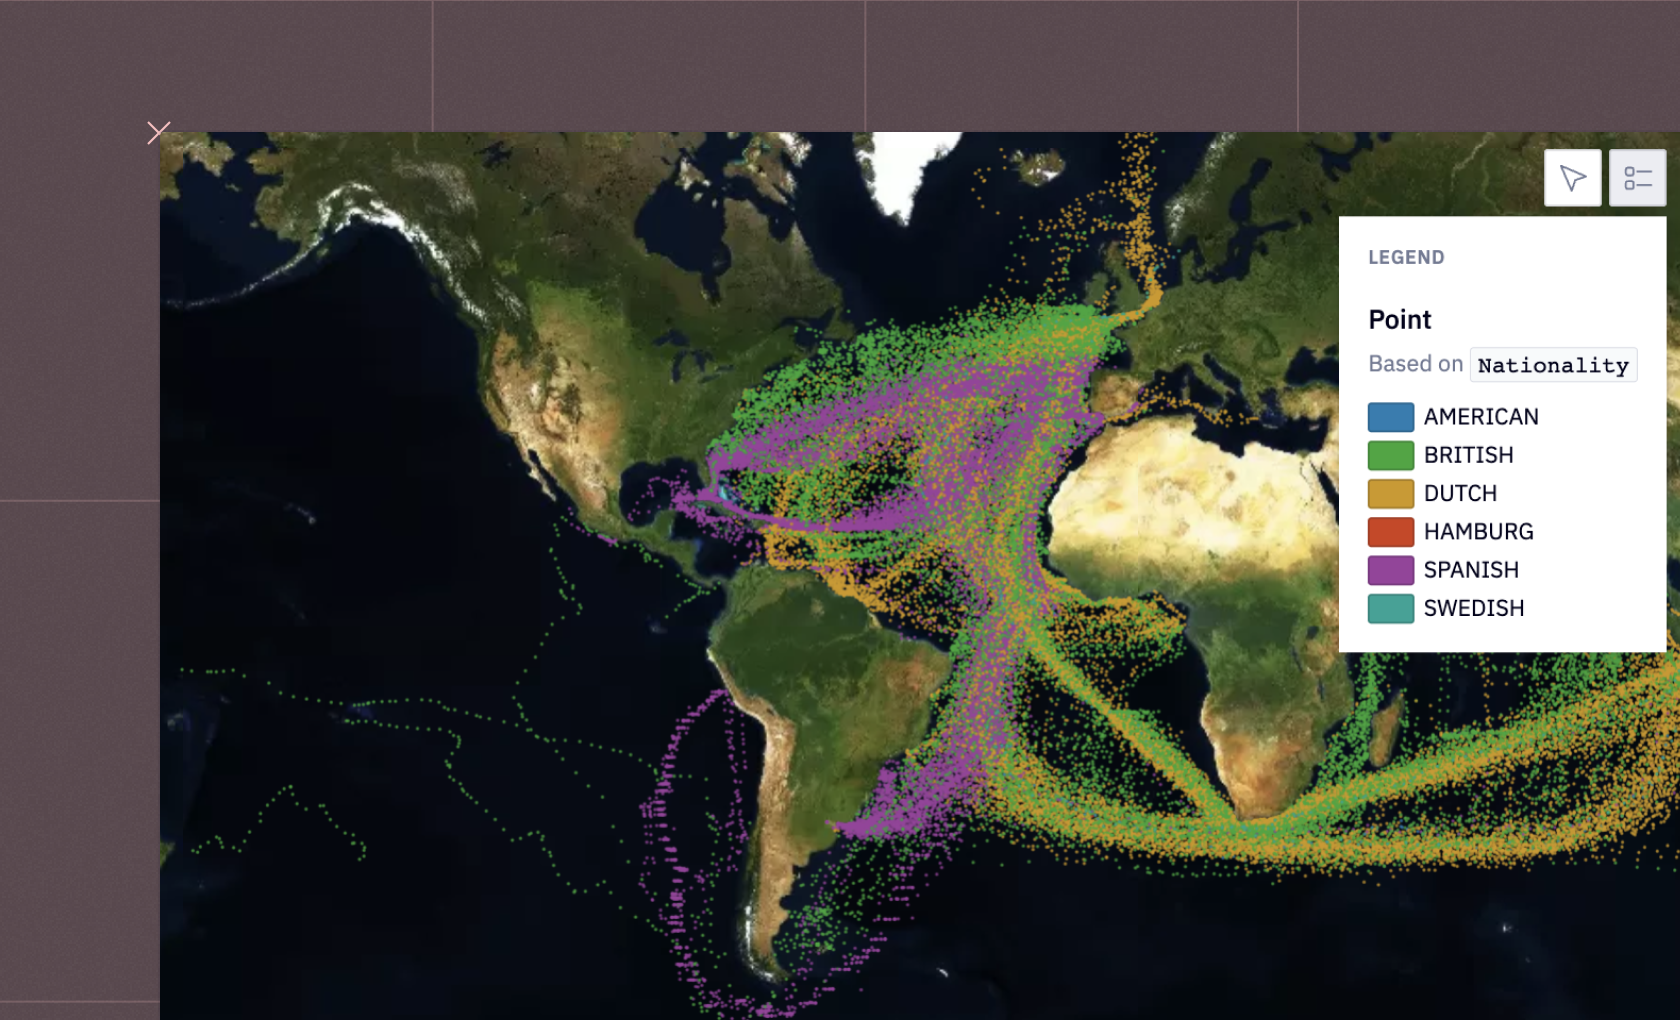
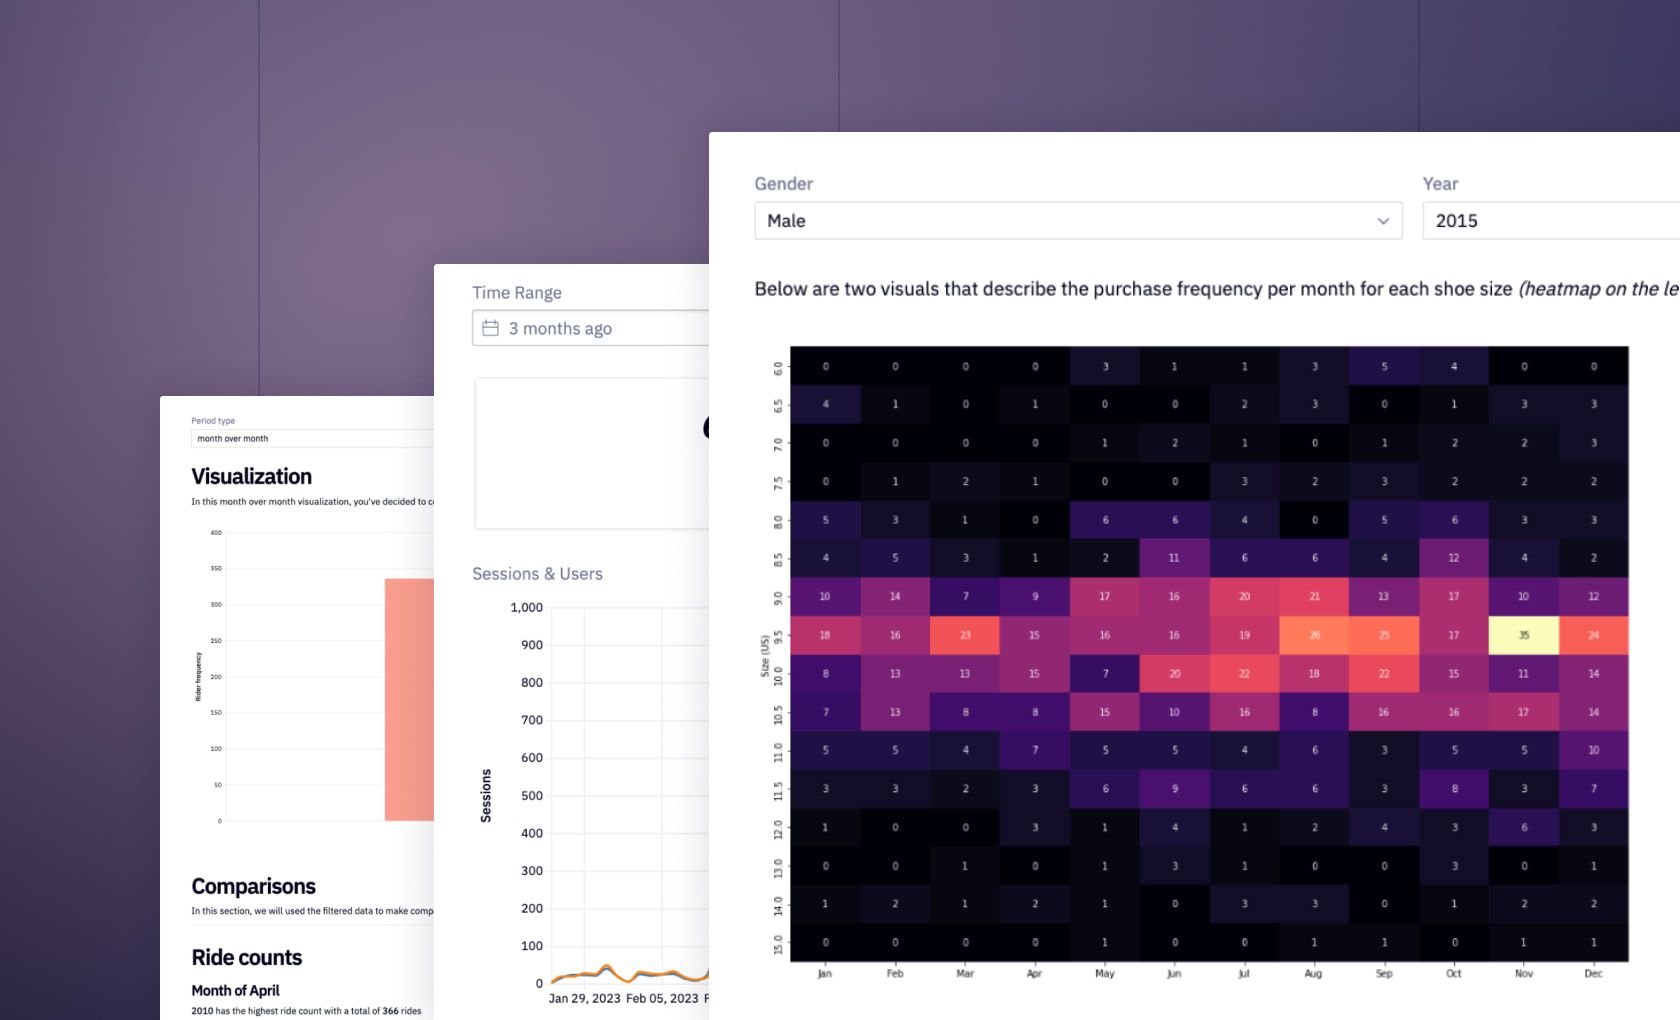
Hex is an incredibly flexible platform for GIS and geospatial data analysis, giving you all the power of Python's geospatial ecosystem right alongside a direct connection...

Read more chevron-down
playWatch demo(5 min)

Explore a live demo

What you can build (app)
How it's built (logic)
Explore this app

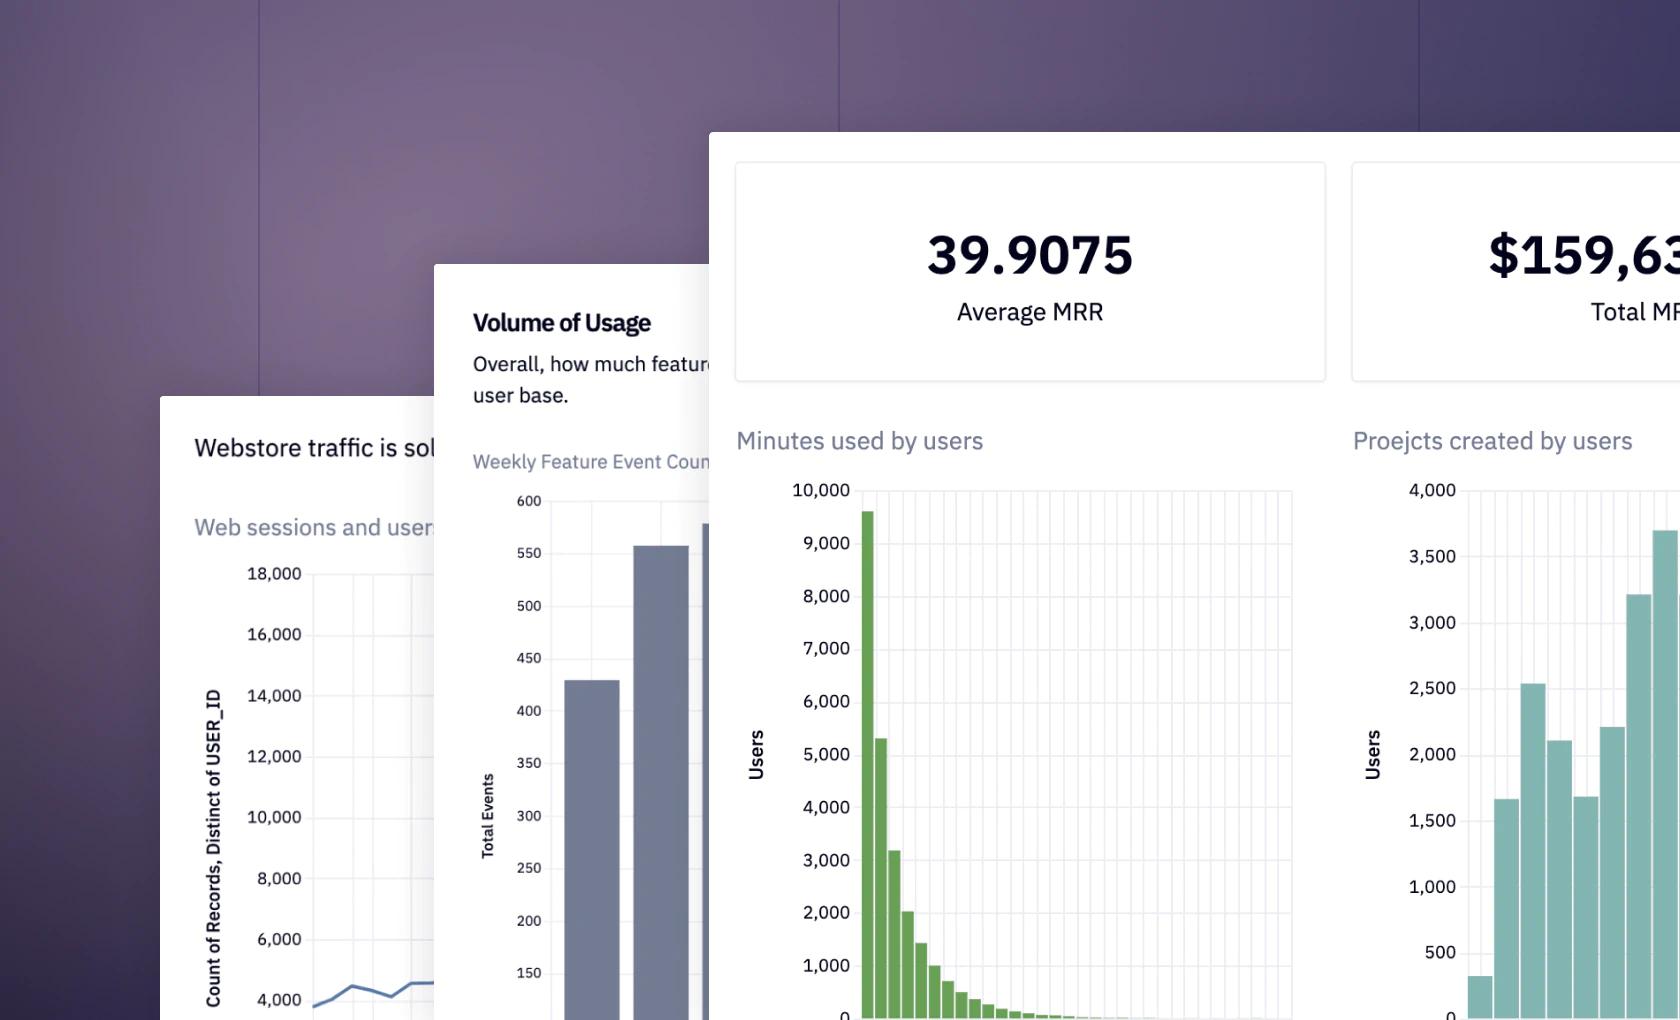
See what else Hex can do

Discover how other data scientists and analysts use Hex for everything from dashboards to deep dives.

TEMPLATE
Python mapping libraries

Python mapping libraries

Izzy Miller

Access Python's powerful mapping ecosystem right alongside SQL and native geospatial tools

TEMPLATE
Python Data Visualization

Python Data Visualization

Izzy Miller

Leverage Hex to transition from SQL data warehouse insights to dynamic visual storytelling using Python's top visualization libraries.

BLOG
Building Better Display Tables

Building Better Display Tables

Haroon Choudery ยท November 9, 2021

A more beautiful and useful way to visualize dataframes.

BLOG
Introducing: an all-new, interactive visualization experience for Hex

Introducing: an all-new, interactive visualization experience for Hex

Claire Carroll ยท December 15, 2022

Point-and-click visual filtering, an all-new chart cell, custom color palettes, and more

USE CASES
Reporting

Reporting

Multiple contributors

USE CASES
KPI Dashboards

KPI Dashboards

Multiple contributors

Ready to get started?

You can use Hex in two ways: our centrally-hosted Hex Cloud stack, or a private single-tenant VPC.

Community

For hobbyists completing small projects and showcasing work.

Get started

Professional

For individuals accelerating data insights and solo workflows.

Get started

Team

For companies collaborating with data and automating manual work.

Try 14 days free

Enterprise

For organizations requiring advanced security, governance, and support.

Contact us