SQL Powered Dashboards

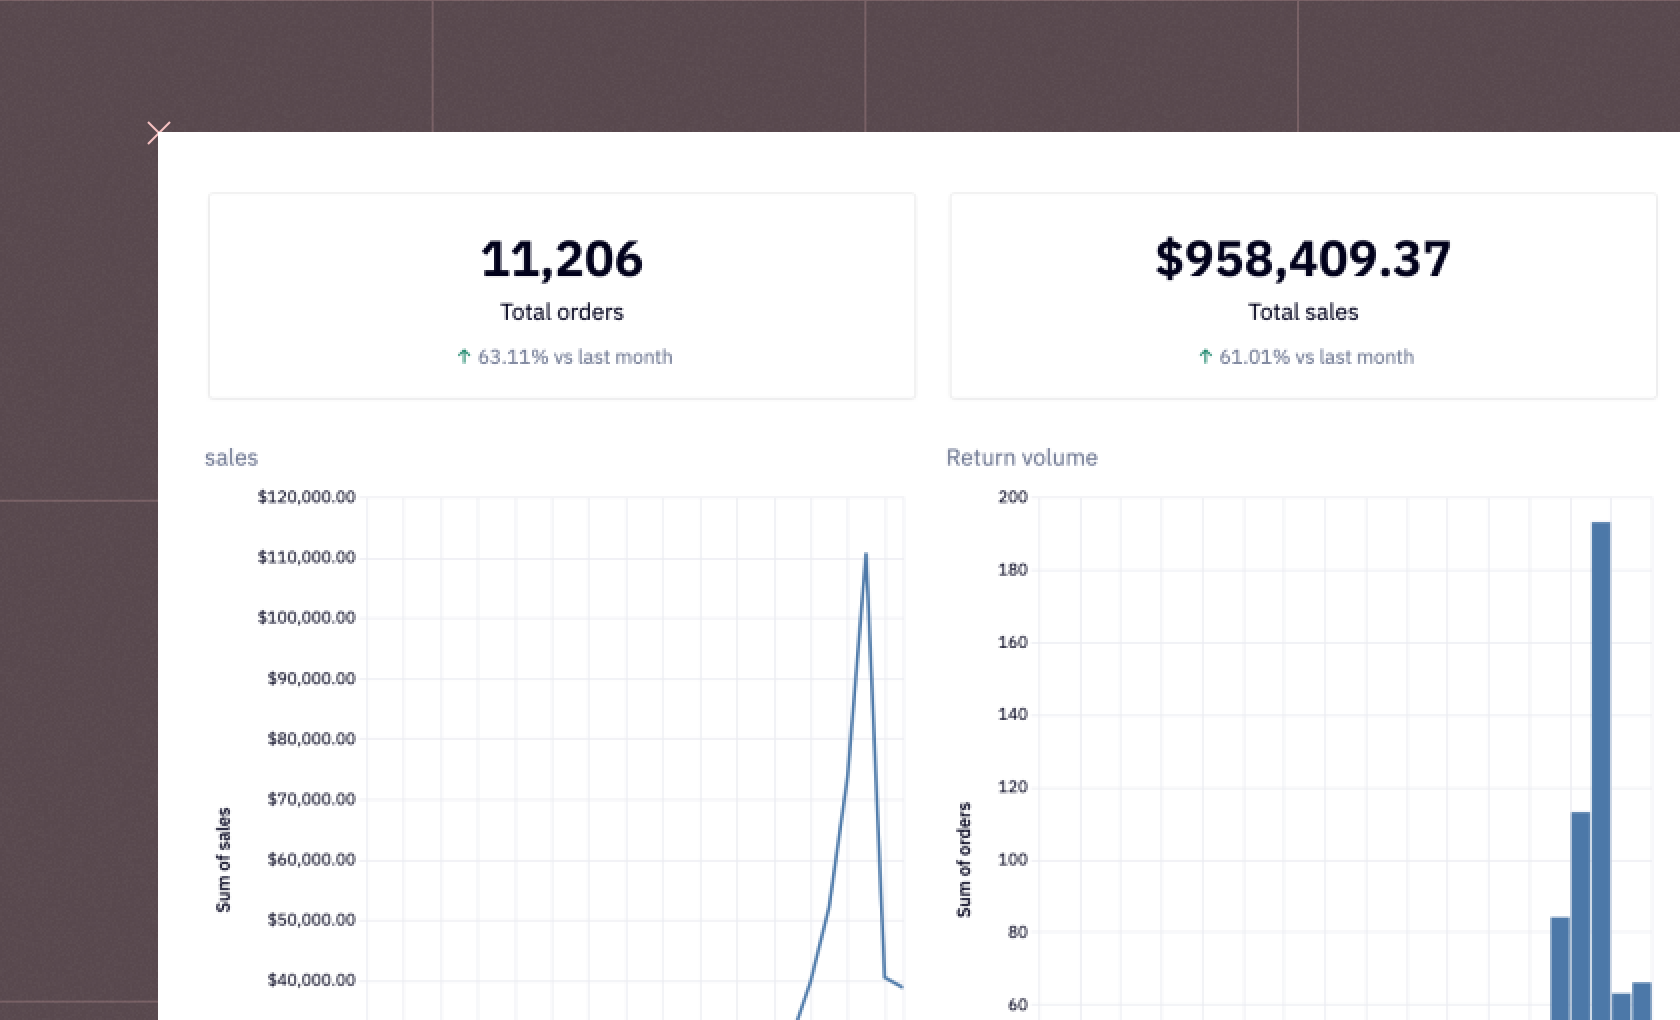
Hex makes it easy to turn SQL queries into beautiful production dashboards. With a more powerful SQL workspace than other BI tools, as well as a more flexible report builder, you can build any dashboard other tools canโ€” and more.

play
Watch demo(4 min)

Explore a live demo

What you can build (app)
How it's built (logic)
Full screen

See what else Hex can do

Discover how other data scientists and analysts use Hex for everything from dashboards to deep dives.

USE CASE
metrics dash cover

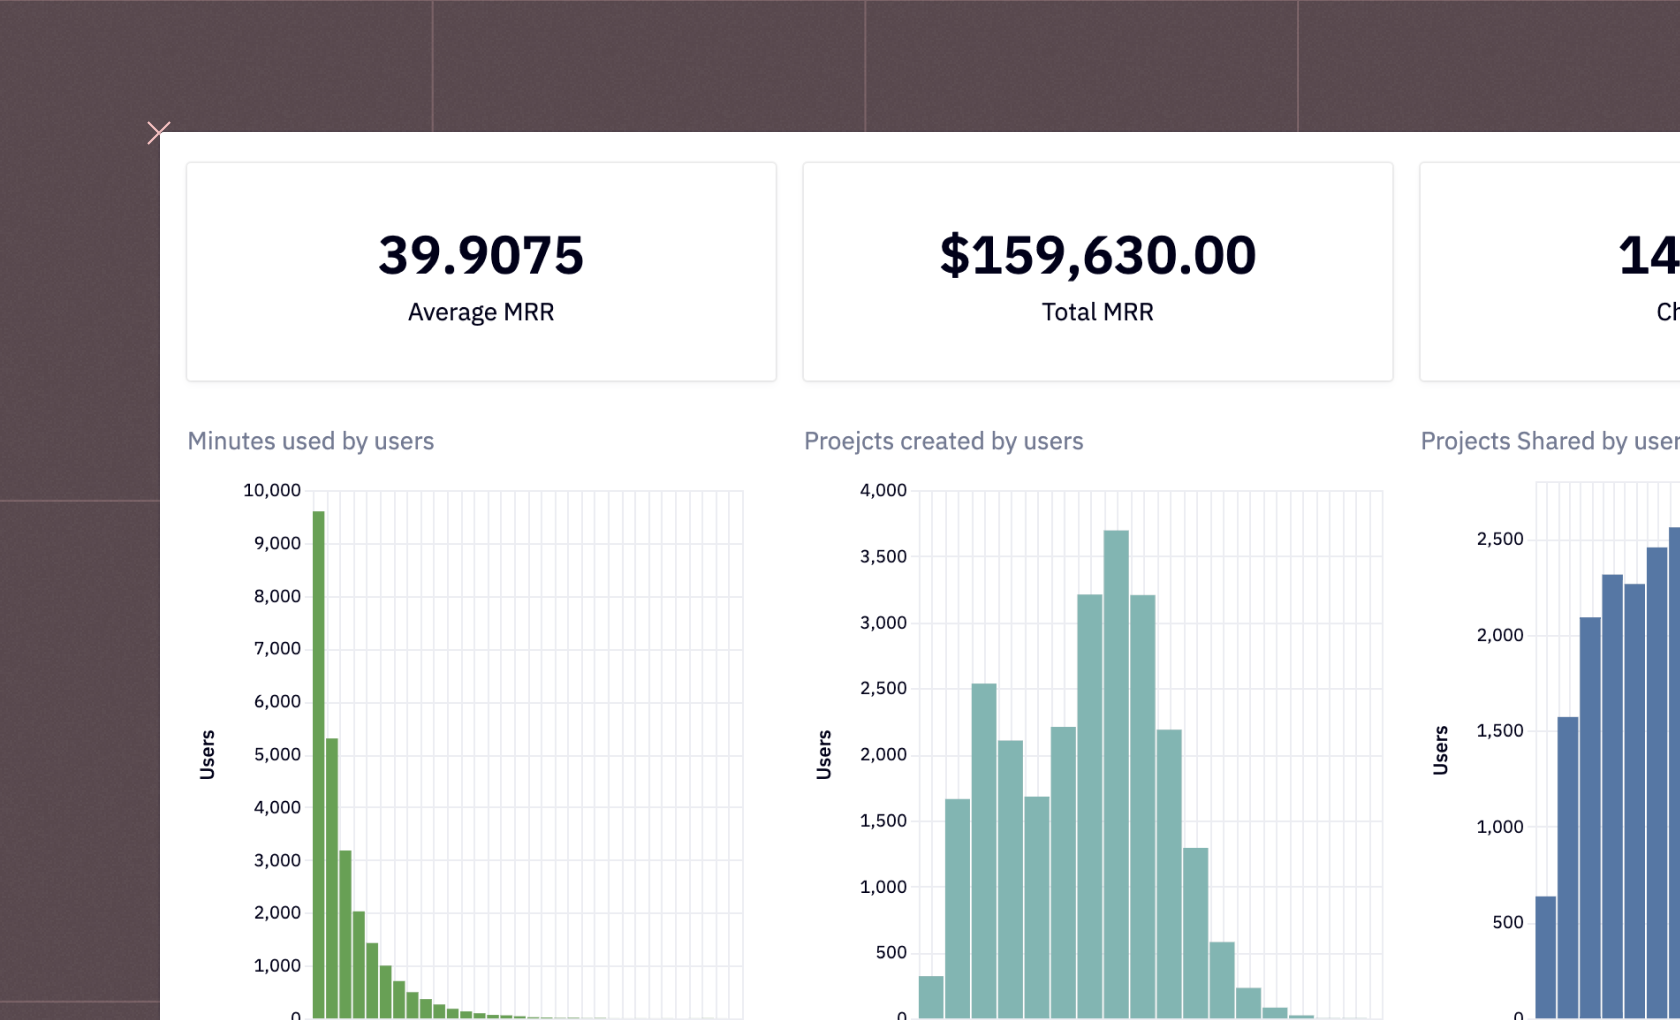
Company Metrics Dashboard

Izzy Miller

Don't limit yourself to traditional, old-fashioned BI. Hex lets you turn even the most flexible and complex analyses into beautiful dashboards.

USE CASE
Churn

Customer Churn Dashboard

Izzy Miller

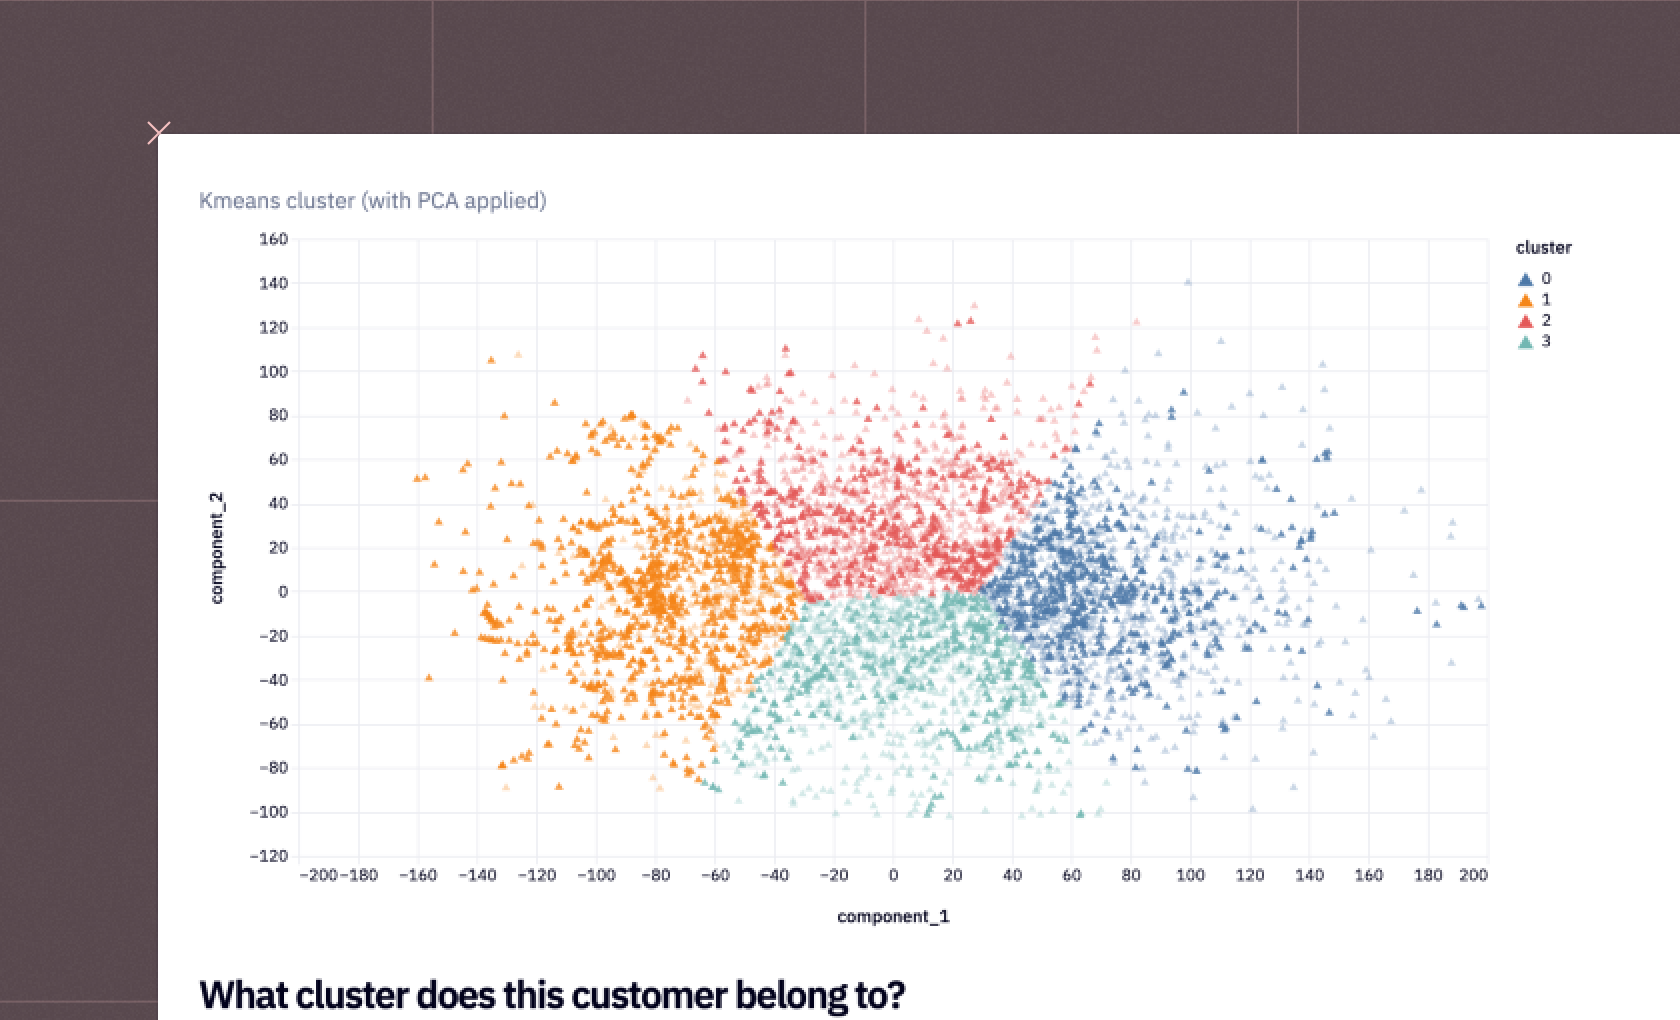
Reduce customer churn with predictive insights

USE CASE
customer health grid

Customer Health Dashboard

Empower stakeholders with a customer health dashboard

USE CASE
Customer LTV grid image

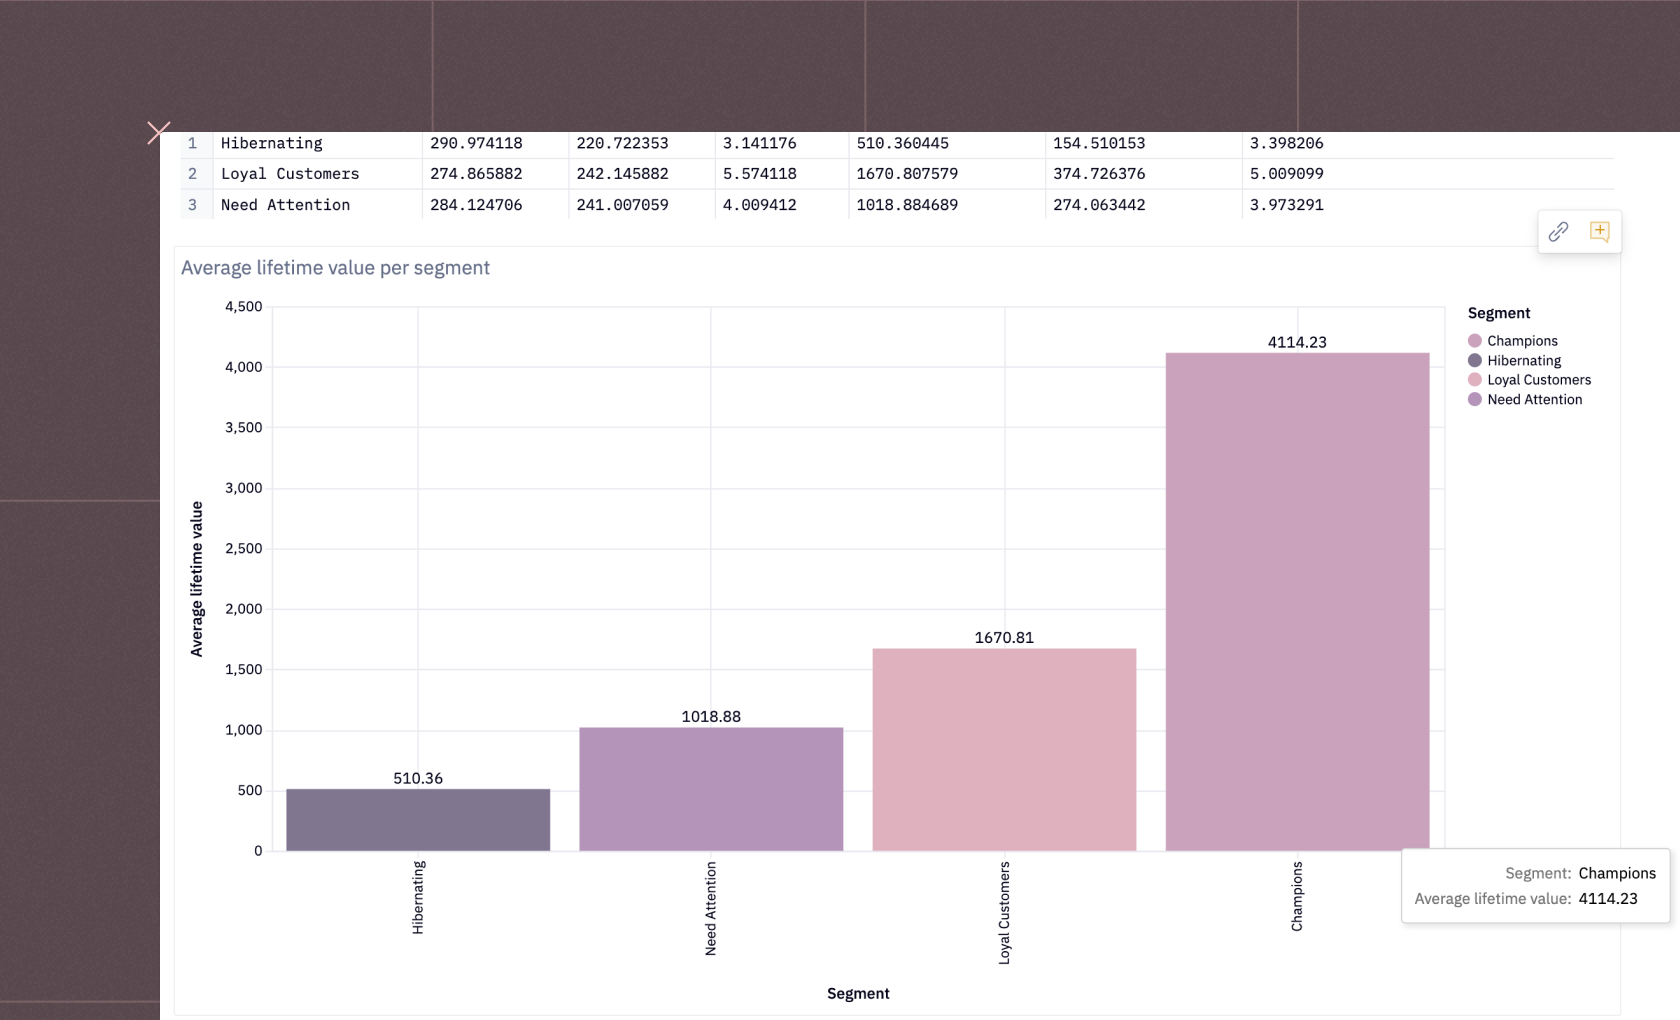
Customer lifetime value Dashboard

Izzy Miller

Improve customer retention and profitability with detailed LTV analysis.

USE CASE
SQL dashboard grid image

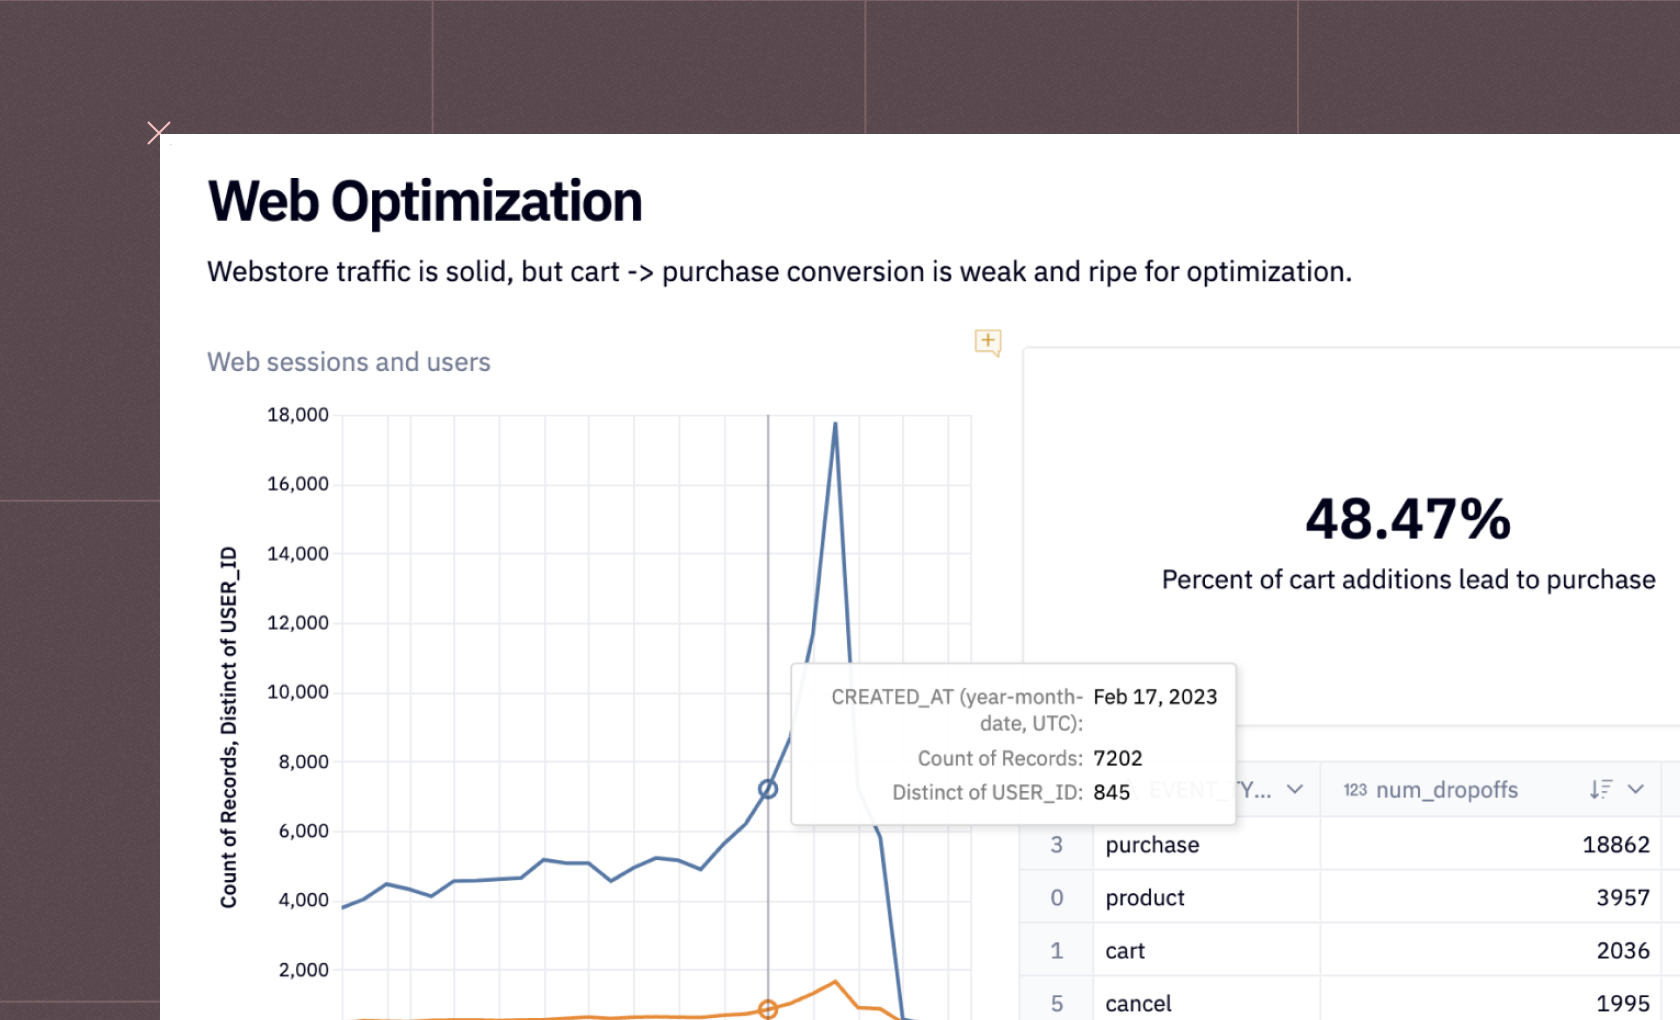
eCommerce Analytics

Build a flexible eCommerce analytics dashboard with Hex

USE CASE
Feature Usage

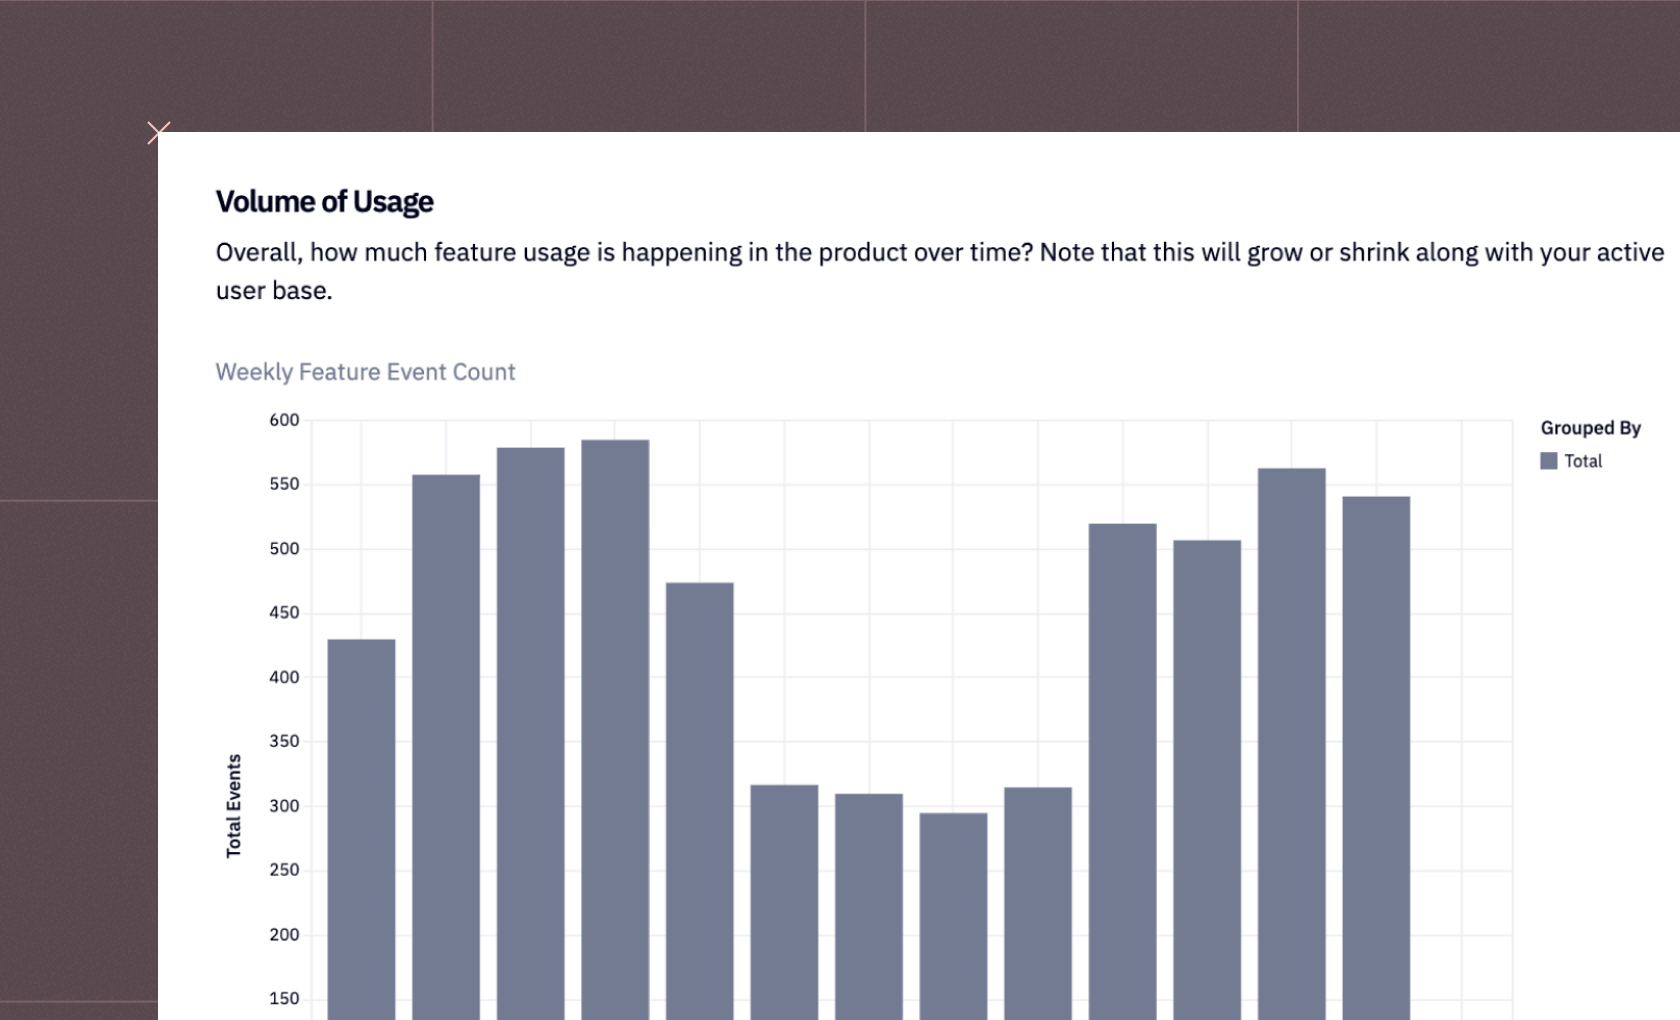
Feature Success

Jo Engreitz

Measure Feature adoption, retention and satisfaction with this interactive Hex app.

Ready to get started?

You can use Hex in two ways: our centrally-hosted Hex Cloud stack, or a private single-tenant VPC.
Community

Free to explore data and showcase your work.

Get started

Professional

For practitioners or small teams accelerating data workflows.

Get started

Team

For teams scaling data collaboration and governance.

Try 14 days free

Enterprise

Advanced security, support and control for organizations.

Contact us