
We recently shipped Hex’s visualization subagent: an autonomous AI agent that the main Hex agent recruits for all visualization-related tasks. Before the subagent, the main Hex agent handled visualization along with everything else and was often eager to move on with the overall analysis, leaving a trail of subpar charts in its wake.
A generalist agent juggling data joins and quick questions easily forgets that chart creation is fundamentally iterative. Even tediously so. The best-laid defaults rarely survive contact with real data. Inevitably, the platonic chart meets the bitter reality of long tails, outliers, and unnecessarily wordy categorical labels. Rework and patient finessing aren’t failure states of the charting process. They’re just part of the job.
This is the story of how we built an AI specialist to do that job. A subagent crafted in our own likeness - one that checks its work, refines it relentlessly, and owns visualization end to end.
Breaking the main agent
As the overall Hex agent grew more complex, it became harder and harder to reason about the visualization capabilities within it. We resorted to heavy-handed and repetitive prompting. "REQUIRED: Immediately after chart creation, you MUST call the style chart cell tool" appeared in the system prompt and multiple tool descriptions. We got a steady stream of internal feedback about the visualization tooling consuming way too many tokens. (To the token shamers out there, I say, "Hey, viz is complicated ok”)
Isolating our (chonky) visualization tooling into a dedicated subagent gave us a clean split. We moved 6 visualization-specific tools, accounting for ~50k tokens, from the main agent to the subagent and replaced them with a single ~1k delegation call. The main agent - freed from the contextual and token burden of visualization intricacies - could focus on the overall analytical task. The subagent, meanwhile, could finally take full ownership of visualization from end to end.
Handing off to a specialist
Moving the tools and guidance to the subagent was the easy part. Defining the orchestrator → subagent handoff was harder and remains an active area of experimentation. The shape of the delegation matters enormously. How much data exploration should the main agent do before handing off? And critically, how do we prompt the main agent to hand off the user's actual domain-specific task rather than over-prescribing a visual solution?
In early experiments, the main agent invoked the subagent with a single “task” parameter: "The visualization task to delegate to the sub-agent. Describe what you need - be specific and detailed." We found the main agent happily doing basically the whole job of the subagent - deciding the data, chart type, even stylistic decisions - and prescribing it all. Classic main agent energy.
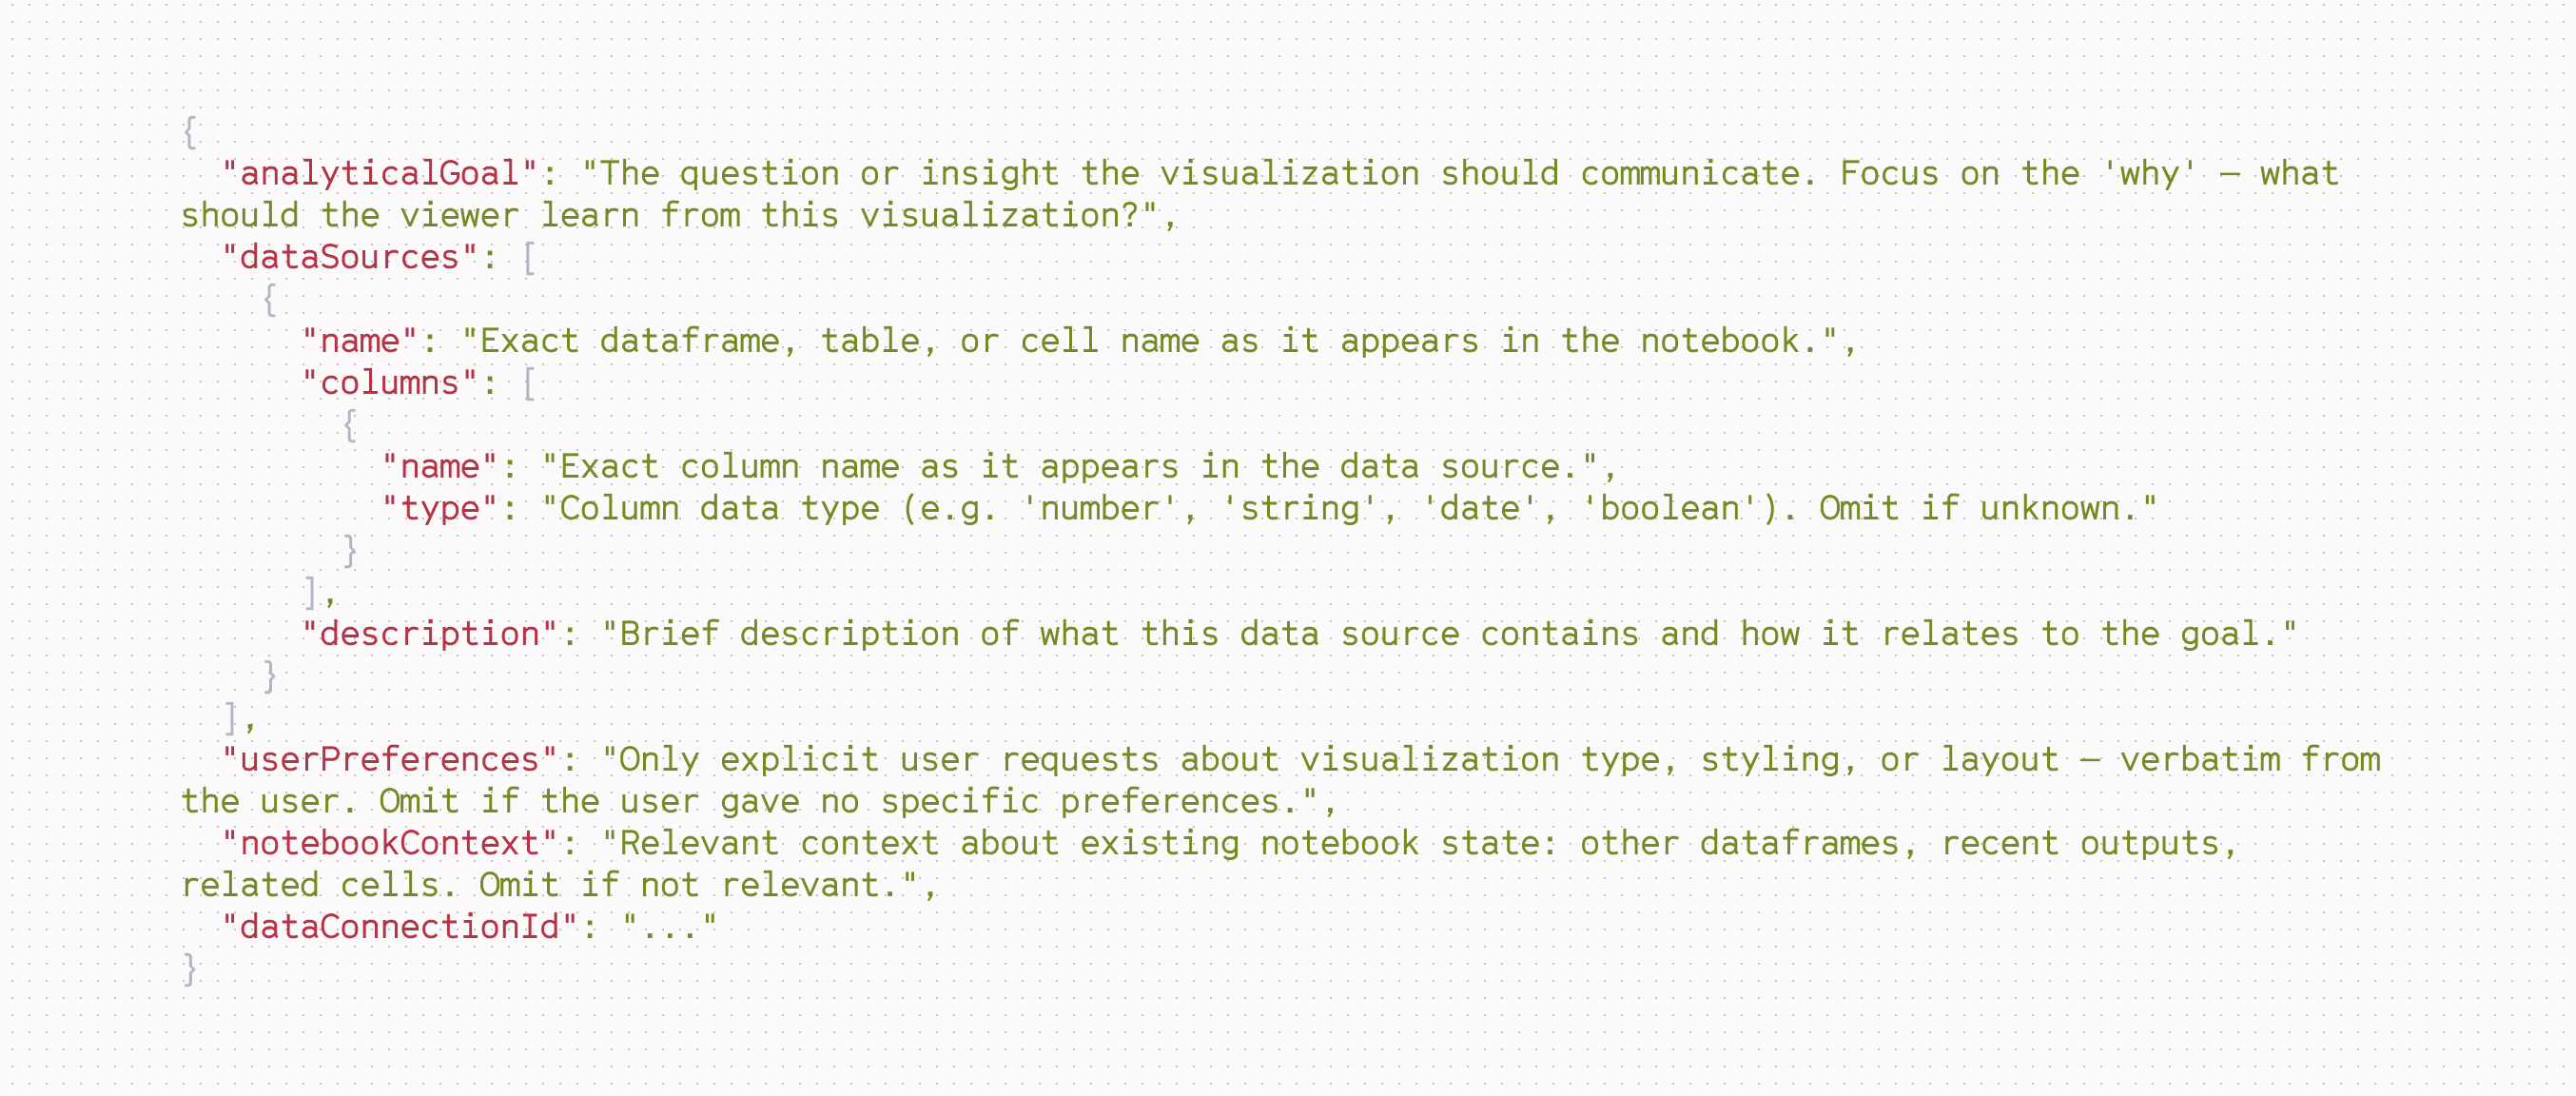
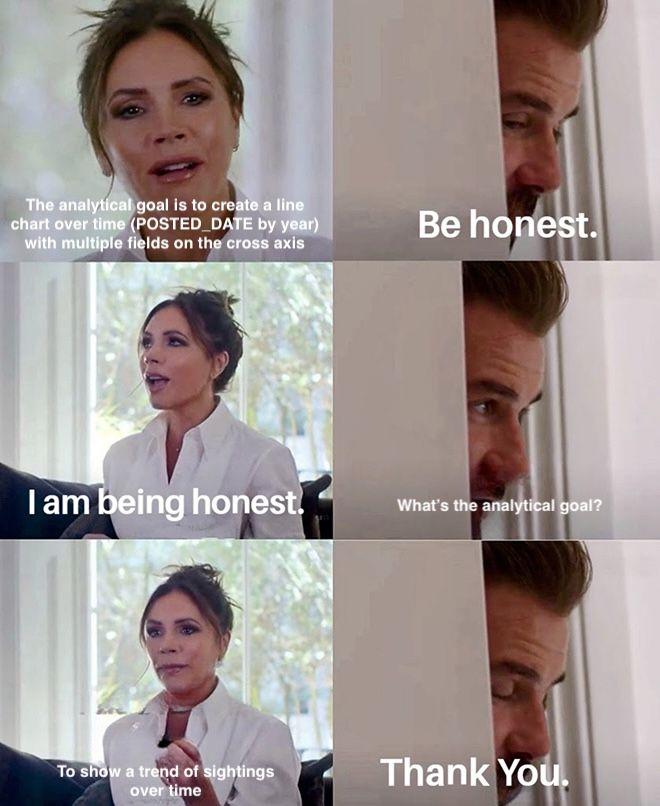
To mitigate this, we currently use a more structured delegation. Using Tamara Munzner's framing from Visualization Analysis and Design, we want the main agent to pass the what (via the dataSources parameter) and why (via the analyticalGoal parameter), not dictating the how. When the user does specify a how, the main agent can indicate that via the userPreferences parameter.
The main agent follows it… sometimes.
Giving an agent eyes
Even when the subagent received a good handoff, it would sometimes produce a chart with such obvious issues, we wondered - are you even seeing this? The answer, it turned out, was often literally no.
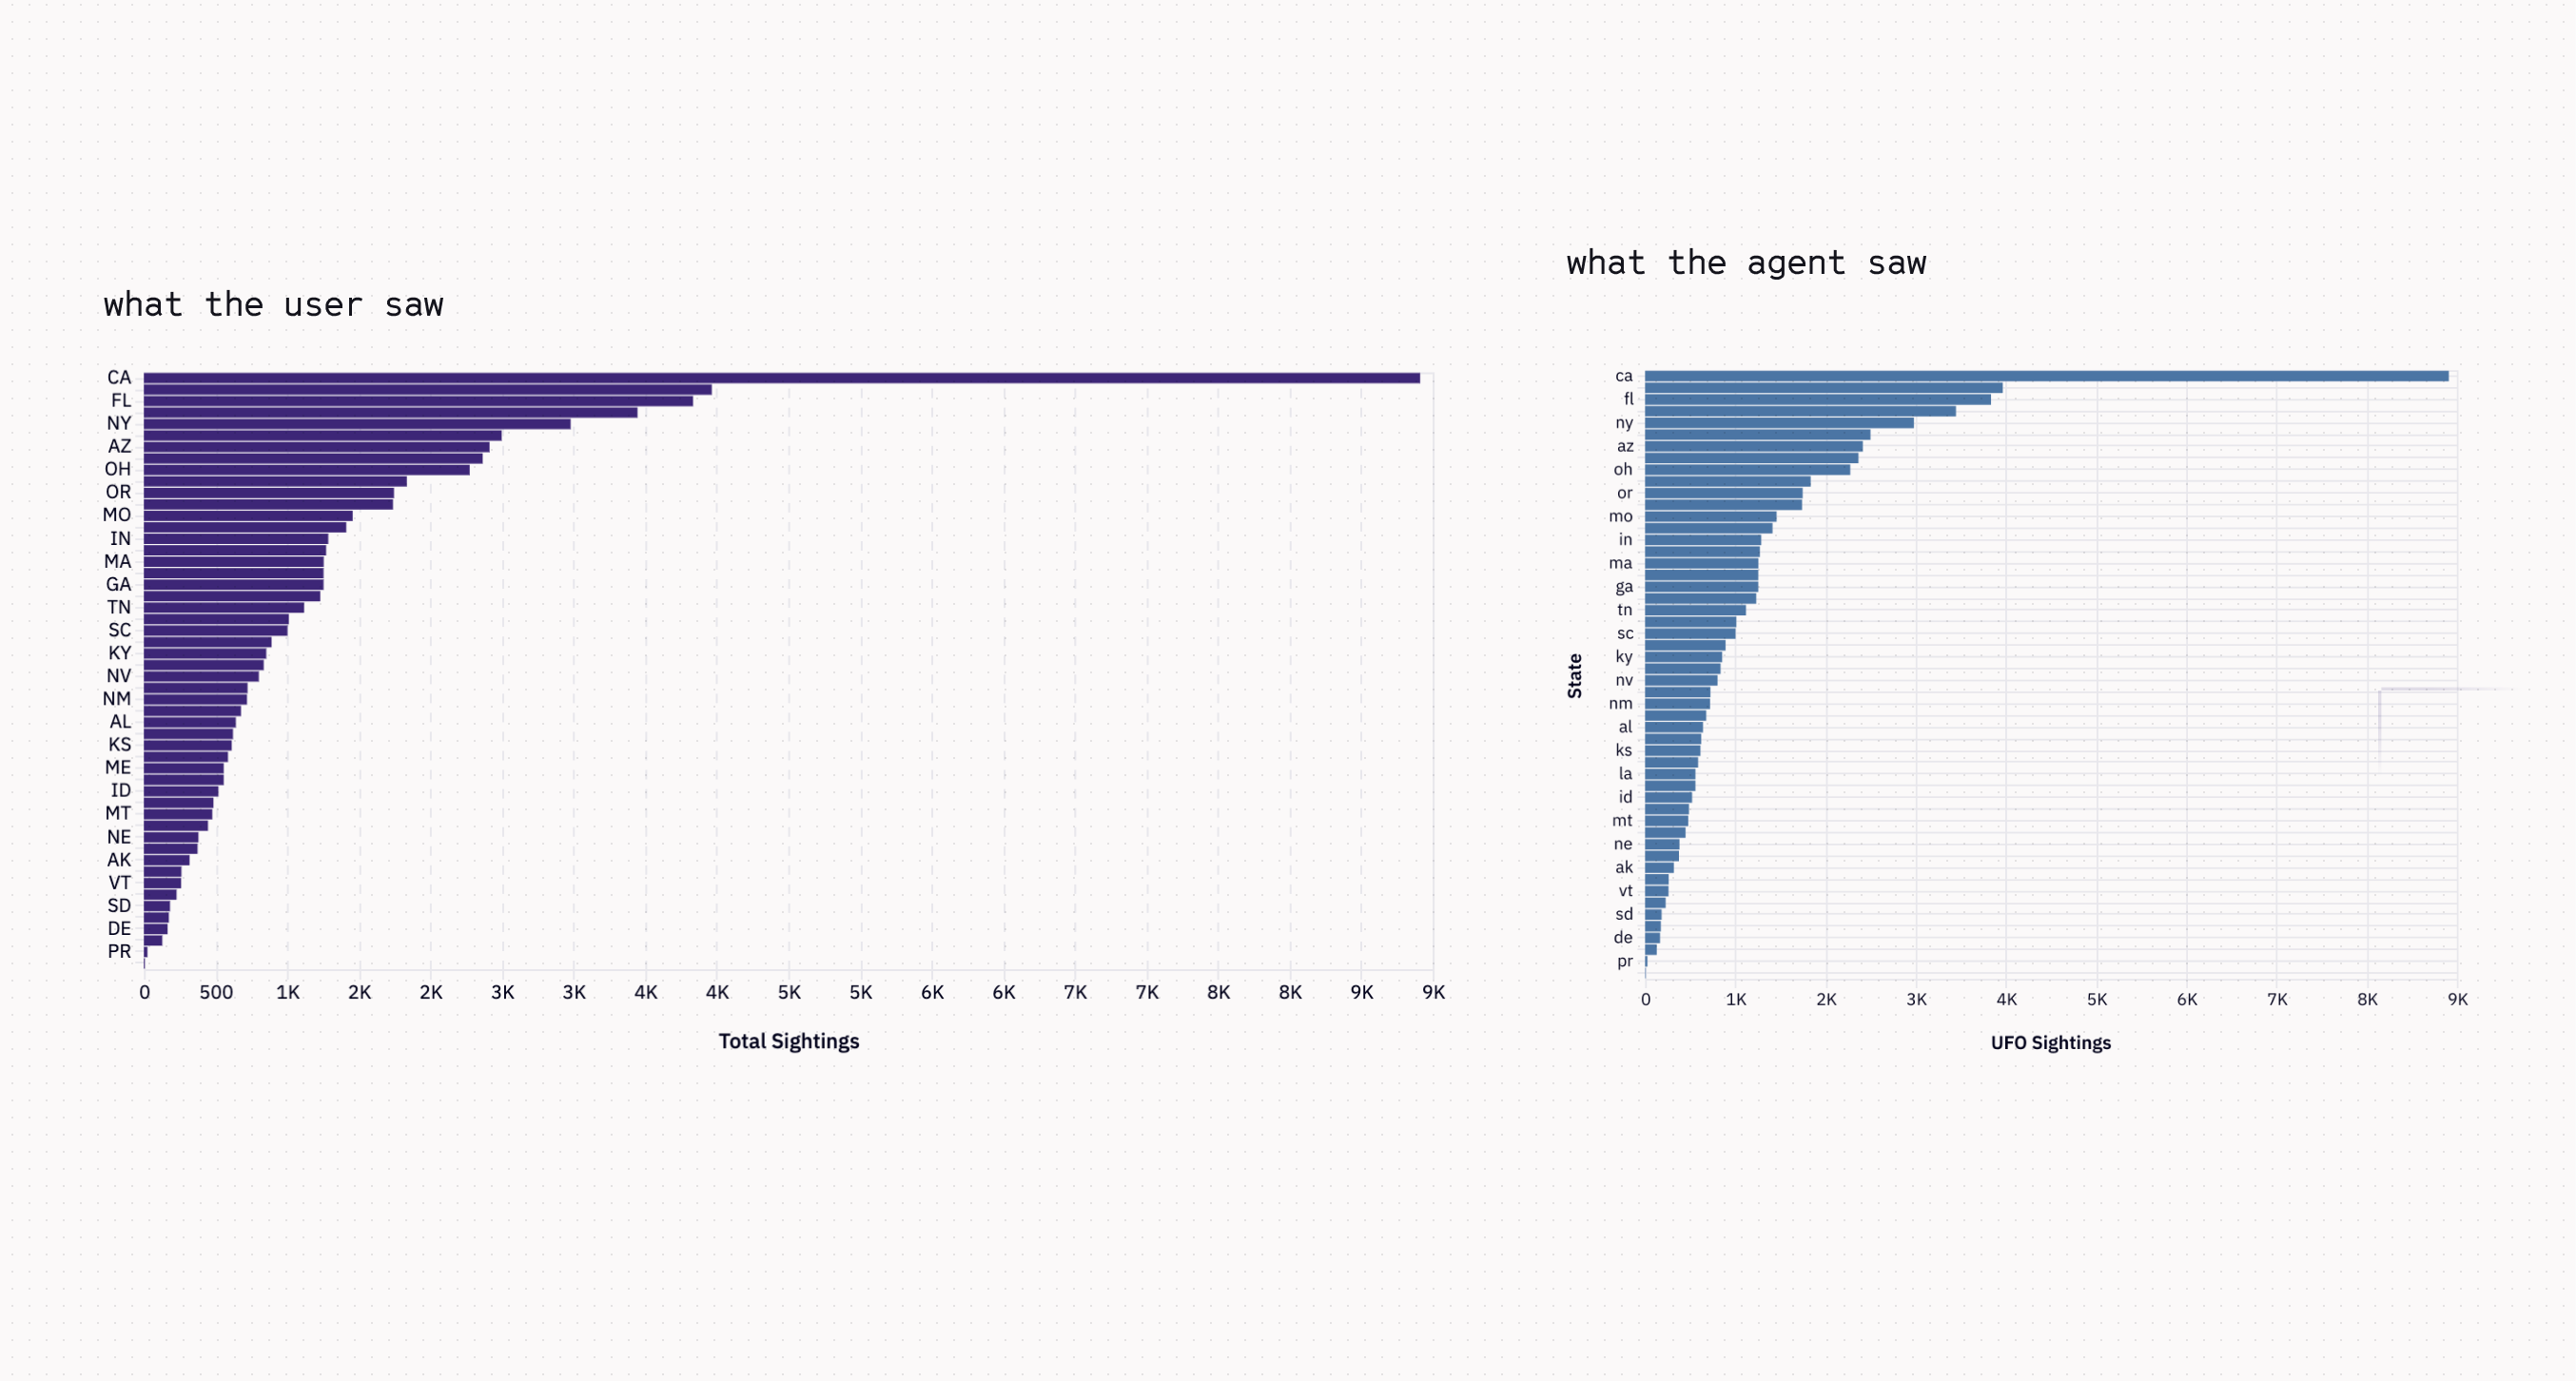
Here, the agent made a chart with repeated values on the x-axis 😱. To diagnose the issue, we put ourselves in its shoes using an internal thread-viewing tool. The image the agent saw was squished to a different aspect ratio by our server-side rendering pipeline, conveniently hiding any repeated labels.
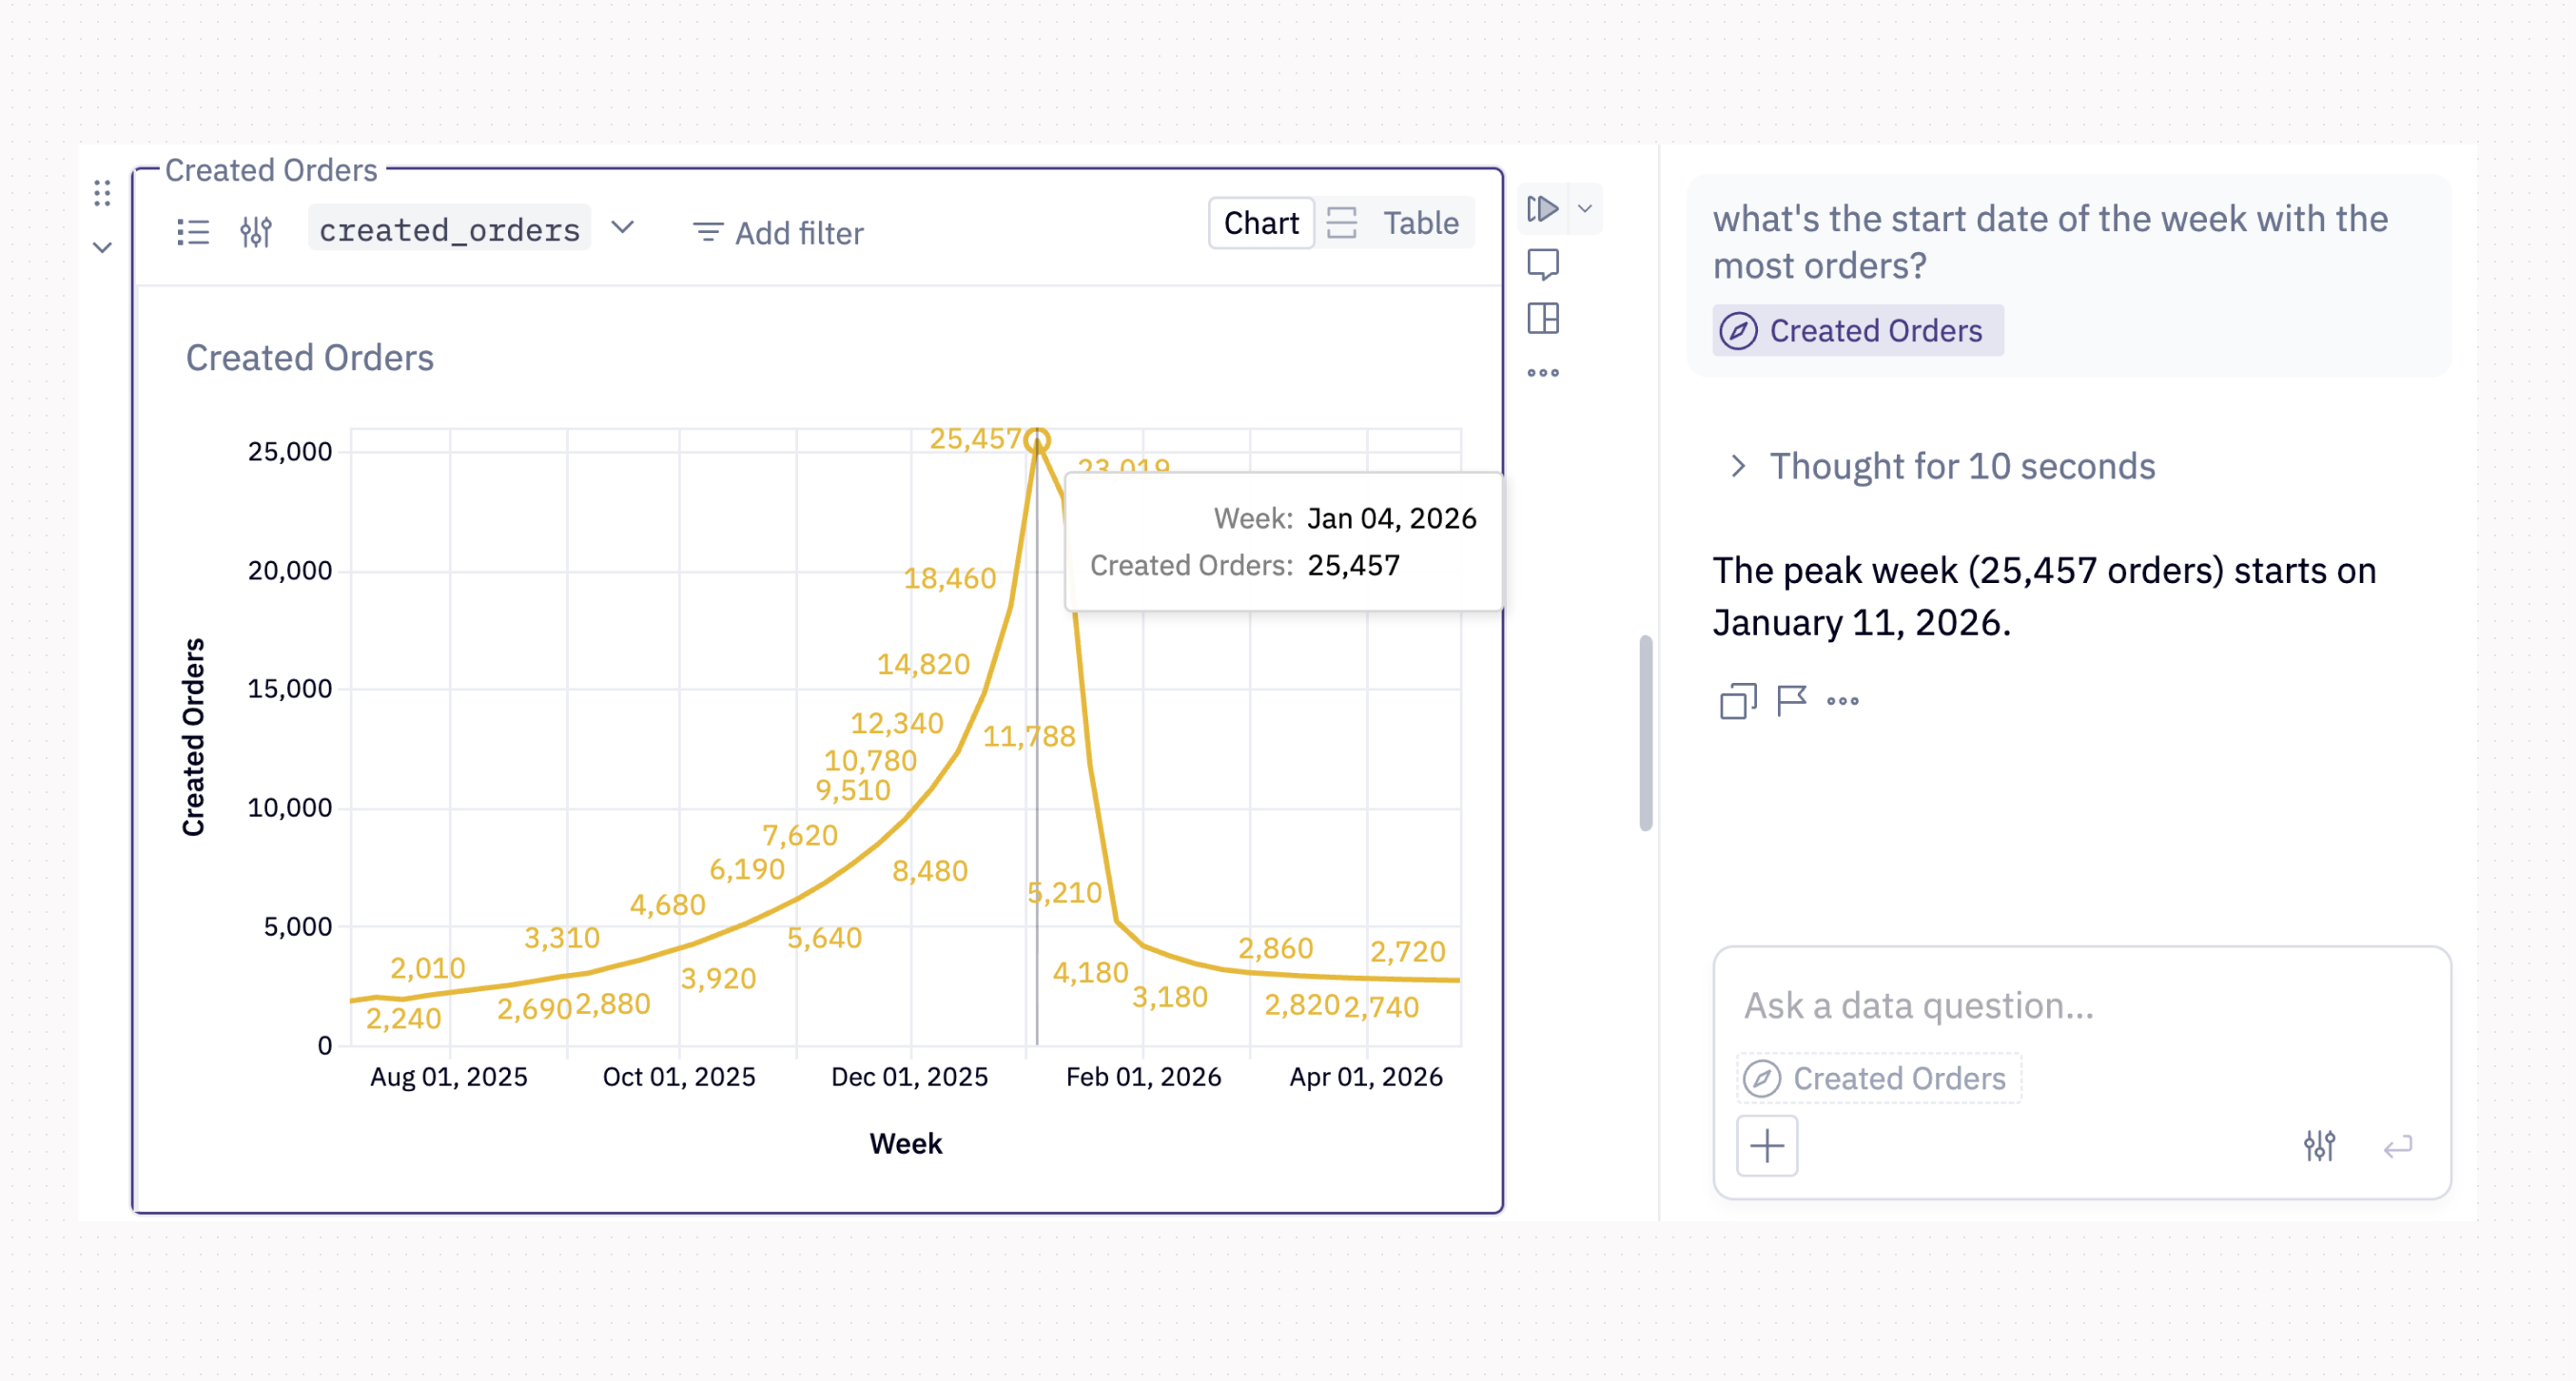
Unfortunately, that wasn’t an isolated case. The symptoms varied wildly, but the underlying condition was the same: the agent was working with a distorted or incomplete picture of its own output. In one of the worst manifestations, the agent confidently hallucinated the date of the highest peak. It only had access to the chart image with no underlying row-level data.
The prescription was always the same: more signal. Just as a human looking at a chart draws on multiple layers of perception - the overall gestalt, a specific data point, the underlying structure - the agent needs the same range. We started calling this “the agent accessibility principle,” and we baked it into the visualization subagent from the outset.
The agent can’t refine what it can’t perceive, and perception isn’t just one thing.
Structure first, then style
But perception isn’t the end goal in and of itself. The goal is to produce a stunning visualization. A human visualization practitioner doesn’t just look at the first chart they produce and declare victory. Instead, they work iteratively. In our mental model for chart creation (not coincidentally, the same model our UI is built around), this often involves setting up the basic structure of the chart, optionally adding series, and then styling each component at a time (x-axis, y-axis, series).
Our subagent tools are designed to enable the same workflow, one where the subagent can work both with more focus and more iteratively. Setting up the chart for the first time, it isn’t overwhelmed by a thousand styling minutiae. Instead, it can focus on the foundational skeleton: what data, what axes, what chart type. With that structure in place, it can then move on to formatting and styling. Or reassess and reconfigure entirely.
With the iteration loop in place, we worried about how to codify all our opinions about visualization into the prompt. It would be token prohibitive, and let’s be honest, no one, not even an agent, wants to read us pontificate at length.
Luckily, we didn’t have to. Frontier models already know a lot about visualization best practices. We found we didn’t need to harangue the subagent about the dangers of pie charts or rainbow color scales. Enough Stephen Few and Tufte had been absorbed into the zeitgeist. Instead, our prompting focuses on how best to use the tools we provide and on the Hex-specific gotchas that no foundation model would know out of the box. Here’s the core of the subagent’s prompt:
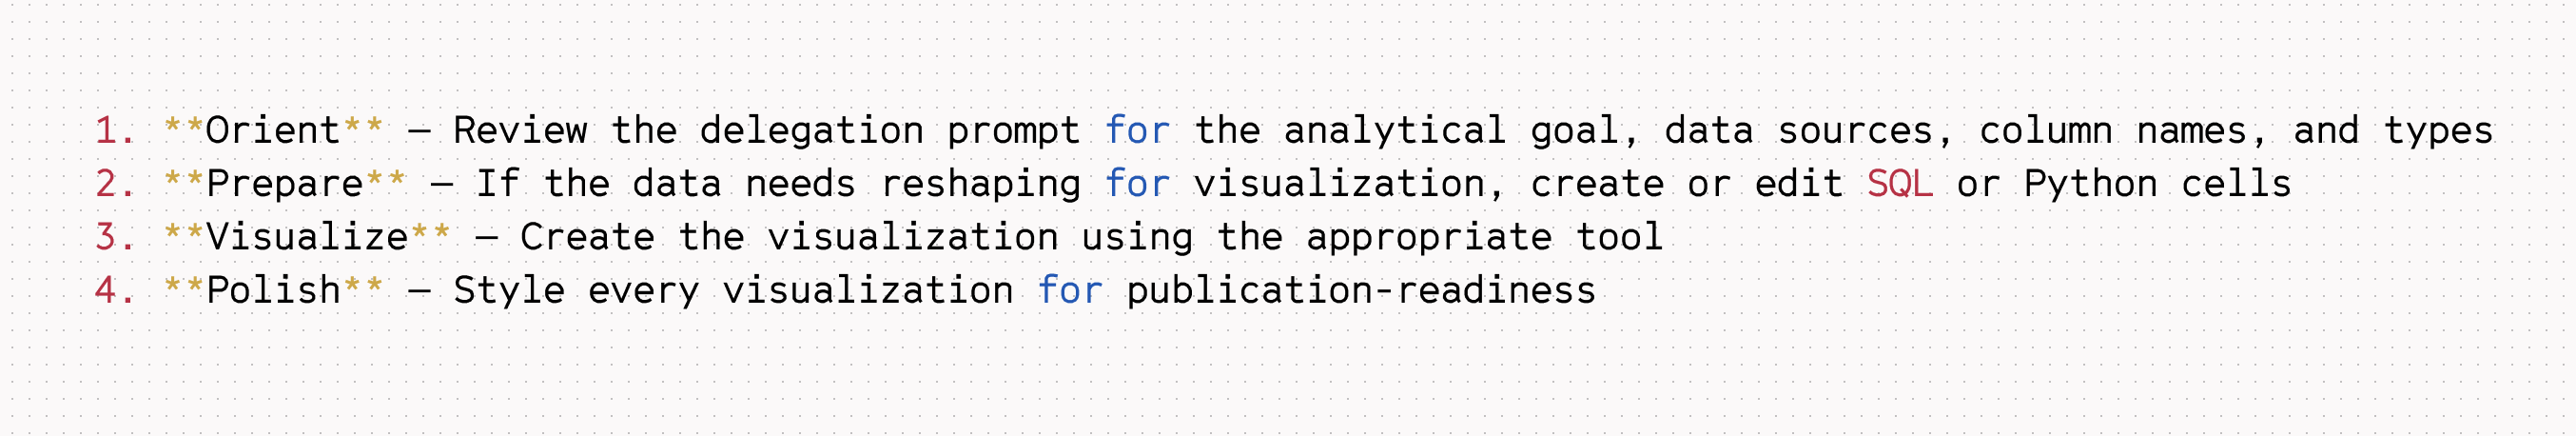
Nothing revolutionary. Just the same loop any practitioner runs instinctively, made explicit.
Beyond vibes
We now find ourselves asking, "But how do we know it's working?" High-level observability metrics are largely insufficient. We can count tool calls and calculate success rates, but remain completely in the dark about qualitative performance. The system might be enabled to create any chart a user can make in our UI, but does it make good ones? Could we get more precise than “the vibes” are good?
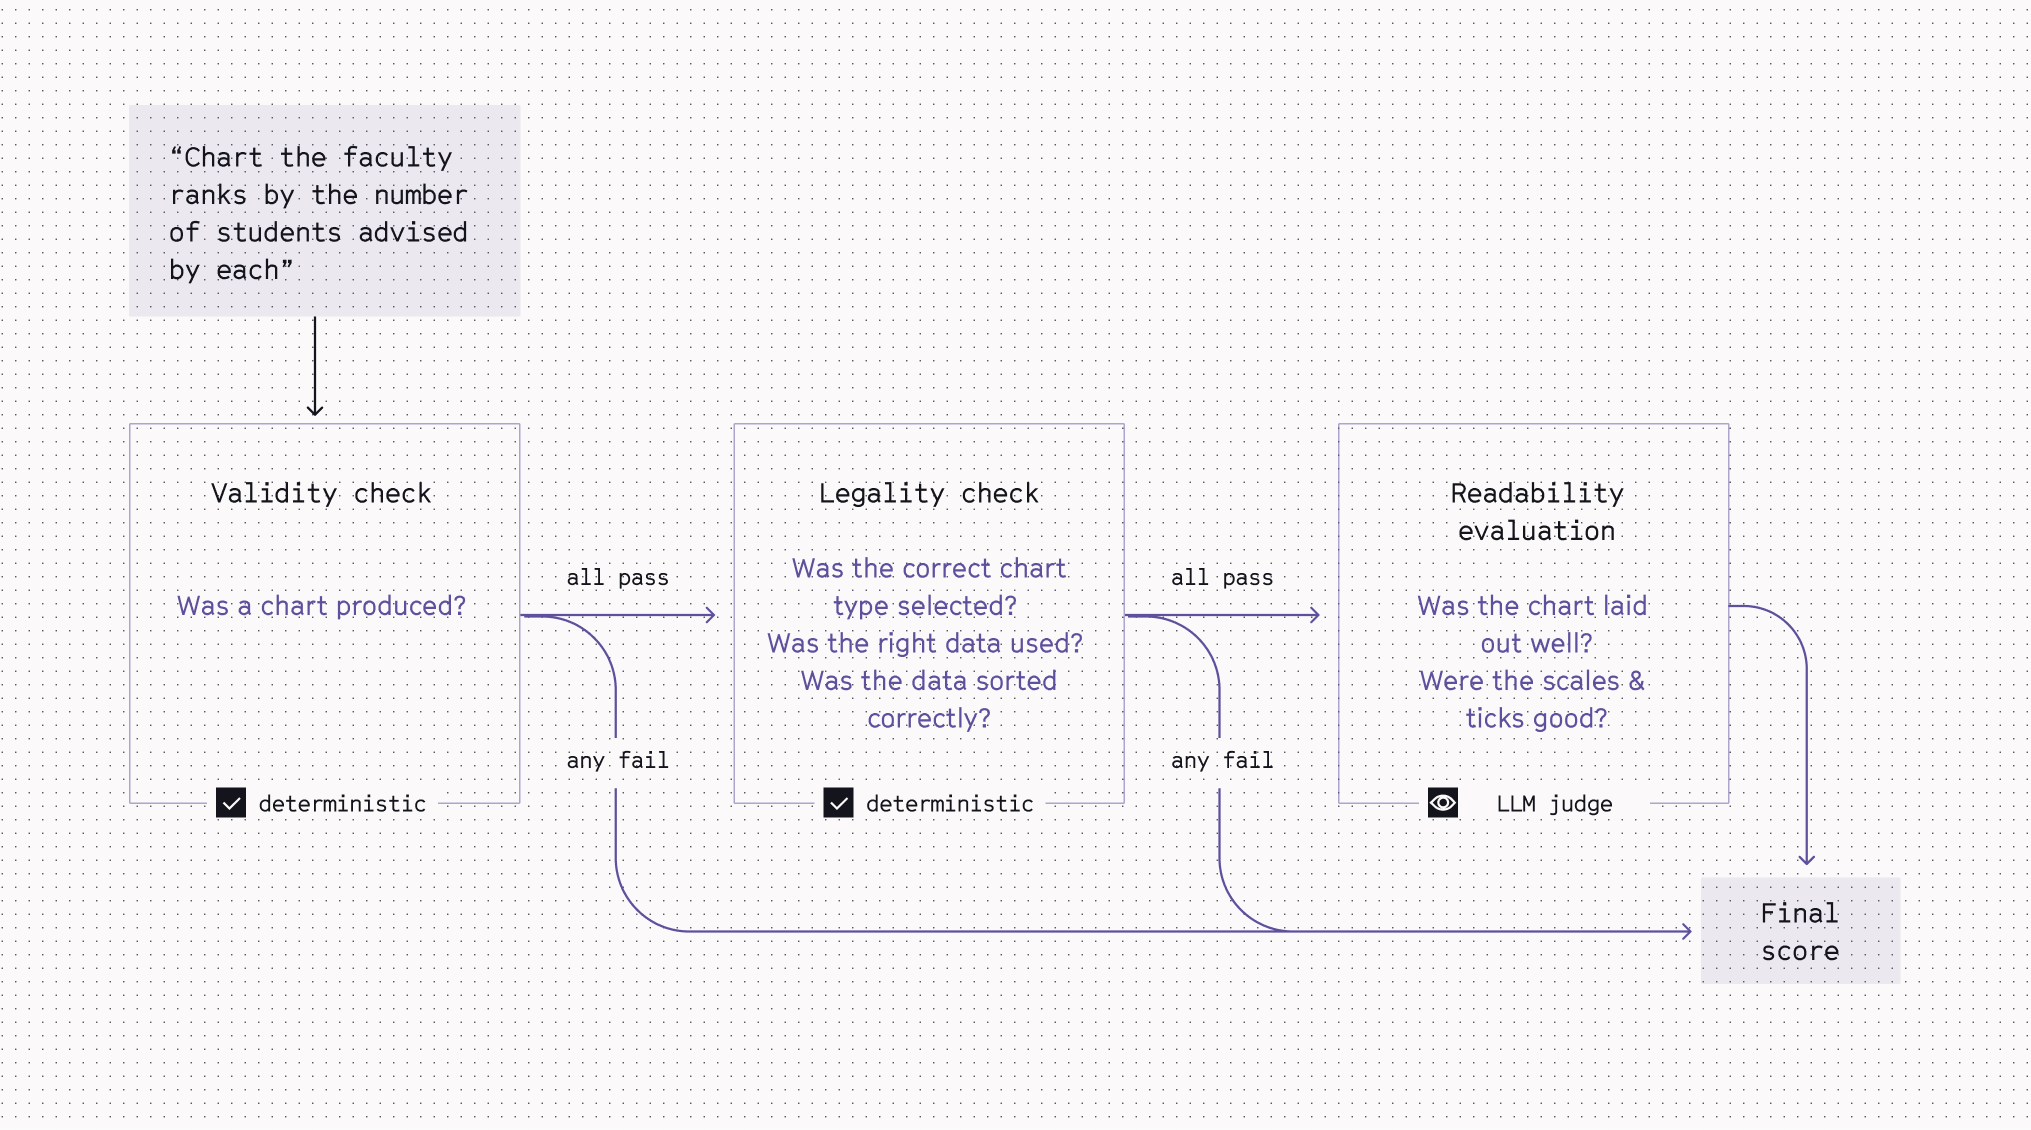
To evaluate overall end-to-end (e2e) performance on open-ended queries, we adopted a rubric modeled after VisEval, Microsoft's NL2VIS benchmark. We use the same 3-stage gates, where each stage must pass before the next is evaluated, but instead of an overall pass/fail, we assign a weighted score per stage to compute an overall metric (0 to 1) per run.
Our eval set also differs from VisEval’s in a few key ways.
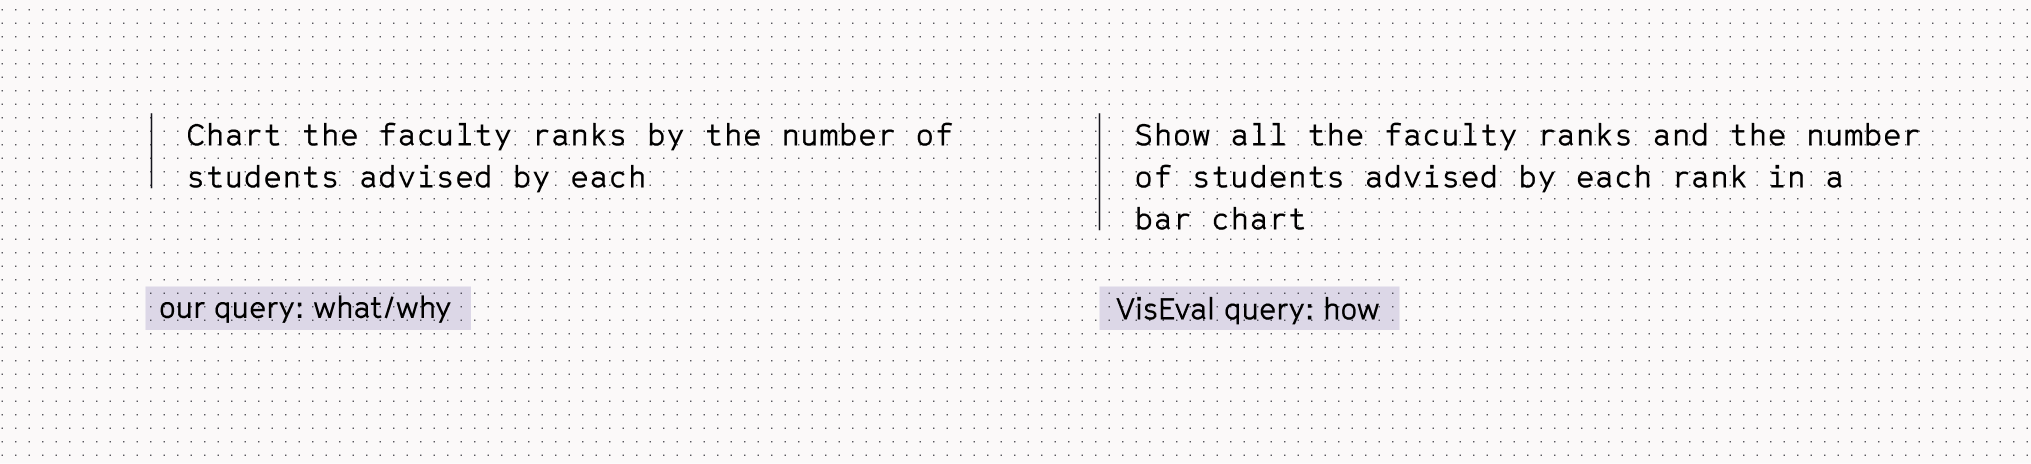
We use an extremely streamlined set: one prompt per expected chart type. This is largely for practical reasons, but also for increased signal-to-noise. Each query in the set is framed as what/why vs. how.
For the example query below, we want to test that our agent produces a horizontal bar chart without explicitly asking for one (it should be based on the chart-type guidance we provide in our tools!). If the eval leaks the desired solution to the agent, we're only testing execution. We want to test judgment.
Taken together, these modified VisEvals operate effectively as our e2e tests. Can the agent accurately produce all the chart types we support and make them readable?
Iteratively improving the subagent
These e2e style evals fall short when you’re chasing a specific bug. One particularly gnarly example: the agent claiming "Hex doesn't support X" when it's really the agent’s own tools that lack the capability. For this, we wrote a targeted eval that seeds the conversation to get the system to the right starting state, checks for specific phrasing, and flags tool calls that sidestep native chart functionality. While developing the fix, it unit tests the scenario in replicate. Once the fix ships, it becomes a regression test against future breakage.
Bug fix evals are reactive, but the subagent also provides a way to proactively expand our agentic visualization capabilities. When we ship a new agent feature, we can unit test whether it works, i.e., given the input params, does the tool update the visualization spec correctly. But that’s not sufficient - we need to know if the agent uses the new feature and does it do so efficiently and logically in a real-life context?
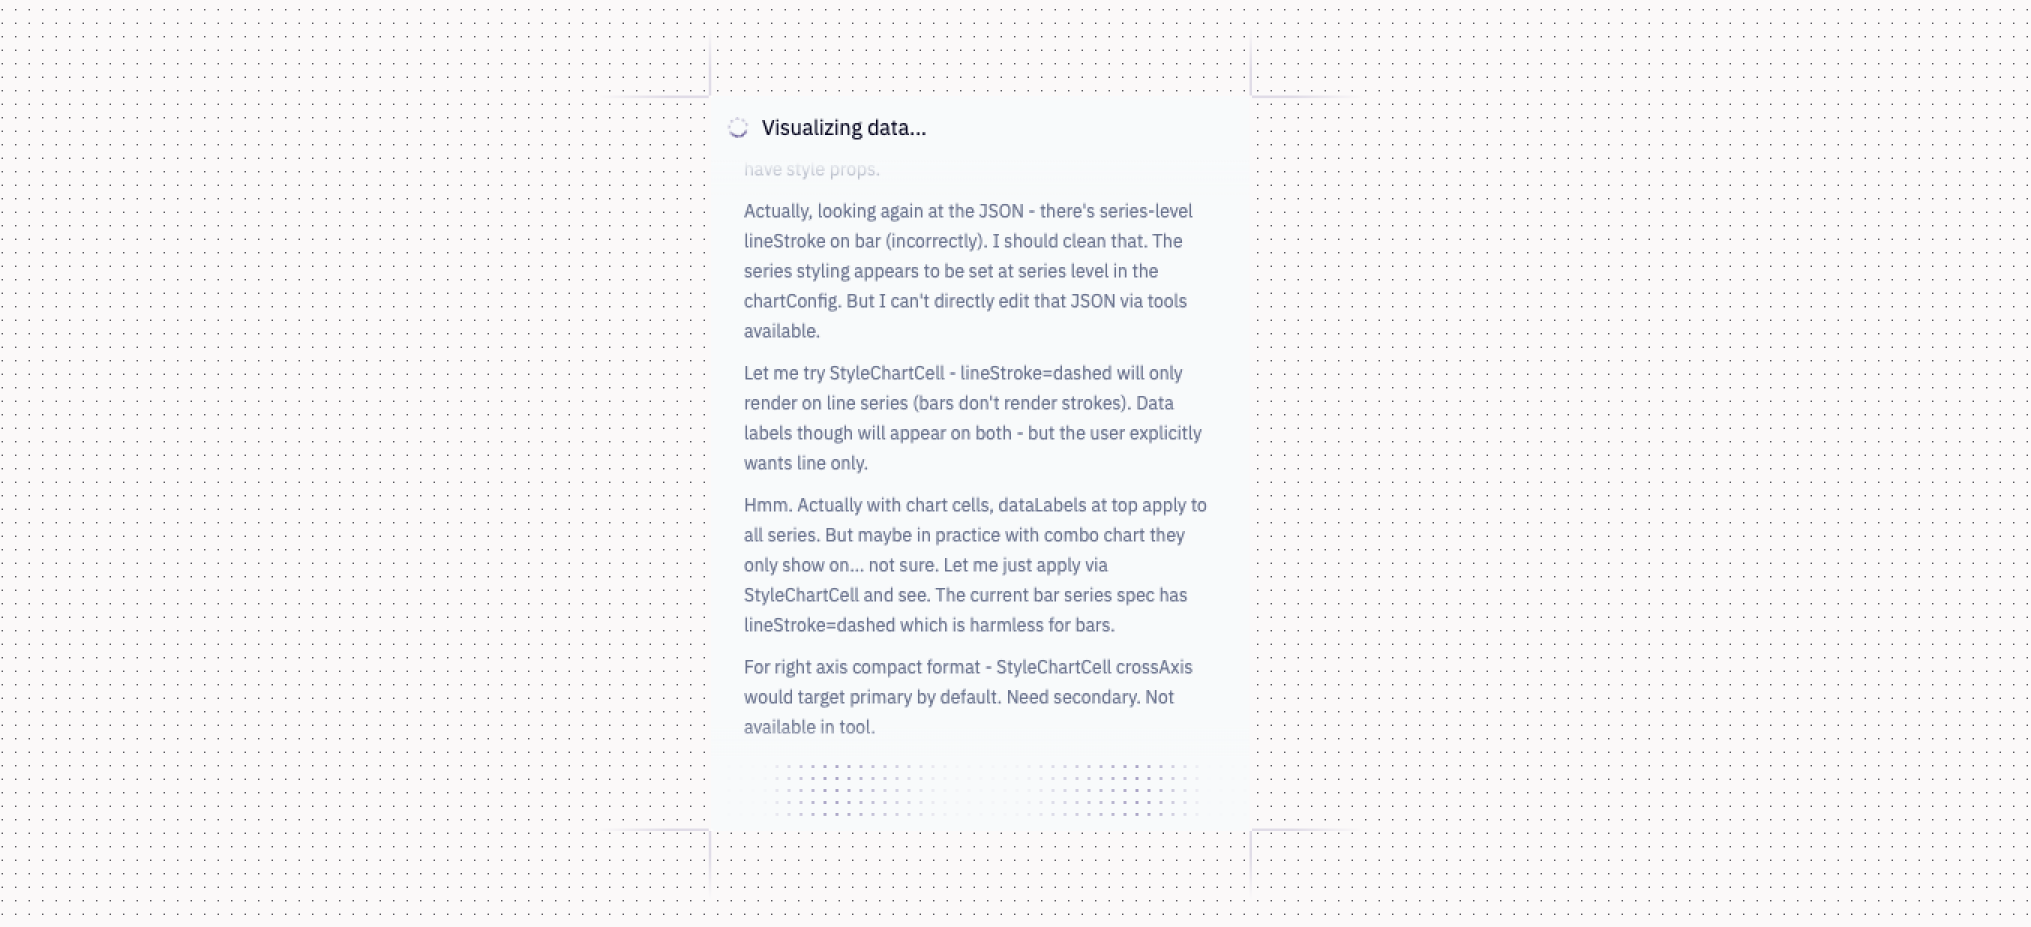
When we first gave the agent an add series tool, it used it to create plausible multi-series charts. Looking only at the input and output, we’d would have been satisfied. But when we peeked under the hood, we discovered the subagent in an anguished spiral of overthinking and reworking, going around and around, burning tokens.
We learned through many cases like this that there’s no shortcut to reading each agent thread by hand. Once a failure pattern emerges clearly enough, we can then encode it into an automated proxy metric. Many patterns are still just things we know when we see them.
Like chart creation, evaluating agentic visualization is inherently iterative. Make a change, carefully check different facets of the solution (the process as well as the final outcome), refine, own the problem. We live in a subagent now.
We’d love to show you more
With the visualization subagent and our growing eval suite, we're working hard to improve agentic visualization at Hex every day. If you're interested in these kinds of real-world AI and visualization engineering challenges, we're hiring! And if you want to see what we’ve built, give the visualization subagent a try. Let us know what you think 🤓