Blog
Customer retention analytics: Linking metrics to LTV and CAC
Learn how to use customer retention analytics to reduce churn, increase lifetime value, and build dashboards that drive smarter business decisions.
Your customers are slipping through your fingers, and your dashboards are telling you... absolutely nothing useful. The churn rate is rising, marketing is sweating, and someone just suggested “maybe we need another NPS survey.”
What you actually need is a map. One that shows who’s staying, who’s leaving, and why they made that decision before your team even noticed.
Customer retention analytics makes your money matter — by showing why people stay so you can finally stop pouring resources into those who won’t. Whether you're tracking free trials or monitoring Net Dollar Retention, the same truth applies: if you don’t know why people stay, you’ll never fix why they leave.
In this post, you'll learn which metrics matter, how to analyze them, and how to connect them to palpable business impact like LTV and CAC. We'll also show you how to build retention dashboards that make the insights stick.
No more guessing. Customer loyalty runs on data.
What is customer retention analytics?
Customer retention analytics is the process of tracking, analyzing, and predicting customer behavior to understand who sticks around, who leaves, and why. It goes beyond surface metrics like churn rate to uncover patterns across cohorts, product usage, contract renewals, and customer health.
Think of customer retention analytics as a magnifying glass on the post-sale journey. Instead of just counting users, you learn how long they stay, what keeps them engaged, and which actions signal they’re about to bounce. When done well, customer retention analytics turns vague hunches into hard numbers and gives teams a clear path to improving lifetime value across their customer base.
Key metrics in customer retention analytics
Not all metrics deserve your attention. Some look impressive in a slide deck but say nothing about whether your customers are actually sticking around. The metrics that matter are those that help you diagnose problems, track performance, and connect retention to revenue:
- Churn rate: The percentage of customers who stop using your product over a given time period. High churn usually means something’s broken, but don’t stop there — look for why.
- Customer lifetime value (LTV): A forecast of how much revenue the average customer will generate before they churn. LTV ties retention directly to business impact. The longer someone stays, the more valuable they become.
- Customer acquisition cost (CAC): The total cost of acquiring a customer. Retention analytics matters here because keeping customers longer makes your CAC spend more efficient.
- Net dollar retention (NDR): Especially critical for B2B SaaS, and tracks how much revenue you retain from existing customers, including expansion and contraction. A high NDR means your current customers are more than covering their weight.
- Repeat purchase rate: How often customers come back to buy again. This is vital in e-commerce and self-serve models where there’s no account manager nudging them to return.
- Customer health score: A composite metric that combines engagement, usage, support activity, and other signals to predict the likelihood of renewal. Great for spotting risks before it’s too late.
Each of these metrics opens a window into your customer’s experience. Together, they form the foundation of a retention strategy that actually makes a change.
A few techniques for customer retention analysis
Customer retention analytics is only as good as the techniques behind it. These methods help you go beyond vanity metrics and understand what uniquely drives churn, loyalty, and lifetime value for your customers. With Hex, your data teams can build and share these analyses using live notebooks, customizable data visualizations, and both code and no-code workflows.
Cohort analysis
Cohort analysis groups customers based on shared characteristics, often by acquisition month or signup channel. You can then track retention rates and churn over time to see when users tend to drop off or stay engaged.Hex makes this process simple. You can generate cohort tables, slice by segment, and visualize trends in customer behavior. This gives your team a clear view of which tactics improve retention and which ones fall flat.
Survival (churn) curve analysis
Survival analysis helps you understand how long users stick around and when they are most likely to churn. By plotting time-to-churn curves, you can spot risk patterns early and build retention strategies that actually work.
Using Hex, you can create survival curves with SQL or Python, compare different customer segments, and monitor how interventions affect churn rate over time. These curves are easy to refresh and share, so everyone from product to support sees the same retention story.
RFM (Recency, Frequency, Monetary) segmentation
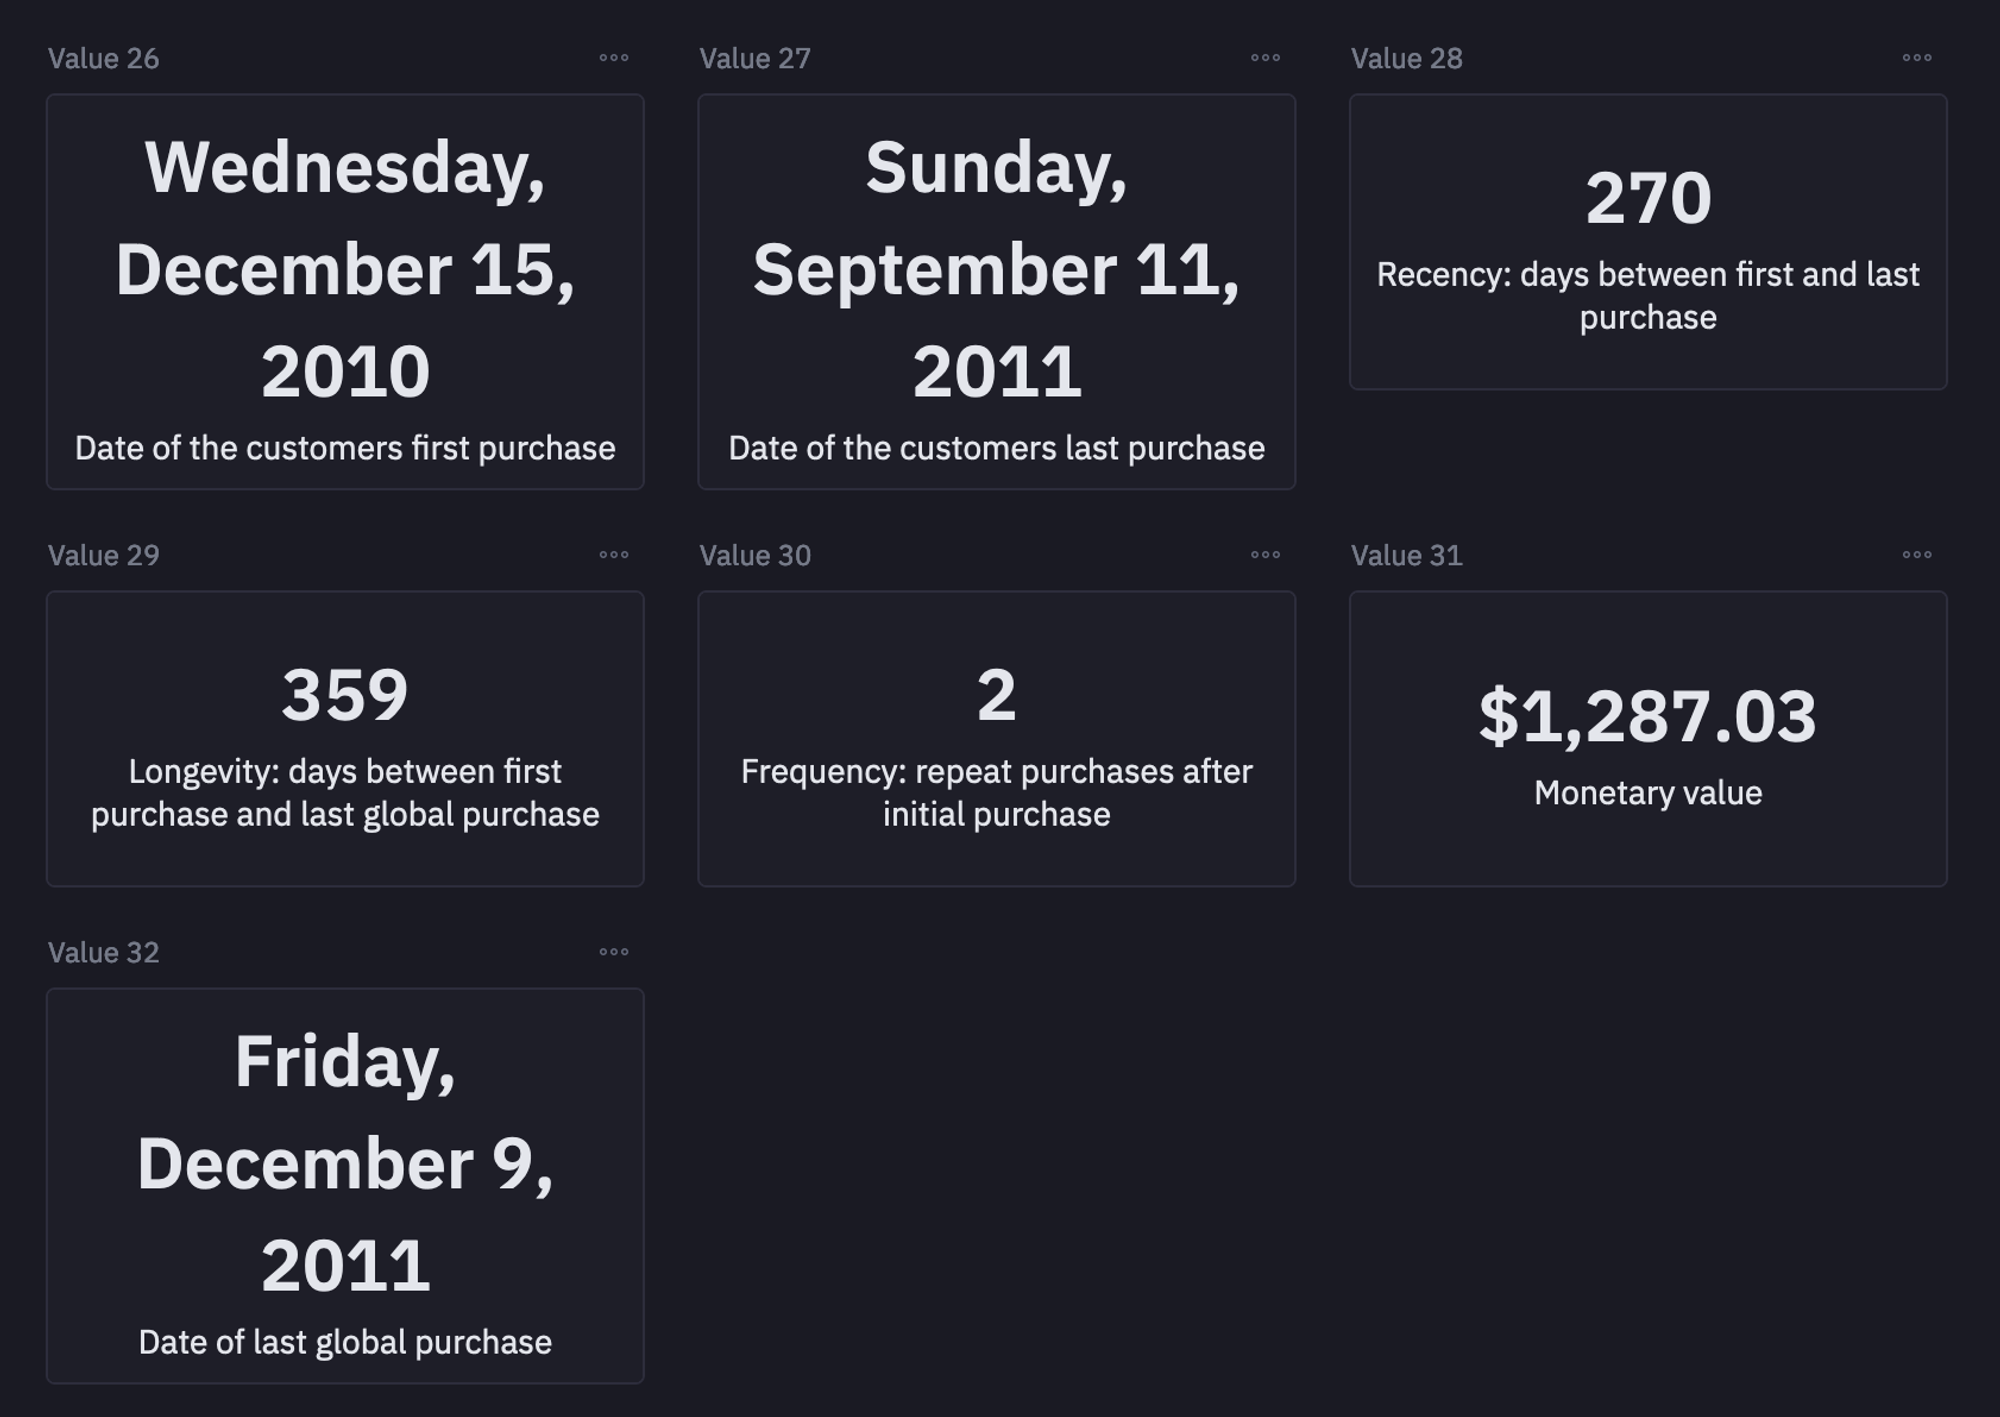
RFM segmentation ranks users by how recently they engaged, how frequently they return, and how much they spend. It’s a powerful way to prioritize outreach, tailor messaging, and maximize customer lifetime value.
Hex allows you to run RFM scoring in a repeatable, scalable way. You can build dashboards that surface your most valuable users and flag those at risk. These insights feed directly into retention campaigns and help your team act before churn happens.
Linking retention metrics to LTV and CAC reduction
Customer retention analytics plays a critical role in shaping sustainable growth. It provides the insight needed to directly improve customer lifetime value (LTV) and reduce customer acquisition cost (CAC). These two metrics form the backbone of any scalable go-to-market strategy.
When you increase retention, customers stay longer, engage more, and ultimately spend more. This drives higher lifetime value across your customer base. At the same time, improved retention reduces churn rate, which means you don’t need to constantly replace lost users. As a result, your customer acquisition cost becomes more efficient, since each customer contributes more revenue over time.
Metrics like churn rate, repeat purchase behavior, Net Dollar Retention, and engagement frequency are essential components of customer retention analytics. They help you identify which customer segments are the most valuable and which experiences drive long-term loyalty. These insights give your team the data they need to optimize campaigns, adjust onboarding flows, and reduce unnecessary acquisition spend.
Hex helps make this connection clear. With its data visualization tools and retention-focused templates, teams can build live dashboards that show how changes in retention metrics impact LTV and CAC. These dashboards turn abstract retention goals into concrete business outcomes, visible in real time and shareable across the organization.
Implementing customer retention strategies
Effective customer retention strategies rely on more than guesswork. They demand consistent effort, real-time insights, and a deep understanding of the customer journey. With the right customer retention analytics in place, your team can take targeted action that reduces churn rate and increases customer lifetime value.
Once you identify who is at risk and why, you can apply data-driven strategies to retain them. These approaches work across both B2B and B2C models, and they scale even better when supported by clear dashboards and data visualization.
Here are several proven customer retention strategies that integrate seamlessly with your analytics workflows:
Improve onboarding
Most churn happens early. Use customer behavior data to pinpoint drop-off moments and refine your onboarding experience. Shorter time to value means better engagement and improved retention metrics.
Support at-risk customers
Build a customer health score using engagement frequency, support data, and purchase history. When a score drops, notify your team to take action. Reducing churn rate starts with identifying risk before it becomes a loss.
Incentivize continued use
Target loyal customers with loyalty rewards, account milestones, or feature previews. Segment users based on activity using customer retention analytics so incentives are relevant and timely. Retaining an existing customer is significantly more cost-effective than acquiring a new one, making these strategies essential for CAC efficiency.
Personalize communication
Leverage RFM segmentation, churn modeling, and cohort analysis to tailor emails, in-app messages, or outreach. Segmented communication increases retention, boosts conversion, and improves overall customer satisfaction.
Collect and apply feedback
Use churn surveys, user interviews, and NPS scores to identify friction points. Combine qualitative feedback with product usage analytics to prioritize fixes that matter most for retention.
As Forrester’s 2024 US Customer Experience Index finds, firms that put retention first deliver 51% higher retention, 41% faster revenue growth, and 49% faster profit growth than their peers.
Hex’s interactive dashboards allow you to design and automate all of this in one space. Use live data visualizations to monitor retention trends, test strategy effectiveness, and keep your team aligned. Customer retention strategies powered by analytics help you retain more users, maximize lifetime value, and scale efficiently.
Building interactive retention dashboards
To turn customer retention analytics into action, you need dashboards that do more than track vanity metrics. Interactive dashboards help you visualize trends, identify churn risk, and measure customer retention in real time. They become your team’s control center for understanding customer behavior and improving business growth.
A well-designed retention dashboard should let you:
- Track customer churn rate and customer retention rate across any time period
- Compare cohorts of new customers and active users based on user behavior
- Surface customer engagement signals like feature usage, session frequency, or follow-up activity
- Identify top customer pain points using support logs, customer feedback, and net promoter score (NPS) responses
- Monitor retention-focused KPIs alongside growth levers like upsells, expansion, or loyalty programs
With Hex, you can combine customer data from your warehouse with SQL, Python, or no-code workflows to create dynamic analytics tools. Your dashboards can layer in predictive analytics, integrate historical data, and even trigger alerts when retention KPIs dip below a benchmark. You can personalize them by demographics, segment by persona, and connect outcomes to marketing campaigns or pricing changes.
These dashboards go beyond simply reporting the number of customers or charting marketing efforts. They help you understand the lifecycle of customer relationships, what’s working in your retention efforts, and where to improve your customer success strategy.
Compensating for the loss of one customer may require acquiring as many as three new ones, and 80% of growth at top companies comes from expanding relationships with existing customers. That underscores why predictive retention analytics and churn modeling aren’t nice to have — they’re essential.
Hex’s churn prediction and funnel analysis templates make it easy to build interactive dashboards that track at-risk users, measure customer retention metrics, and drive smarter decisions. Whether you're improving engagement with new users or scaling your customer success strategy, Hex gives your team the tools to act on what matters most.
Take our customer churn template for a spin and start building retention workflows that grow with your business.
If this is is interesting, click below to get started, or to check out opportunities to join our team.