Bring the magic of AI to data analysis

Now, anyone can explore data using natural language, with or without code, on trusted context, in one integrated platform.

Galactic Revenue Insightschevron-down
notebookNotebook
app-builderApp builder
comment
Share
Publish app
SQL cell
quarterproduct_lineregioncustomer_sectorrevenue_usd
0Q3-2025TeleportationCore WorldsDefense18200000
1Q3-2025Quantum DrivesCore WorldsDefense16500000
2Q3-2025Wormhole InitiatorsCore WorldsDefense14800000
3Q3-2025Dark Matter LasersCore WorldsDefense13100000
4Q3-2025Temporal StabilizersCore WorldsDefense11400000
5Q3-2025Anti-Gravity GeneratorsCore WorldsDefense9700000
Python cell
History
/Can you help me chart this you help me chart this?
plus
close
Can you show me NexaCorp's Q3 sales by product line?
I'll help you analyze NexaCorp's Q3 revenue by product line and region. Let me search for the most relevant data source.
chevron-downThought for 23 seconds

NexaCorp Q3 sales by product line

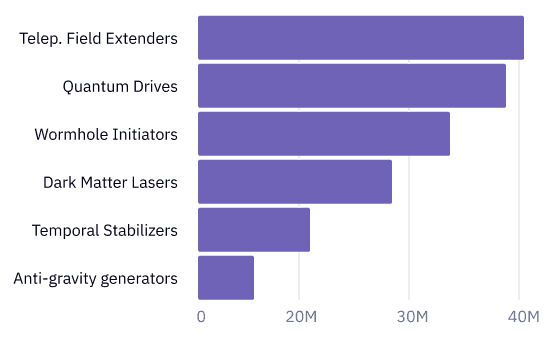
Here’s what I found in the “nexacorp_sales” tables:

  • Teleportation field extenders — $42.3M
  • Quantum drives — $38.7M
  • Wormhole initiators — $33.1M
  • Dark Matter Lasers — $28.6M
  • Temporal stabilizers — $21.8M
  • Anti-gravity generators — $11.2M
Revenue by Product Line Q3
Teleportation Field ExtendersQuantum DrivesWormhole InitiatorsDark Matter LasersTemporal StabilizersAnti-Gravity Generators 
Can you break this out by region too? I want to see how each product line performed across the Core Worlds, Mid-Rim, and Outer Rim.
I'll help you analyze NexaCorp's Q3 revenue by product line and region. Let me search for the most relevant data source.
chevron-downThought for 11 seconds
I found regional revenue data in the endorsed semantic model “NexaCorp: Galactic Sales Model.” This model contains standardized region definitions (Core Worlds, Mid-Rim, Outer Rim) and pre-calculated revenue metrics, which is the best source for your question.

Let me create a grouped bar chart so you can compare regions within each product line:
Galactic Revenue Distribution by Product Line (Q3)
Teleportation Field ExtendersQuantum DrivesWormhole InitiatorsDark Matter LasersTemporal StabilizersAnti-Gravity Generators 
plus
NexaCorp Galactic Warehousechevron-down
enter
Avatar
@Hex can you show me NexaCorp's Q3 sales by product line?
☑️ 1
3 replies
Your question was sent to Hex! The answer will be posted here, but you can also follow along in Hex.
View in Hex

NexaCorp Q3 sales by product line

Here’s what I found in the “nexacorp_sales” tables:

  • Teleportation field extenders — $42.3M
  • Quantum drives — $38.7M
  • Wormhole initiators — $33.1M
  • Dark Matter Lasers — $28.6M
  • Temporal stabilizers — $21.8M
  • Anti-gravity generators — $11.2M
NexaCorp Q3 Revenue by Product Line (56 kB)
Slack chart
NexaCorp product line performance (Q3)
Share
Continue in project
Can you show me NexaCorp's Q3 sales by product line?
I'll help you analyze NexaCorp's Q3 revenue by product line and region. Let me search for the most relevant data source.
chevron-downThought for 23 seconds

NexaCorp Q3 sales by product line

Here’s what I found in the “nexacorp_sales” tables:

  • Teleportation field extenders — $42.3M
  • Quantum drives — $38.7M
  • Wormhole initiators — $33.1M
  • Dark Matter Lasers — $28.6M
  • Temporal stabilizers — $21.8M
  • Anti-gravity generators — $11.2M
Revenue by Product Line Q3
Teleportation Field ExtendersQuantum DrivesWormhole InitiatorsDark Matter LasersTemporal StabilizersAnti-Gravity Generators 
Can you break this out by region too? I want to see how each product line performed across the Core Worlds, Mid-Rim, and Outer Rim.
I'll help you analyze NexaCorp's Q3 revenue by product line and region. Let me search for the most relevant data source.
chevron-downThought for 11 seconds
I found regional revenue data in the endorsed semantic model “NexaCorp: Galactic Sales Model.” This model contains standardized region definitions (Core Worlds, Mid-Rim, Outer Rim) and pre-calculated revenue metrics, which is the best source for your question.

Let me create a grouped bar chart so you can compare regions within each product line:
Galactic Revenue Distribution by Product Line (Q3)
Teleportation Field ExtendersQuantum DrivesWormhole InitiatorsDark Matter LasersTemporal StabilizersAnti-Gravity Generators 
plus
NexaCorp Galactic Warehousechevron-down
enter