Blog
Data science workflows made easy: A practical guide packed with best practices
With our guide, learn how to build data science workflows that your team will love.
If you’re a data team, you probably use a number of data science workflows to build and ship your data science products. And these workflows are important. A solid workflow brings Agile thinking and CI/CD muscle into your data science projects so you can work faster and more efficiently.
In this guide, you'll find a checklist to validate whether or not your current workflow is solid, some tools and technology recommendations to level up your processes, and tips to overcome common challenges.
What is a data science workflow?
A data science workflow breaks your entire project into more manageable milestones. Think of a data science workflow as your roadmap to building data products for business stakeholders, or the series of steps data scientists follow to turn raw data into real-world impact.
Each sub-process acts like a checkpoint, keeping you on track while you inch closer to your goal: extracting actionable insights to drive better business decisions.
But let’s be real: most tools make that workflow harder than it needs to be. You’re constantly jumping between notebooks, dashboards, and transformation tools just to keep everything in sync.
It’s too easy to lose context, repeat work, or get stuck waiting on a stakeholder’s thumbs-up. That’s why the right tooling matters. (Hex is built to solve for this being a single workspace for Python, SQL, version control, and collaboration — built for fast-moving, highly collaborative data science teams.)
Key phases of a data science workflow
Here’s the promised checklist for a data science workflow.
1. Define the problem
Before you crunch a single number, you need to lock in your problem statement. Begin by identifying the business’s highest-priority challenges, then collaborate with the key stakeholders working to solve them. After talking with them, set clear objectives and success metrics.
We’ve broken this first task down into some more easily actionable steps:
- Work with stakeholders to understand the main pain points and expectations.
- Check if you have enough relevant data, either in-house or from open-source data sources.
- Set clear success metrics for validation at the end.
- Break down the big problem into smaller goals.
2. Gather and clean data
We know that a successful data-driven strategy starts with the right data. It’s time to hit up your company databases, chat with data engineers, tap into APIs, or even web scrape open sources to gather relevant datasets.
Tip: Hex notebooks directly connect to data warehouses like Snowflake, BigQuery, and Redshift, so you can pull in the data with simple SQL queries.
"Hex has the most delightful data science notebook ever. This is the magic sauce; data scientists can both experiment and deploy models to users in one go." - Joel S. Senior Data Scientist
Once you’ve got the data, it’s cleanup time. Use SQL or Python to remove duplicates, handle missing values, standardize data types, and validate data quality.
💡Check out this guide for detailed steps involved in data cleaning and preprocessing.
Exploration and analysis come next. Start with an analysis that will clarify the first layer of the problem (we have many analysis templates and starting points to choose from here!). Use data visualization techniques to discover patterns, spot outliers, and, most importantly, start identifying the right machine learning algorithms for your data.
3. Explore and model
Feature engineering should also be done here: Create new features that reveal hidden patterns. Drop irrelevant ones to keep your dimensionality in check.
Not sure where to begin? We also have a handy step-by-step guide for performing exploratory data analysis (EDA) and how it can help.
Now comes the favorite part of most data scientists’ days — training a machine learning model. Train two or three AI algorithms that you believe best fit your data, and evaluate the results in the next step.
Reality check: This stage is often where things get clunky. Switching between SQL, Python, and a separate BI tool can slow down your analysis. With Hex, you can do it all in one place: query data, run Python, visualize outputs, and share dashboards, without requiring to switch between multiple tools.
4. Evaluate results
Different models are measured using different metrics. For regression algorithms, you'll likely rely on mean squared error (MSE) or absolute error. For classification models, you'll typically look at accuracy, precision, recall, and more.
If the results aren’t quite good, don’t panic — you can always try hyperparameter tuning. This means iteratively testing different model parameters to find the optimal one that gives you the best performance.
5. Deploy and share insights
Now that you’ve got your model up and running, it’s time to deploy it into your business processes. Then, compare your live model’s performance to the objectives you set earlier.
For example, let’s say your goal was to boost sales by X%, and you deployed a discount recommendation model to make that happen. After using the model’s recommendations in real-time, calculate the sales and compare them to your goal to see how well it performed.
Data apps are a great way to share these results with your stakeholders. Use Hex’s data app builder to create interactive dashboards that make it easy for everyone to see, understand, and act on the results.
Types of data science workflows and when to use them
While there’s no universally accepted order of steps in a data science workflow, several prominent frameworks have emerged over the years. Let’s review some popular and widely adopted methods.
CRISP-DM
Cross-Industry Standard Process for Data Mining (CRISP-DM) is a structured approach for implementing an end-to-end data mining project. It covers everything from business understanding to the technical details. It’s pretty similar to the steps we shared earlier, with added emphasis on frequent updates and iterative development.
Best for: CRISP-DM is a flexible framework that works well across industries. Its beauty lies in its flexibility. The iterative nature makes it super easy to loop back to previous stages whenever a hiccup happens or when you want to fine-tune your process. It encourages continuous development, making it adaptable to changing needs.
SEMMA
SEMMA is a more specialized framework for data modeling part of your workflow. It involves five key stages:
- Sample (keep the most important data)
- Explore (analyze the data)
- Modify (transform data and engineer features)
- Model (train a model)
- Assess (evaluate model performance)
Best for: SEMMA is tailored to the SAS software suite. It’s the go-to choice when you’re building common models like customer segmentation or fraud detection in a SAS environment.
OSEMN
While CRISP-DM provides a comprehensive approach, OSEMN is a more focused technical framework for data science. In this workflow, you obtain (data collection), scrub (data preparation and cleaning), explore (data analysis), model (train a model), and interpret (evaluate model performance).
Best for: OSEMN is best used when you’re focusing on the technical aspects of data science, particularly in environments that emphasise data collection, cleaning, and modeling.
Modern data science workflow challenges (and how to beat them)
Even when you choose the best data science framework, common challenges can still sneak up on you. Keep these tips top of mind to avoid them.
Breaking down silos between SQL, Python, and visualization workflows
In a traditional setup, switching between multiple platforms slows you down.
Instead, start using a unified tool built for every stage of the data science workflow. Hex brings Python, SQL, and visualizations together in powerful notebooks so you can query your data, apply transformations, build models, and deliver insights all in a single platform.
Managing computational resources efficiently
Training complex models on big data can chew through resources faster than a kid in a candy store. Here’s how to cut your costs:
- Slim down your data. Use techniques like data sampling and dimensionality reduction to lighten the load without losing important information.
- Scale intelligently with the cloud. Cloud computing gives you scalability and flexibility. It’s also cost-efficient because you only pay for what you use.
- Train and run inference. Divide your data science workflow into two clear projects. First, create a training pipeline where models get trained on big data. This typically happens once a quarter or every six months. Then, you’ll run inference pipelines that use the trained model to forecast frequently (daily or weekly).
Version control and reproducibility
Whether you’re pre-processing data or building models, always store every version of your work. If (or when) something goes awry, you’ll be able to roll back to a working version without breaking a sweat.
Plus, data science workflows are experimental: you’ll test different models, tweak parameters, and try new strategies.
Versioning lets you easily compare past experiments and lock in the one that performs best.
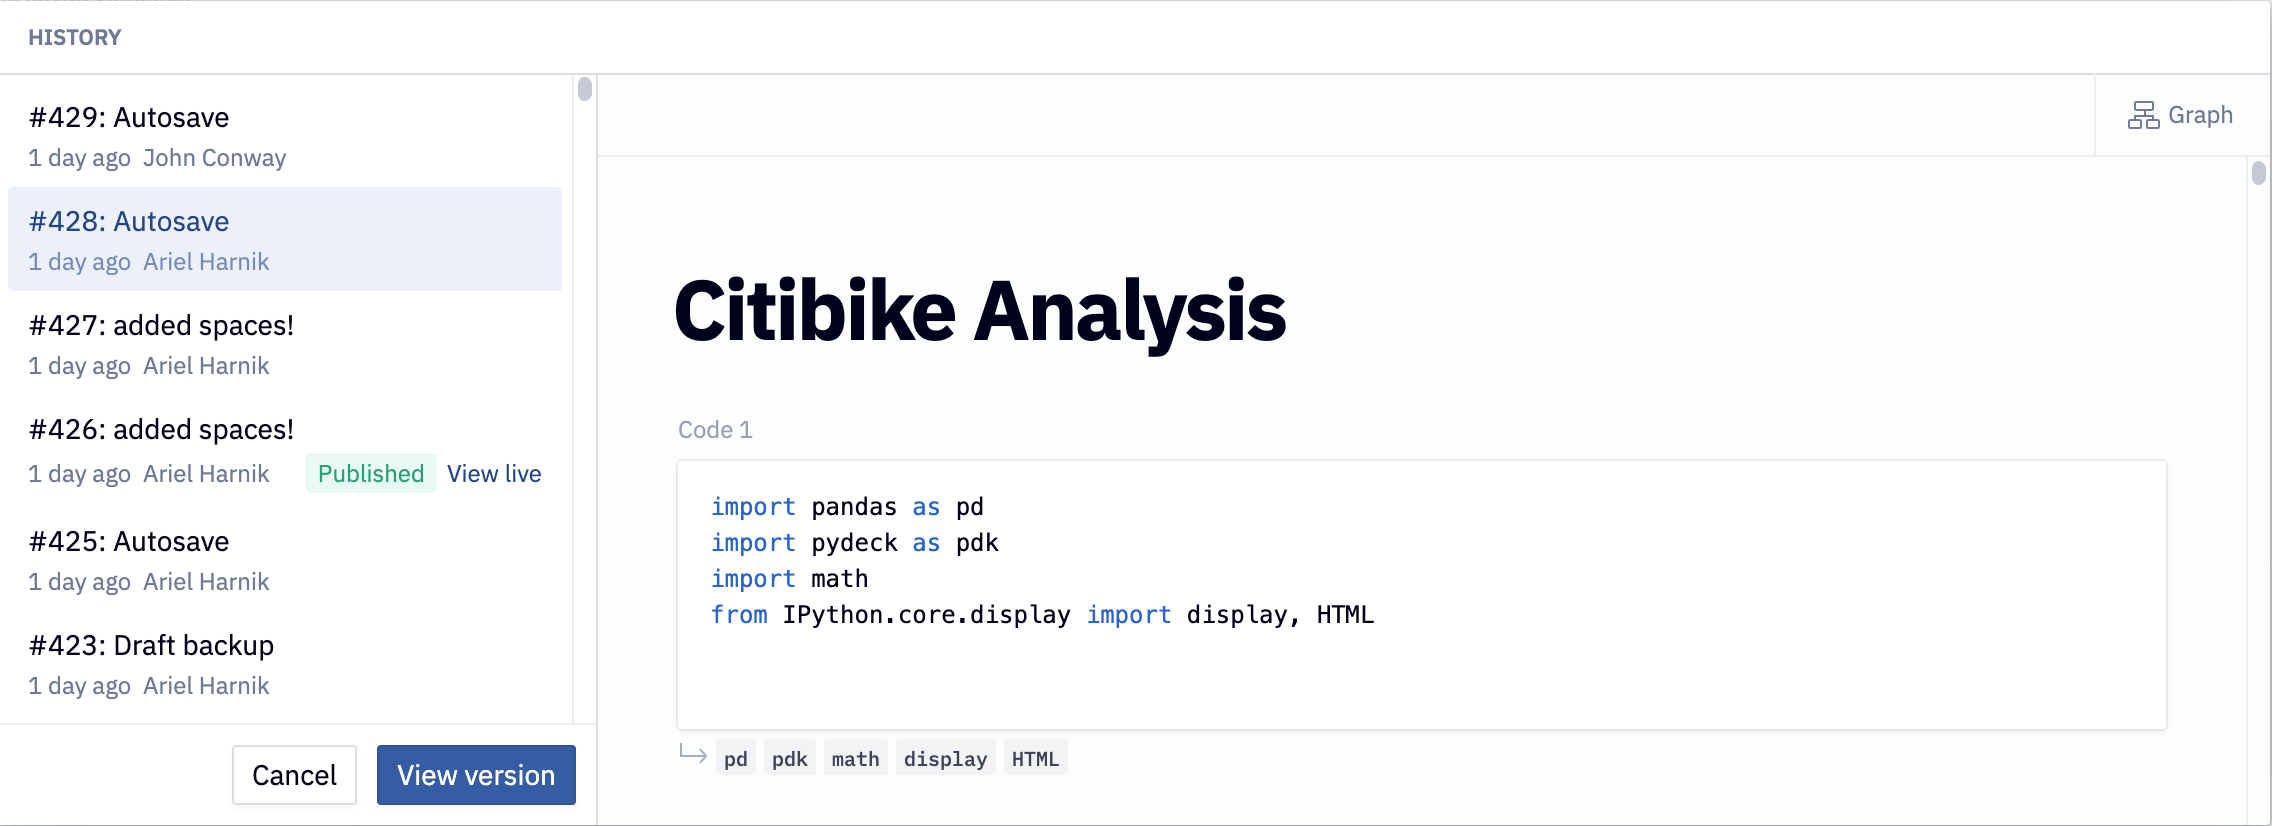
Version control also tracks who changed what and when (as shown in the image below). That shared history makes team collaboration smoother and faster.
Design more efficient data science workflows
Perhaps you’ve confirmed that your data science workflows are solid and humming right along — or, there may be a few ways to improve your existing processes. If you’ve got some work to do, we recommend prioritizing modularity, simplicity, and automation using modern tools.
Fortunately, Hex is built for that. You can connect your notebooks directly to your data warehouse, process data with your favorite Python libraries, and build powerful models, all without leaving the platform.
And when you’re ready to share your work? Use Hex’s app builder to create intuitive data apps and dashboards your end users will love (and actually use).
Here are a few more helpful templates for building efficient data science workflows to round out your toolkit and enhance your business decision-making.